8 ఉత్తమ బ్యాలెన్స్డ్ అడ్వాంటేజ్ మ్యూచువల్ ఫండ్లు 2022
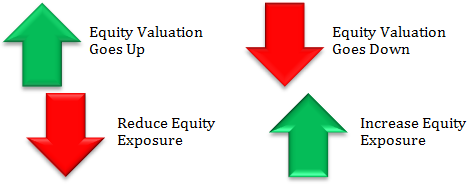
బ్యాలెన్స్డ్ అడ్వాంటేజ్ ఫండ్లు దాని డైరెక్ట్ ఈక్విటీ ఎక్స్పోజర్ని మొత్తం మీద ఆధారపడి సర్దుబాటు చేస్తాయిసంత మదింపులు ఖరీదైనవి లేదా చౌకైనవి (నఆధారంగా ధర నుండి-పుస్తకం విలువ) ఆ విధంగా, మార్కెట్ యొక్క ధర-నుండి-పుస్తకం విలువ నిష్పత్తి తక్కువగా ఉంటే (చారిత్రక విలువల ఆధారంగా), ఫండ్ దాని ప్రత్యక్ష స్టాక్ ఎక్స్పోజర్ను పెంచుతుంది మరియు ఆర్బిట్రేజ్పై తక్కువ ఆధారపడుతుంది మరియు దీనికి విరుద్ధంగా ఉంటుంది.

టాప్ బ్యాలెన్స్డ్ అడ్వాంటేజ్ ఫండ్స్మ్యూచువల్ ఫండ్స్ వారి ఆస్తులలో 65% కంటే ఎక్కువ పెట్టుబడి పెట్టిందిఈక్విటీలు మరియు రుణ సాధనాలలో మిగిలిన ఆస్తులు మంచి మొత్తం రాబడిని అందిస్తాయి. బ్యాలెన్స్డ్ మ్యూచువల్ ఫండ్లు కొన్ని స్థిర రాబడి కోసం చూస్తున్నప్పుడు మార్కెట్ రిస్క్ తీసుకోవడానికి సిద్ధంగా ఉన్న పెట్టుబడిదారులకు ప్రయోజనకరంగా ఉంటాయి. ఈక్విటీలు మరియు స్టాక్లలో పెట్టుబడి పెట్టబడిన ఆస్తులు మార్కెట్-లింక్డ్ రిటర్న్లను అందిస్తాయి, అయితే డెట్ సాధనాలలో పెట్టుబడి పెట్టబడిన ఆస్తులు స్థిరమైన రాబడిని అందిస్తాయి. ఈక్విటీ మరియు డెట్ రెండింటి కలయిక అయినందున, పెట్టుబడిదారులు చాలా జాగ్రత్తగా ఉండాలిపెట్టుబడి పెడుతున్నారు ఈ నిధులలో. పెట్టుబడిదారులు టాప్ కోసం చూడాలని సూచించారుబ్యాలెన్స్డ్ ఫండ్ బ్యాలెన్స్డ్ మ్యూచువల్ ఫండ్స్లో ఇన్వెస్ట్ చేసే ముందు. మేము టాప్ బ్యాలెన్స్డ్ మ్యూచువల్ ఫండ్లను దిగువ జాబితా చేసాము.
బ్యాలెన్స్డ్ అడ్వాంటేజ్ మ్యూచువల్ ఫండ్స్ అంటే ఏమిటి?
ఇటీవలిSEBI ఏప్రిల్ 2018 నాటి నిబంధనలు కొత్త వర్గాలను సృష్టించాయి, వాటిలో ఒకటి డైనమిక్ అని పిలువబడుతుందిఆస్తి కేటాయింపు లేదా బ్యాలెన్స్డ్ అడ్వాంటేజ్ ఫండ్ (BAF). ఈ కేటగిరీలోని ఫండ్లు "డైనమిక్గా నిర్వహించబడే ఈక్విటీ/డెట్లో పెట్టుబడి" కలిగి ఉండాలని కట్టుబాటు చెబుతోంది. ఇది "డైనమిక్" కాబట్టి, నిర్వచనం ప్రకారంAMCలు ఈ నిధుల నిర్వహణలో సౌలభ్యాన్ని కలిగి ఉంటాయి. గందరగోళానికి కారణం ఏమిటంటే, ఈ వర్గంలోని ఫండ్లను "సమతుల్య ప్రయోజనం" అని పిలుస్తారు కాబట్టి, అంత అవగాహన లేని పెట్టుబడిదారులు వీటిని మునుపటి రోజుల బ్యాలెన్స్డ్ ఫండ్లతో సమం చేస్తారు.
పూర్వపు బ్యాలెన్స్డ్ ఫండ్లు ఇప్పుడు అగ్రెసివ్ హైబ్రిడ్ ఫండ్లుగా ఉన్నాయని మరియు బ్యాలెన్స్డ్ అడ్వాంటేజ్ ఫండ్లు హైబర్డ్ కింద వేరే ఉప వర్గానికి చెందినవని గమనించవచ్చు.
బ్యాలెన్స్డ్ అడ్వాంటేజ్ మ్యూచువల్ ఫండ్స్ ఎందుకు?
మార్కెట్ వాల్యుయేషన్ల రీడింగ్ ప్రకారం నికర ఈక్విటీ ఎక్స్పోజర్పై ఫండ్ మేనేజర్ కాల్లతో వెళ్లడానికి డైనమిక్ అసెట్ అలోకేషన్ ఫండ్స్ లేదా BAFలలోకి ప్రవేశించాలి. గందరగోళాన్ని నివారించడానికి, BAFని మునుపటి బ్యాలెన్స్డ్ ఫండ్లతో సమానం చేయవద్దు. రెండు వర్గాలకు వారి స్వంత మెరిట్లు ఉన్నాయి మరియు రెండూ ఈక్విటీ-సంబంధిత పన్నులకు అర్హులు, కానీ తేడా ఏమిటంటే దూకుడు హైబ్రిడ్ ఫండ్లు సాంప్రదాయ ఈక్విటీ ఎక్స్పోజర్ను కలిగి ఉంటాయి, అయితే BAFలు ఈక్విటీకి తక్కువ నికర ఎక్స్పోజర్ను కలిగి ఉండవచ్చు మరియు రిస్క్కు సంబంధించి మరింత స్థిరమైన రాబడిని అందించవచ్చు. వారు తీసుకుంటున్నారు.
Talk to our investment specialist
భారతదేశంలో పెట్టుబడుల కోసం 8 ఉత్తమ బ్యాలెన్స్డ్ అడ్వాంటేజ్ మ్యూచువల్ ఫండ్లు 2022 - 2023
(Erstwhile HDFC Growth Fund and HDFC Prudence Fund) Aims to generate long term capital appreciation from a portfolio that is invested predominantly in equity and equity related instruments. Research Highlights for HDFC Balanced Advantage Fund Below is the key information for HDFC Balanced Advantage Fund Returns up to 1 year are on The fund objective is to seek low volatility returns by using arbitrage and other derivative strategies in equity markets and investments in short-term debt portfolio.The fund invests in equity with usage of derivatives. Research Highlights for ICICI Prudential Balanced Advantage Fund Below is the key information for ICICI Prudential Balanced Advantage Fund Returns up to 1 year are on The primary objective of the Scheme is to generate long term growth of capital and income distribution with relatively lower volatility by investing in a dynamically balanced portfolio of Equity & Equity linked investments and fixed-income securities. Research Highlights for Aditya Birla Sun Life Balanced Advantage Fund Below is the key information for Aditya Birla Sun Life Balanced Advantage Fund Returns up to 1 year are on (Erstwhile Reliance NRI Equity Fund) The investment objective of the Scheme is to generate optimal returns by investing in equity or equity related instruments primarily drawn from the Companies in the S&P BSE 200 Index. The Scheme may also invest in listed
companies that are in the top 200 by market capitalization on the BSE. The Scheme may also invest in large IPO’s where the market capitalization of the Company making the IPO based on the Issue price would make such company to be a part of the top 200 companies listed on the BSE based on market capitalization. The fund will have the flexibility to invest in a broad range of companies with an objective to maximize the returns, at the same time trying to minimize the risk by reasonable diversification. The selection of the companies will be done so as to capture the growth in the Indian economy. The fund will be focusing on companies with relatively higher market capitalization and having good liquidity in the stock market. Research Highlights for Nippon India Balanced Advantage Fund Below is the key information for Nippon India Balanced Advantage Fund Returns up to 1 year are on (Erstwhile Edelweiss Dynamic Equity Advantage Fund) The primary objective of the scheme will be to generate absolute returns with low volatility over a longer tenure of time. The scheme will invest in arbitrage opportunities, equity derivative strategies, pure equity investments and the balance in debt and money market instruments. The Scheme proposes to allocate assets to both equity and debt markets based upon the market view. However there is no assurance that the investment objective of the scheme will be realized. Research Highlights for Edelweiss Balanced Advantage Fund Below is the key information for Edelweiss Balanced Advantage Fund Returns up to 1 year are on The investment objective of the Scheme is to generate long-term capital growth from a focused portfolio of predominantly equity and equity-related securities. Research Highlights for Invesco India Dynamic Equity Fund Below is the key information for Invesco India Dynamic Equity Fund Returns up to 1 year are on The investment objective of the Scheme is to seek capital appreciation by managing the asset allocation between specified equity mutual fund schemes and debt mutual fund schemes of DSP BlackRock Mutual Fund. The Scheme will dynamically manage the asset allocation between the specified equity mutual funds schemes and debt mutual funds schemes of DSP BlackRock Mutual Fund based on the relative valuation of equity and debt markets. The Scheme may also invest a certain portion of its corpus in money market securities and/ or money market/liquid schemes of DSP BlackRock Mutual Fund, in order to meet liquidity requirements from time to time. Research Highlights for DSP Dynamic Asset Allocation Fund Below is the key information for DSP Dynamic Asset Allocation Fund Returns up to 1 year are on The objective of the fund will be to provide investors with an opportunity to invest in a portfolio of a mix of equity and equity related securities and fixed income instruments. The allocation between fixed income and equity instruments will be managed dynamically so as to provide investors with long term capital appreciation However, there can be no assurance that the investment objective of the Scheme will be achieved. Research Highlights for SBI Dynamic Asset Allocation Fund Below is the key information for SBI Dynamic Asset Allocation Fund Returns up to 1 year are on Fund NAV Net Assets (Cr) 3 MO (%) 6 MO (%) 1 YR (%) 3 YR (%) 5 YR (%) 2025 (%) HDFC Balanced Advantage Fund Growth ₹526.398
↑ 1.43 ₹106,456 2.3 0.1 2.2 12.7 14.9 7.2 ICICI Prudential Balanced Advantage Fund Growth ₹79.27
↑ 0.36 ₹72,486 4.7 3.4 7.6 11.8 11.2 12.2 Aditya Birla Sun Life Balanced Advantage Fund Growth ₹113.29
↑ 0.25 ₹9,490 4.4 4.3 6.8 11.2 9.8 10.1 Nippon India Balanced Advantage Fund Growth ₹184.266
↑ 0.22 ₹9,796 3.5 3.3 4.8 10.4 9.2 7.3 Edelweiss Balanced Advantage Fund Growth ₹53.26
↑ 0.21 ₹13,031 3.5 3 5.9 9.9 9.4 7 Invesco India Dynamic Equity Fund Growth ₹52.88
↓ -0.04 ₹996 2.9 -1.1 -1.7 8.5 8.1 2.7 DSP Dynamic Asset Allocation Fund Growth ₹28.795
↑ 0.04 ₹3,749 2.8 1.9 4.5 10 8.1 8.7 SBI Dynamic Asset Allocation Fund Growth ₹15.9463
↑ 0.03 ₹655 3.9 6.2 25.1 6.9 8.3 Note: Returns up to 1 year are on absolute basis & more than 1 year are on CAGR basis. as on 31 Jul 26 Research Highlights & Commentary of 8 Funds showcased
Commentary HDFC Balanced Advantage Fund ICICI Prudential Balanced Advantage Fund Aditya Birla Sun Life Balanced Advantage Fund Nippon India Balanced Advantage Fund Edelweiss Balanced Advantage Fund Invesco India Dynamic Equity Fund DSP Dynamic Asset Allocation Fund SBI Dynamic Asset Allocation Fund Point 1 Highest AUM (₹106,456 Cr). Top quartile AUM (₹72,486 Cr). Lower mid AUM (₹9,490 Cr). Upper mid AUM (₹9,796 Cr). Upper mid AUM (₹13,031 Cr). Bottom quartile AUM (₹996 Cr). Lower mid AUM (₹3,749 Cr). Bottom quartile AUM (₹655 Cr). Point 2 Established history (25+ yrs). Established history (19+ yrs). Oldest track record among peers (26 yrs). Established history (21+ yrs). Established history (16+ yrs). Established history (18+ yrs). Established history (12+ yrs). Established history (11+ yrs). Point 3 Top rated. Rating: 3★ (top quartile). Rating: 3★ (upper mid). Rating: 3★ (upper mid). Rating: 2★ (lower mid). Rating: 2★ (lower mid). Rating: 1★ (bottom quartile). Not Rated. Point 4 Risk profile: Moderately High. Risk profile: Moderately High. Risk profile: Moderately High. Risk profile: Moderately High. Risk profile: Moderately High. Risk profile: Moderately High. Risk profile: Moderate. Risk profile: Moderately High. Point 5 5Y return: 14.94% (top quartile). 5Y return: 11.16% (top quartile). 5Y return: 9.80% (upper mid). 5Y return: 9.22% (lower mid). 5Y return: 9.38% (upper mid). 5Y return: 8.13% (bottom quartile). 5Y return: 8.08% (bottom quartile). 5Y return: 8.31% (lower mid). Point 6 3Y return: 12.67% (top quartile). 3Y return: 11.83% (top quartile). 3Y return: 11.17% (upper mid). 3Y return: 10.43% (upper mid). 3Y return: 9.95% (lower mid). 3Y return: 8.51% (bottom quartile). 3Y return: 10.04% (lower mid). 3Y return: 6.92% (bottom quartile). Point 7 1Y return: 2.22% (bottom quartile). 1Y return: 7.62% (top quartile). 1Y return: 6.81% (upper mid). 1Y return: 4.79% (lower mid). 1Y return: 5.88% (upper mid). 1Y return: -1.71% (bottom quartile). 1Y return: 4.52% (lower mid). 1Y return: 25.12% (top quartile). Point 8 1M return: 1.35% (lower mid). 1M return: 2.72% (top quartile). 1M return: 2.44% (top quartile). 1M return: 1.56% (lower mid). 1M return: 2.31% (upper mid). 1M return: 1.67% (upper mid). 1M return: 0.70% (bottom quartile). 1M return: 1.04% (bottom quartile). Point 9 Alpha: 0.00 (top quartile). Alpha: 0.00 (top quartile). Alpha: 0.00 (upper mid). Alpha: 0.00 (upper mid). Alpha: 0.00 (lower mid). Alpha: 0.00 (lower mid). Alpha: 0.00 (bottom quartile). Alpha: 0.00 (bottom quartile). Point 10 Sharpe: -0.46 (bottom quartile). Sharpe: -0.12 (top quartile). Sharpe: -0.22 (upper mid). Sharpe: -0.27 (lower mid). Sharpe: -0.36 (lower mid). Sharpe: -0.97 (bottom quartile). Sharpe: -0.20 (upper mid). Sharpe: 2.59 (top quartile). HDFC Balanced Advantage Fund
ICICI Prudential Balanced Advantage Fund
Aditya Birla Sun Life Balanced Advantage Fund
Nippon India Balanced Advantage Fund
Edelweiss Balanced Advantage Fund
Invesco India Dynamic Equity Fund
DSP Dynamic Asset Allocation Fund
SBI Dynamic Asset Allocation Fund
1. HDFC Balanced Advantage Fund
HDFC Balanced Advantage Fund
Growth Launch Date 11 Sep 00 NAV (31 Jul 26) ₹526.398 ↑ 1.43 (0.27 %) Net Assets (Cr) ₹106,456 on 30 Jun 26 Category Hybrid - Dynamic Allocation AMC HDFC Asset Management Company Limited Rating ☆☆☆☆ Risk Moderately High Expense Ratio 1.36 Sharpe Ratio -0.46 Information Ratio 0 Alpha Ratio 0 Min Investment 5,000 Min SIP Investment 300 Exit Load 0-1 Years (1%),1 Years and above(NIL) Growth of 10,000 investment over the years.
Date Value 31 Jul 21 ₹10,000 31 Jul 22 ₹11,362 31 Jul 23 ₹14,023 31 Jul 24 ₹19,484 31 Jul 25 ₹19,621 31 Jul 26 ₹20,057 Returns for HDFC Balanced Advantage Fund
absolute basis & more than 1 year are on CAGR (Compound Annual Growth Rate) basis. as on 31 Jul 26 Duration Returns 1 Month 1.3% 3 Month 2.3% 6 Month 0.1% 1 Year 2.2% 3 Year 12.7% 5 Year 14.9% 10 Year 15 Year Since launch 17.6% Historical performance (Yearly) on absolute basis
Year Returns 2025 7.2% 2024 16.7% 2023 31.3% 2022 18.8% 2021 26.4% 2020 7.6% 2019 6.9% 2018 -3.1% 2017 27.9% 2016 9.4% Fund Manager information for HDFC Balanced Advantage Fund
Name Since Tenure Anil Bamboli 29 Jul 22 3.93 Yr. Gopal Agrawal 29 Jul 22 3.93 Yr. Arun Agarwal 6 Oct 22 3.74 Yr. Srinivasan Ramamurthy 29 Jul 22 3.93 Yr. Dhruv Muchhal 22 Jun 23 3.03 Yr. Nandita Menezes 29 Mar 25 1.26 Yr. Data below for HDFC Balanced Advantage Fund as on 30 Jun 26
Asset Allocation
Asset Class Value Cash 3.61% Equity 70.92% Debt 25.47% Equity Sector Allocation
Sector Value Financial Services 23.37% Industrials 8.16% Consumer Cyclical 7.72% Energy 7.4% Technology 5.26% Health Care 4.77% Utility 4.25% Communication Services 3.32% Basic Materials 2.5% Consumer Defensive 2.23% Real Estate 1.95% Debt Sector Allocation
Sector Value Corporate 13.85% Government 12.26% Cash Equivalent 2.97% Credit Quality
Rating Value AA 1.81% AAA 98.19% Top Securities Holdings / Portfolio
Name Holding Value Quantity ICICI Bank Ltd (Financial Services)
Equity, Since 31 Oct 09 | ICICIBANK5% ₹4,931 Cr 39,244,463
↑ 2,000,000 HDFC Bank Ltd (Financial Services)
Equity, Since 31 Mar 22 | HDFCBANK4% ₹4,502 Cr 60,464,555
↑ 3,974,053 Reliance Industries Ltd (Energy)
Equity, Since 31 Dec 21 | RELIANCE4% ₹3,977 Cr 30,100,311 State Bank of India (Financial Services)
Equity, Since 31 May 07 | SBIN3% ₹3,375 Cr 35,000,000 Bharti Airtel Ltd (Communication Services)
Equity, Since 31 Aug 20 | BHARTIARTL3% ₹3,168 Cr 17,323,283 Larsen & Toubro Ltd (Industrials)
Equity, Since 30 Jun 12 | LT3% ₹2,682 Cr 6,579,083 Axis Bank Ltd (Financial Services)
Equity, Since 31 Aug 17 | AXISBANK2% ₹2,564 Cr 19,926,312 NTPC Ltd (Utilities)
Equity, Since 31 Aug 16 | NTPC2% ₹2,457 Cr 63,500,000 7.18% Govt Stock 2033
Sovereign Bonds | -2% ₹2,104 Cr 208,533,300
↓ -10,000,000 Coal India Ltd (Energy)
Equity, Since 31 Jan 18 | COALINDIA2% ₹1,978 Cr 43,189,746
↓ -1,010,254 2. ICICI Prudential Balanced Advantage Fund
ICICI Prudential Balanced Advantage Fund
Growth Launch Date 30 Dec 06 NAV (31 Jul 26) ₹79.27 ↑ 0.36 (0.46 %) Net Assets (Cr) ₹72,486 on 30 Jun 26 Category Hybrid - Dynamic Allocation AMC ICICI Prudential Asset Management Company Limited Rating ☆☆☆ Risk Moderately High Expense Ratio 1.47 Sharpe Ratio -0.12 Information Ratio 0 Alpha Ratio 0 Min Investment 5,000 Min SIP Investment 100 Exit Load 0-18 Months (1%),18 Months and above(NIL) Growth of 10,000 investment over the years.
Date Value 31 Jul 21 ₹10,000 31 Jul 22 ₹10,848 31 Jul 23 ₹12,137 31 Jul 24 ₹14,882 31 Jul 25 ₹15,773 31 Jul 26 ₹16,974 Returns for ICICI Prudential Balanced Advantage Fund
absolute basis & more than 1 year are on CAGR (Compound Annual Growth Rate) basis. as on 31 Jul 26 Duration Returns 1 Month 2.7% 3 Month 4.7% 6 Month 3.4% 1 Year 7.6% 3 Year 11.8% 5 Year 11.2% 10 Year 15 Year Since launch 11.2% Historical performance (Yearly) on absolute basis
Year Returns 2025 12.2% 2024 12.3% 2023 16.5% 2022 7.9% 2021 15.1% 2020 11.7% 2019 10.8% 2018 2.4% 2017 19% 2016 7.3% Fund Manager information for ICICI Prudential Balanced Advantage Fund
Name Since Tenure Rajat Chandak 7 Sep 15 10.82 Yr. Manish Banthia 18 Nov 09 16.63 Yr. Akhil Kakkar 22 Jan 24 2.44 Yr. Sri Sharma 30 Apr 21 5.17 Yr. Sharmila D'Silva 31 Jul 22 3.92 Yr. Data below for ICICI Prudential Balanced Advantage Fund as on 30 Jun 26
Asset Allocation
Asset Class Value Cash 20.42% Equity 61.56% Debt 17.92% Equity Sector Allocation
Sector Value Financial Services 19.09% Consumer Cyclical 17.06% Industrials 8.05% Technology 6.44% Real Estate 4.61% Basic Materials 4.39% Energy 3.58% Consumer Defensive 3.27% Health Care 1.8% Communication Services 1.73% Utility 1.42% Debt Sector Allocation
Sector Value Cash Equivalent 17.78% Government 10.79% Corporate 9.86% Credit Quality
Rating Value A 1.82% AA 19.31% AAA 77.08% Top Securities Holdings / Portfolio
Name Holding Value Quantity Nifty 50 Index $$
- | -5% -₹3,776 Cr 1,589,770
↑ 43,095 TVS Motor Co Ltd (Consumer Cyclical)
Equity, Since 30 Sep 16 | TVSMOTOR5% ₹3,591 Cr 10,702,390
↑ 100,000 ICICI Bank Ltd (Financial Services)
Equity, Since 31 May 12 | ICICIBANK4% ₹2,697 Cr 21,463,105
↓ -700,000 HDFC Bank Ltd (Financial Services)
Equity, Since 31 Mar 12 | HDFCBANK4% ₹2,481 Cr 33,326,632 Reliance Industries Ltd (Energy)
Equity, Since 31 Dec 08 | RELIANCE3% ₹2,129 Cr 16,113,856 Embassy Office Parks REIT (Real Estate)
-, Since 30 Apr 25 | EMBASSY3% ₹2,059 Cr 48,202,903 Infosys Ltd (Technology)
Equity, Since 31 Dec 08 | INFY3% ₹1,996 Cr 17,193,365
↓ -400,000 Larsen & Toubro Ltd (Industrials)
Equity, Since 29 Feb 12 | LT2% ₹1,706 Cr 4,184,431
↑ 224,271 Maruti Suzuki India Ltd (Consumer Cyclical)
Equity, Since 30 Apr 16 | MARUTI2% ₹1,434 Cr 1,092,069
↑ 50,000 State Bank of India (Financial Services)
Equity, Since 31 Jan 14 | SBIN2% ₹1,255 Cr 13,013,393
↑ 601,250 3. Aditya Birla Sun Life Balanced Advantage Fund
Aditya Birla Sun Life Balanced Advantage Fund
Growth Launch Date 25 Apr 00 NAV (31 Jul 26) ₹113.29 ↑ 0.25 (0.22 %) Net Assets (Cr) ₹9,490 on 30 Jun 26 Category Hybrid - Dynamic Allocation AMC Birla Sun Life Asset Management Co Ltd Rating ☆☆☆ Risk Moderately High Expense Ratio 1.79 Sharpe Ratio -0.22 Information Ratio 0 Alpha Ratio 0 Min Investment 1,000 Min SIP Investment 100 Exit Load 0-365 Days (1%),365 Days and above(NIL) Growth of 10,000 investment over the years.
Date Value 31 Jul 21 ₹10,000 31 Jul 22 ₹10,245 31 Jul 23 ₹11,616 31 Jul 24 ₹14,236 31 Jul 25 ₹14,944 31 Jul 26 ₹15,961 Returns for Aditya Birla Sun Life Balanced Advantage Fund
absolute basis & more than 1 year are on CAGR (Compound Annual Growth Rate) basis. as on 31 Jul 26 Duration Returns 1 Month 2.4% 3 Month 4.4% 6 Month 4.3% 1 Year 6.8% 3 Year 11.2% 5 Year 9.8% 10 Year 15 Year Since launch Historical performance (Yearly) on absolute basis
Year Returns 2025 10.1% 2024 13% 2023 16.5% 2022 4.2% 2021 13.4% 2020 15.4% 2019 8.1% 2018 0.7% 2017 15.2% 2016 16.3% Fund Manager information for Aditya Birla Sun Life Balanced Advantage Fund
Name Since Tenure Harish Krishnan 31 Oct 24 1.66 Yr. Lovelish Solanki 9 Oct 19 6.73 Yr. Mohit Sharma 1 Apr 17 9.25 Yr. Rohit Karan 2 Apr 26 0.24 Yr. Data below for Aditya Birla Sun Life Balanced Advantage Fund as on 30 Jun 26
Asset Allocation
Asset Class Value Cash 14.17% Equity 70.6% Debt 15.23% Equity Sector Allocation
Sector Value Financial Services 22.02% Consumer Cyclical 9.85% Industrials 8.66% Technology 6.79% Basic Materials 6.76% Consumer Defensive 6.07% Health Care 5.38% Energy 4.05% Real Estate 3.56% Utility 3.4% Communication Services 2.19% Debt Sector Allocation
Sector Value Cash Equivalent 15.77% Corporate 10.44% Government 3.19% Credit Quality
Rating Value AA 39.71% AAA 60.29% Top Securities Holdings / Portfolio
Name Holding Value Quantity ICICI Bank Ltd (Financial Services)
Equity, Since 31 Oct 09 | ICICIBANK4% ₹371 Cr 2,949,376 HDFC Bank Ltd (Financial Services)
Equity, Since 31 Mar 17 | HDFCBANK3% ₹276 Cr 3,708,152
↓ -550 Kotak Mahindra Bank Ltd (Financial Services)
Equity, Since 30 Apr 18 | KOTAKBANK3% ₹254 Cr 6,602,513
↑ 133,014 Reliance Industries Ltd (Energy)
Equity, Since 30 Sep 18 | RELIANCE2% ₹226 Cr 1,709,158
↓ -340,500 IndiGrid Infrastructure Trust Units Series - IV (Utilities)
Equity, Since 31 Dec 23 | INDIGRID2% ₹218 Cr 12,713,026 State Bank of India (Financial Services)
Equity, Since 31 Oct 20 | SBIN2% ₹192 Cr 1,988,137
↓ -145,146 Axis Bank Limited
Derivatives | -2% -₹177 Cr Axis Bank Ltd (Financial Services)
Equity, Since 31 Jan 18 | AXISBANK2% ₹176 Cr 1,365,000
↓ -16,125 Infosys Ltd (Technology)
Equity, Since 31 Dec 07 | INFY2% ₹171 Cr 1,470,922 7.18% Govt Stock 2037
Sovereign Bonds | -2% ₹156 Cr 15,500,000 4. Nippon India Balanced Advantage Fund
Nippon India Balanced Advantage Fund
Growth Launch Date 15 Nov 04 NAV (31 Jul 26) ₹184.266 ↑ 0.22 (0.12 %) Net Assets (Cr) ₹9,796 on 30 Jun 26 Category Hybrid - Dynamic Allocation AMC Nippon Life Asset Management Ltd. Rating ☆☆☆ Risk Moderately High Expense Ratio 1.75 Sharpe Ratio -0.27 Information Ratio 0 Alpha Ratio 0 Min Investment 5,000 Min SIP Investment 100 Exit Load 0-1 Years (1%),1 Years and above(NIL) Growth of 10,000 investment over the years.
Date Value 31 Jul 21 ₹10,000 31 Jul 22 ₹10,366 31 Jul 23 ₹11,543 31 Jul 24 ₹14,434 31 Jul 25 ₹14,834 31 Jul 26 ₹15,544 Returns for Nippon India Balanced Advantage Fund
absolute basis & more than 1 year are on CAGR (Compound Annual Growth Rate) basis. as on 31 Jul 26 Duration Returns 1 Month 1.6% 3 Month 3.5% 6 Month 3.3% 1 Year 4.8% 3 Year 10.4% 5 Year 9.2% 10 Year 15 Year Since launch 14.4% Historical performance (Yearly) on absolute basis
Year Returns 2025 7.3% 2024 13% 2023 17.5% 2022 5.1% 2021 15.7% 2020 11.2% 2019 8.3% 2018 0.4% 2017 25.2% 2016 6.4% Fund Manager information for Nippon India Balanced Advantage Fund
Name Since Tenure Sushil Budhia 31 Mar 21 5.25 Yr. Bhavik Dave 1 Jan 26 0.49 Yr. Amber Singhania 11 Mar 26 0.3 Yr. Data below for Nippon India Balanced Advantage Fund as on 30 Jun 26
Asset Allocation
Asset Class Value Equity 85.39% Debt 18.34% Equity Sector Allocation
Sector Value Financial Services 24.76% Consumer Cyclical 10.06% Industrials 9.6% Technology 5.93% Consumer Defensive 5.85% Real Estate 4.68% Utility 3.99% Health Care 3.59% Energy 3.25% Communication Services 2.93% Basic Materials 1.35% Debt Sector Allocation
Sector Value Corporate 11.83% Government 6.53% Credit Quality
Rating Value AA 37.47% AAA 62.53% Top Securities Holdings / Portfolio
Name Holding Value Quantity ICICI Bank Ltd (Financial Services)
Equity, Since 31 Aug 18 | ICICIBANK5% ₹516 Cr 4,110,000
↑ 100,000 HDFC Bank Ltd (Financial Services)
Equity, Since 31 Oct 11 | HDFCBANK5% ₹516 Cr 6,930,648
↑ 460,000 Reliance Industries Ltd (Energy)
Equity, Since 31 May 18 | RELIANCE3% ₹264 Cr 2,000,000
↑ 150,000 Axis Bank Ltd (Financial Services)
Equity, Since 31 Oct 18 | AXISBANK3% ₹248 Cr 1,929,348
↑ 70,000 Bharti Airtel Ltd (Communication Services)
Equity, Since 31 Aug 18 | BHARTIARTL3% ₹247 Cr 1,350,000 Infosys Ltd (Technology)
Equity, Since 31 May 09 | INFY2% ₹232 Cr 2,001,912 State Bank of India (Financial Services)
Equity, Since 31 Mar 09 | SBIN2% ₹222 Cr 2,306,879
↓ -110,000 NTPC Ltd (Utilities)
Equity, Since 31 Mar 21 | NTPC2% ₹202 Cr 5,212,720
↓ -250,000 Mahindra & Mahindra Ltd (Consumer Cyclical)
Equity, Since 30 Nov 21 | M&M2% ₹200 Cr 656,709 Larsen & Toubro Ltd (Industrials)
Equity, Since 31 Jan 21 | LT2% ₹188 Cr 460,017
↓ -44,000 5. Edelweiss Balanced Advantage Fund
Edelweiss Balanced Advantage Fund
Growth Launch Date 20 Aug 09 NAV (31 Jul 26) ₹53.26 ↑ 0.21 (0.40 %) Net Assets (Cr) ₹13,031 on 30 Jun 26 Category Hybrid - Dynamic Allocation AMC Edelweiss Asset Management Limited Rating ☆☆ Risk Moderately High Expense Ratio 1.69 Sharpe Ratio -0.37 Information Ratio 0 Alpha Ratio 0 Min Investment 1,000 Min SIP Investment 500 Exit Load 0-365 Days (1%),365 Days and above(NIL) Growth of 10,000 investment over the years.
Date Value 31 Jul 21 ₹10,000 31 Jul 22 ₹10,406 31 Jul 23 ₹11,778 31 Jul 24 ₹14,788 31 Jul 25 ₹14,785 31 Jul 26 ₹15,655 Returns for Edelweiss Balanced Advantage Fund
absolute basis & more than 1 year are on CAGR (Compound Annual Growth Rate) basis. as on 31 Jul 26 Duration Returns 1 Month 2.3% 3 Month 3.5% 6 Month 3% 1 Year 5.9% 3 Year 9.9% 5 Year 9.4% 10 Year 15 Year Since launch 10.4% Historical performance (Yearly) on absolute basis
Year Returns 2025 7% 2024 13.1% 2023 18.8% 2022 2.1% 2021 18.8% 2020 22.6% 2019 7.8% 2018 1.9% 2017 23.9% 2016 -1.5% Fund Manager information for Edelweiss Balanced Advantage Fund
Name Since Tenure Kedar Karnik 15 Jan 26 0.46 Yr. Bhavesh Jain 7 Aug 13 12.91 Yr. Bharat Lahoti 18 Sep 17 8.79 Yr. Rahul Dedhia 23 Nov 21 4.61 Yr. Data below for Edelweiss Balanced Advantage Fund as on 30 Jun 26
Asset Allocation
Asset Class Value Cash 8.46% Equity 83.07% Debt 8.44% Other 0% Equity Sector Allocation
Sector Value Financial Services 24.46% Consumer Cyclical 11.56% Industrials 8.88% Technology 7.23% Health Care 5.83% Basic Materials 5.66% Energy 4.97% Consumer Defensive 4.91% Communication Services 4.73% Utility 1.6% Real Estate 0.65% Debt Sector Allocation
Sector Value Corporate 9.28% Cash Equivalent 4.65% Government 3% Credit Quality
Rating Value AAA 96.44% Top Securities Holdings / Portfolio
Name Holding Value Quantity ICICI Bank Ltd (Financial Services)
Equity, Since 30 Nov 14 | ICICIBANK4% ₹541 Cr 4,309,176 Reliance Industries Ltd (Energy)
Equity, Since 30 Nov 21 | RELIANCE4% ₹502 Cr 3,800,180 Larsen & Toubro Ltd (Industrials)
Equity, Since 30 Jun 20 | LT3% ₹423 Cr 1,037,645 HDFC Bank Ltd (Financial Services)
Equity, Since 30 Jun 20 | HDFCBANK3% ₹413 Cr 5,544,682 Bharti Airtel Ltd (Communication Services)
Equity, Since 31 Dec 19 | BHARTIARTL3% ₹367 Cr 2,006,116 State Bank of India (Financial Services)
Equity, Since 31 Jan 17 | SBIN2% ₹301 Cr 3,124,824 TVS Motor Co Ltd (Consumer Cyclical)
Equity, Since 30 Jun 21 | TVSMOTOR2% ₹292 Cr 869,904 Infosys Ltd (Technology)
Equity, Since 30 Jun 20 | INFY2% ₹278 Cr 2,392,080
↓ -122,400 GE Vernova T&D India Ltd (Industrials)
Equity, Since 30 Jun 25 | GVT&D2% ₹206 Cr 400,000 Axis Bank Ltd (Financial Services)
Equity, Since 30 Sep 18 | AXISBANK2% ₹194 Cr 1,507,073 6. Invesco India Dynamic Equity Fund
Invesco India Dynamic Equity Fund
Growth Launch Date 4 Oct 07 NAV (31 Jul 26) ₹52.88 ↓ -0.04 (-0.08 %) Net Assets (Cr) ₹996 on 30 Jun 26 Category Hybrid - Dynamic Allocation AMC Invesco Asset Management (India) Private Ltd Rating ☆☆ Risk Moderately High Expense Ratio 2.17 Sharpe Ratio -0.97 Information Ratio 0 Alpha Ratio 0 Min Investment 5,000 Min SIP Investment 500 Exit Load NIL Growth of 10,000 investment over the years.
Date Value 31 Jul 21 ₹10,000 31 Jul 22 ₹10,137 31 Jul 23 ₹11,568 31 Jul 24 ₹14,598 31 Jul 25 ₹15,036 31 Jul 26 ₹14,779 Returns for Invesco India Dynamic Equity Fund
absolute basis & more than 1 year are on CAGR (Compound Annual Growth Rate) basis. as on 31 Jul 26 Duration Returns 1 Month 1.7% 3 Month 2.9% 6 Month -1.1% 1 Year -1.7% 3 Year 8.5% 5 Year 8.1% 10 Year 15 Year Since launch 9.3% Historical performance (Yearly) on absolute basis
Year Returns 2025 2.7% 2024 15.9% 2023 20.1% 2022 4.1% 2021 13.1% 2020 7.8% 2019 9.1% 2018 -4.6% 2017 30.5% 2016 2.7% Fund Manager information for Invesco India Dynamic Equity Fund
Name Since Tenure Deepak Gupta 25 Jun 26 0.01 Yr. Krishna Cheemalapati 1 Mar 25 1.33 Yr. Amey Sathe 4 Nov 25 0.65 Yr. Data below for Invesco India Dynamic Equity Fund as on 30 Jun 26
Asset Allocation
Asset Class Value Cash 22.84% Equity 58.21% Debt 18.88% Other 0.07% Equity Sector Allocation
Sector Value Financial Services 25.97% Consumer Cyclical 9.51% Technology 8.32% Consumer Defensive 7.41% Industrials 7.06% Energy 6.92% Basic Materials 3.23% Health Care 2.98% Communication Services 0.39% Debt Sector Allocation
Sector Value Cash Equivalent 20.3% Corporate 11.06% Government 10.36% Credit Quality
Rating Value AAA 100% Top Securities Holdings / Portfolio
Name Holding Value Quantity Invesco India Shrt DurDir Gr
Investment Fund | -8% ₹85 Cr 207,434 HDFC Bank Ltd (Financial Services)
Equity, Since 30 Sep 24 | HDFCBANK8% ₹80 Cr 1,071,450 Invesco India Low Dur Dir Gr
Investment Fund | -8% ₹78 Cr 188,958 Reliance Industries Ltd (Energy)
Equity, Since 30 Apr 21 | RELIANCE7% ₹70 Cr 532,500 ICICI Bank Ltd (Financial Services)
Equity, Since 31 Oct 18 | ICICIBANK6% ₹58 Cr 465,500
↑ 80,500 Eternal Ltd (Consumer Cyclical)
Equity, Since 31 Mar 24 | ETERNAL4% ₹44 Cr 1,758,975 Future on BANK Index
- | -4% -₹38 Cr 465,950
↓ -21,500 Future on Reliance Industries Ltd
Derivatives | -3% -₹32 Cr 237,500
↑ 237,500 Infosys Ltd (Technology)
Equity, Since 31 Oct 24 | INFY3% ₹31 Cr 270,000 Eternal Limited June 2026 Future
Derivatives | -3% -₹27 Cr 1,083,975
↑ 1,083,975 7. DSP Dynamic Asset Allocation Fund
DSP Dynamic Asset Allocation Fund
Growth Launch Date 6 Feb 14 NAV (31 Jul 26) ₹28.795 ↑ 0.04 (0.13 %) Net Assets (Cr) ₹3,749 on 30 Jun 26 Category Hybrid - Dynamic Allocation AMC DSP BlackRock Invmt Managers Pvt. Ltd. Rating ☆ Risk Moderate Expense Ratio 1.93 Sharpe Ratio -0.2 Information Ratio 0 Alpha Ratio 0 Min Investment 1,000 Min SIP Investment 500 Exit Load 0-12 Months (1%),12 Months and above(NIL) Growth of 10,000 investment over the years.
Date Value 31 Jul 21 ₹10,000 31 Jul 22 ₹10,156 31 Jul 23 ₹11,070 31 Jul 24 ₹13,332 31 Jul 25 ₹14,112 31 Jul 26 ₹14,749 Returns for DSP Dynamic Asset Allocation Fund
absolute basis & more than 1 year are on CAGR (Compound Annual Growth Rate) basis. as on 31 Jul 26 Duration Returns 1 Month 0.7% 3 Month 2.8% 6 Month 1.9% 1 Year 4.5% 3 Year 10% 5 Year 8.1% 10 Year 15 Year Since launch 8.8% Historical performance (Yearly) on absolute basis
Year Returns 2025 8.7% 2024 12.4% 2023 17.1% 2022 0.1% 2021 9.3% 2020 12.9% 2019 8.8% 2018 3.6% 2017 12.5% 2016 7.7% Fund Manager information for DSP Dynamic Asset Allocation Fund
Name Since Tenure Rohit Singhania 1 Nov 23 2.67 Yr. Preethi S 1 Oct 25 0.75 Yr. Shantanu Godambe 1 Jan 25 1.5 Yr. Kaivalya Nadkarni 1 Oct 24 1.75 Yr. Data below for DSP Dynamic Asset Allocation Fund as on 30 Jun 26
Asset Allocation
Asset Class Value Cash 29.25% Equity 45.17% Debt 25.59% Equity Sector Allocation
Sector Value Financial Services 30.03% Consumer Cyclical 5.73% Health Care 3.37% Consumer Defensive 3.31% Basic Materials 3.25% Utility 3.24% Technology 3.24% Communication Services 2.67% Industrials 2.31% Energy 0.86% Debt Sector Allocation
Sector Value Cash Equivalent 27.95% Corporate 14.72% Government 12.17% Credit Quality
Rating Value AA 15.94% AAA 84.06% Top Securities Holdings / Portfolio
Name Holding Value Quantity ICICI Bank Ltd (Financial Services)
Equity, Since 28 Feb 18 | ICICIBANK6% ₹216 Cr 1,716,389
↑ 146,068 HDFC Bank Ltd (Financial Services)
Equity, Since 28 Feb 18 | HDFCBANK5% ₹185 Cr 2,478,718
↑ 120,252 Axis Bank Ltd (Financial Services)
Equity, Since 30 Sep 18 | AXISBANK4% ₹131 Cr 1,019,881
↑ 144,013 7.32% Govt Stock 2030
Sovereign Bonds | -3% ₹108 Cr 10,500,000 Icici Bank Limited Jun26
Derivatives | -3% -₹93 Cr 731,500
↑ 731,500 Icici Bank Limited
Equity, Since 28 Feb 18 | ICICIBANK3% ₹92 Cr 731,500
↑ 200,900 Hdfc Bank Limited
Equity, Since 28 Feb 18 | HDFCBANK2% ₹87 Cr 1,163,800
↓ -599,500 Hdfc Bank Limited Jun26
Derivatives | -2% -₹86 Cr 1,163,800
↑ 1,163,800 Bandhan Bank Limited Jun26
Derivatives | -2% -₹82 Cr 3,895,200
↑ 3,895,200 Bandhan Bank Ltd (Financial Services)
Equity, Since 31 Dec 23 | BANDHANBNK2% ₹81 Cr 3,895,200 8. SBI Dynamic Asset Allocation Fund
SBI Dynamic Asset Allocation Fund
Growth Launch Date 26 Mar 15 NAV (02 Jul 21) ₹15.9463 ↑ 0.03 (0.18 %) Net Assets (Cr) ₹655 on 31 May 21 Category Hybrid - Dynamic Allocation AMC SBI Funds Management Private Limited Rating Risk Moderately High Expense Ratio 2.07 Sharpe Ratio 2.59 Information Ratio 0 Alpha Ratio 0 Min Investment 5,000 Min SIP Investment 500 Exit Load 0-12 Months (1%),12 Months and above(NIL) Growth of 10,000 investment over the years.
Date Value Returns for SBI Dynamic Asset Allocation Fund
absolute basis & more than 1 year are on CAGR (Compound Annual Growth Rate) basis. as on 31 Jul 26 Duration Returns 1 Month 1% 3 Month 3.9% 6 Month 6.2% 1 Year 25.1% 3 Year 6.9% 5 Year 8.3% 10 Year 15 Year Since launch 7.7% Historical performance (Yearly) on absolute basis
Year Returns 2025 2024 2023 2022 2021 2020 2019 2018 2017 2016 Fund Manager information for SBI Dynamic Asset Allocation Fund
Name Since Tenure Data below for SBI Dynamic Asset Allocation Fund as on 31 May 21
Asset Allocation
Asset Class Value Equity Sector Allocation
Sector Value Debt Sector Allocation
Sector Value Credit Quality
Rating Value Top Securities Holdings / Portfolio
Name Holding Value Quantity
ఇక్కడ అందించిన సమాచారం ఖచ్చితమైనదని నిర్ధారించడానికి అన్ని ప్రయత్నాలు చేయబడ్డాయి. అయినప్పటికీ, డేటా యొక్క ఖచ్చితత్వానికి సంబంధించి ఎటువంటి హామీలు ఇవ్వబడవు. దయచేసి ఏదైనా పెట్టుబడి పెట్టే ముందు పథకం సమాచార పత్రంతో ధృవీకరించండి.


AMFI Registration No. 112358 | CIN: U74999MH2016PTC282153
Shepard Technologies Pvt. Ltd. (with ARN code 112358) makes no warranties or representations, express or implied, on products offered through the platform. It accepts no liability for any damages or losses, however caused, in connection with the use of, or on the reliance of its product or related services. Terms and conditions of the website are applicable.
©2026 Shepard Technologies Private Limited. All Rights Reserved
Informative . Comparison has been shown nicely in small space.