ایف ڈی کیلکولیٹر - فکسڈ ڈپازٹ کیلکولیٹر
فکسڈ ڈپازٹ طویل مدتی سرمایہ کاری کا آلہ ہے جو سرمایہ کاروں کی مدد کرتا ہے۔پیسے بچانا طویل مدت کے لئے. سرمایہ کار ایک مقررہ مدت کا انتخاب کر سکتے ہیں جس کے لیے ڈپازٹ کے پاس رکھا جائے گا۔بینک. عام طور پر،ایف ڈی سرمایہ کاری ان لوگوں کے لیے بہتر ہے جو طویل مدتی دولت کی تخلیق کے خواہاں ہیں کیونکہ وہ بچت کھاتوں کے مقابلے میں زیادہ شرح سود پیش کرتے ہیں۔
FD سود کا حساب کیسے لگایا جاتا ہے؟
زیادہ تر بینکوں میں، FD پر سود سہ ماہی میں بڑھایا جاتا ہے۔ اس کا فارمولا یہ ہے:
A = P * (1+ r/n) ^ n*t، کہاں

- میں = اے - پی
- اے = پختگی کی قیمت
- پی = اصل رقم
- r = شرح سود
- t = سالوں کی تعداد
- n = مرکب سود کی تعدد
- میں = سود سے کمائی گئی رقم
ایف ڈی کے فوائد
- FD بطور استعمال کیا جا سکتا ہے۔ضمانت قرض لینے کے لیے۔ آپ اپنی FD رقم پر 80-90% تک قرض لے سکتے ہیں۔
- جمع کنندہ مزید فکسڈ ڈپازٹ کے لیے میچورٹی کے وقت رقم منتقل کرنے کا انتخاب کر سکتا ہے۔
- رقم صرف ایک بار جمع کی جا سکتی ہے۔ ایک بار جمع ہونے کے بعد، اکاؤنٹ سے رقم نکالنے پر جرمانہ عائد ہوگا۔
- FD اسکیمیں ان لوگوں کے لیے سرمایہ کاری کے اچھے اوزار ہیں جن کے پاس فاضل فنڈز ہیں اور وہ اس سے پیسہ کمانا چاہتے ہیں۔
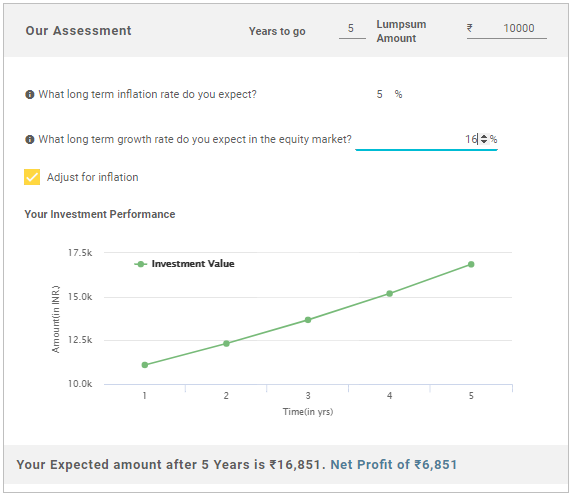
Investment Amount:₹100,000 Interest Earned:₹28,930.22 Maturity Amount: ₹128,930.22فکسڈ ڈپازٹ (FD) کیلکولیٹر
Talk to our investment specialist
ایف ڈی پر ٹیکس کے فوائد
دوسرے ذاتی ٹیکس کی بچت اور سرمایہ کاری کے آلات کی طرح، فکسڈ ڈپازٹ اسکیمیں بھی اپنی طرف متوجہ کرتی ہیں۔ٹیکس. اگر کل سود روپے سے زیادہ ہو تو FD سے جمع ہونے والے ریٹرن پر 10% کا TDS کاٹا جاتا ہے۔ 10،000 ایک مالی سال میں
آئیے اس کا موازنہ کرتے ہیں۔گھونٹ اسکیم اور آپ دیکھ سکتے ہیں کہ SIPs طویل مدتی کے لیے زیادہ فائدہ مند ہیں۔ چونکہ ایکویٹی سے طویل مدتی فوائد ٹیکس سے پاک ہوتے ہیں، اس لیے کوئی بھی ایس آئی پی جو سرمایہ کاری کرتا ہے۔ای ایل ایس ایس (ایکویٹی لنکڈباہمی چندہ) ایک سال کے بعد بھی ٹیکس سے پاک ہے۔
*ذیل میں پچھلے 1 سال کی کارکردگی اور فنڈ کی عمر> 1 سال کی بنیاد پر فنڈ کی فہرست ہے۔
Fund NAV Net Assets (Cr) Min SIP Investment 3 MO (%) 6 MO (%) 1 YR (%) 3 YR (%) 5 YR (%) 2024 (%) DSP World Gold Fund Growth ₹60.3973
↓ -2.23 ₹1,756 500 32.8 78.1 143 56.3 28.1 167.1 DSP World Mining Fund Growth ₹30.722
↓ -1.26 ₹154 500 31.6 62.3 85.4 21.8 18.1 79 DSP World Energy Fund Growth ₹26.6894
↓ -0.24 ₹93 500 17.2 33 53.5 15.1 12.2 39.2 Edelweiss Emerging Markets Opportunities Equity Off-shore Fund Growth ₹23.9895
↓ -0.33 ₹169 1,000 14 31.3 51.7 18.6 4.6 41.1 Kotak Global Emerging Market Fund Growth ₹34.401
↓ -0.04 ₹256 1,000 15 27.4 47.2 19.9 6.4 39.1 Note: Returns up to 1 year are on absolute basis & more than 1 year are on CAGR basis. as on 17 Feb 26 Research Highlights & Commentary of 5 Funds showcased
Commentary DSP World Gold Fund DSP World Mining Fund DSP World Energy Fund Edelweiss Emerging Markets Opportunities Equity Off-shore Fund Kotak Global Emerging Market Fund Point 1 Highest AUM (₹1,756 Cr). Bottom quartile AUM (₹154 Cr). Bottom quartile AUM (₹93 Cr). Lower mid AUM (₹169 Cr). Upper mid AUM (₹256 Cr). Point 2 Oldest track record among peers (18 yrs). Established history (16+ yrs). Established history (16+ yrs). Established history (11+ yrs). Established history (18+ yrs). Point 3 Top rated. Rating: 3★ (upper mid). Rating: 2★ (bottom quartile). Rating: 3★ (lower mid). Rating: 3★ (bottom quartile). Point 4 Risk profile: High. Risk profile: High. Risk profile: High. Risk profile: High. Risk profile: High. Point 5 5Y return: 28.10% (top quartile). 5Y return: 18.07% (upper mid). 5Y return: 12.20% (lower mid). 5Y return: 4.60% (bottom quartile). 5Y return: 6.39% (bottom quartile). Point 6 3Y return: 56.28% (top quartile). 3Y return: 21.76% (upper mid). 3Y return: 15.11% (bottom quartile). 3Y return: 18.65% (bottom quartile). 3Y return: 19.95% (lower mid). Point 7 1Y return: 143.03% (top quartile). 1Y return: 85.41% (upper mid). 1Y return: 53.52% (lower mid). 1Y return: 51.73% (bottom quartile). 1Y return: 47.19% (bottom quartile). Point 8 Alpha: 1.32 (top quartile). Alpha: 0.00 (upper mid). Alpha: 0.00 (lower mid). Alpha: -0.64 (bottom quartile). Alpha: -1.28 (bottom quartile). Point 9 Sharpe: 3.42 (top quartile). Sharpe: 3.27 (upper mid). Sharpe: 1.61 (bottom quartile). Sharpe: 2.63 (lower mid). Sharpe: 2.58 (bottom quartile). Point 10 Information ratio: -0.67 (bottom quartile). Information ratio: 0.00 (top quartile). Information ratio: 0.00 (upper mid). Information ratio: -0.95 (bottom quartile). Information ratio: -0.50 (lower mid). DSP World Gold Fund
DSP World Mining Fund
DSP World Energy Fund
Edelweiss Emerging Markets Opportunities Equity Off-shore Fund
Kotak Global Emerging Market Fund
2022 کے لیے سرفہرست فنڈز
*1 سال کی کارکردگی کی بنیاد پر بہترین فنڈز۔
"The primary investment objective of the Scheme is to seek capital appreciation by investing predominantly in units of MLIIF - WGF. The Scheme may, at the discretion of the Investment Manager, also invest in the units of other similar overseas mutual fund schemes, which may constitute a significant part of its corpus. The Scheme may also invest a certain portion of its corpus in money market securities and/or units of money market/liquid schemes of DSP Merrill Lynch Mutual Fund, in order to meet liquidity requirements from time to time. However, there is no assurance that the investment objective of the Scheme will be realized." Below is the key information for DSP World Gold Fund Returns up to 1 year are on The primary investment objective of the Scheme is to seek capital appreciation by investing predominantly in the units of BlackRock Global Funds – World Mining Fund. The Scheme may, at the discretion of the Investment Manager, also invest in the units of other similar overseas mutual fund schemes, which may
constitute a significant part of its corpus. The Scheme may also invest a certain portion of its corpus in money market securities and/or money market/liquid schemes of DSP BlackRock Mutual Fund, in order to meet liquidity requirements from time to time. Research Highlights for DSP World Mining Fund Below is the key information for DSP World Mining Fund Returns up to 1 year are on 1. DSP World Gold Fund
DSP World Gold Fund
Growth Launch Date 14 Sep 07 NAV (17 Feb 26) ₹60.3973 ↓ -2.23 (-3.56 %) Net Assets (Cr) ₹1,756 on 31 Dec 25 Category Equity - Global AMC DSP BlackRock Invmt Managers Pvt. Ltd. Rating ☆☆☆ Risk High Expense Ratio 1.41 Sharpe Ratio 3.42 Information Ratio -0.67 Alpha Ratio 1.32 Min Investment 1,000 Min SIP Investment 500 Exit Load 0-12 Months (1%),12 Months and above(NIL) Growth of 10,000 investment over the years.
Date Value 31 Jan 21 ₹10,000 31 Jan 22 ₹8,807 31 Jan 23 ₹9,422 31 Jan 24 ₹8,517 31 Jan 25 ₹12,548 31 Jan 26 ₹33,170 Returns for DSP World Gold Fund
absolute basis & more than 1 year are on CAGR (Compound Annual Growth Rate) basis. as on 17 Feb 26 Duration Returns 1 Month 2.5% 3 Month 32.8% 6 Month 78.1% 1 Year 143% 3 Year 56.3% 5 Year 28.1% 10 Year 15 Year Since launch 10.3% Historical performance (Yearly) on absolute basis
Year Returns 2024 167.1% 2023 15.9% 2022 7% 2021 -7.7% 2020 -9% 2019 31.4% 2018 35.1% 2017 -10.7% 2016 -4% 2015 52.7% Fund Manager information for DSP World Gold Fund
Name Since Tenure Jay Kothari 1 Mar 13 12.93 Yr. Data below for DSP World Gold Fund as on 31 Dec 25
Equity Sector Allocation
Sector Value Basic Materials 95.89% Asset Allocation
Asset Class Value Cash 1.55% Equity 95.89% Debt 0.01% Other 2.56% Top Securities Holdings / Portfolio
Name Holding Value Quantity BGF World Gold I2
Investment Fund | -74% ₹1,458 Cr 1,177,658
↓ -41,596 VanEck Gold Miners ETF
- | GDX25% ₹497 Cr 573,719 Treps / Reverse Repo Investments
CBLO/Reverse Repo | -2% ₹35 Cr Net Receivables/Payables
Net Current Assets | -1% -₹15 Cr 2. DSP World Mining Fund
DSP World Mining Fund
Growth Launch Date 29 Dec 09 NAV (17 Feb 26) ₹30.722 ↓ -1.26 (-3.95 %) Net Assets (Cr) ₹154 on 31 Dec 25 Category Equity - Global AMC DSP BlackRock Invmt Managers Pvt. Ltd. Rating ☆☆☆ Risk High Expense Ratio 1.14 Sharpe Ratio 3.27 Information Ratio 0 Alpha Ratio 0 Min Investment 1,000 Min SIP Investment 500 Exit Load 0-12 Months (1%),12 Months and above(NIL) Growth of 10,000 investment over the years.
Date Value 31 Jan 21 ₹10,000 31 Jan 22 ₹11,733 31 Jan 23 ₹14,422 31 Jan 24 ₹12,454 31 Jan 25 ₹12,799 31 Jan 26 ₹25,833 Returns for DSP World Mining Fund
absolute basis & more than 1 year are on CAGR (Compound Annual Growth Rate) basis. as on 17 Feb 26 Duration Returns 1 Month 2.8% 3 Month 31.6% 6 Month 62.3% 1 Year 85.4% 3 Year 21.8% 5 Year 18.1% 10 Year 15 Year Since launch 7.2% Historical performance (Yearly) on absolute basis
Year Returns 2024 79% 2023 -8.1% 2022 0% 2021 12.2% 2020 18% 2019 34.9% 2018 21.5% 2017 -9.4% 2016 21.1% 2015 49.7% Fund Manager information for DSP World Mining Fund
Name Since Tenure Jay Kothari 1 Mar 13 12.93 Yr. Data below for DSP World Mining Fund as on 31 Dec 25
Equity Sector Allocation
Sector Value Basic Materials 95.77% Energy 1.05% Asset Allocation
Asset Class Value Cash 3.15% Equity 96.82% Debt 0.02% Top Securities Holdings / Portfolio
Name Holding Value Quantity BGF World Mining I2
Investment Fund | -99% ₹180 Cr 149,227
↓ -1,163 Treps / Reverse Repo Investments
CBLO/Reverse Repo | -1% ₹2 Cr Net Receivables/Payables
Net Current Assets | -0% ₹0 Cr
یہاں فراہم کردہ معلومات کے درست ہونے کو یقینی بنانے کے لیے تمام کوششیں کی گئی ہیں۔ تاہم، ڈیٹا کی درستگی کے حوالے سے کوئی ضمانت نہیں دی جاتی ہے۔ براہ کرم کوئی بھی سرمایہ کاری کرنے سے پہلے اسکیم کی معلومات کے دستاویز کے ساتھ تصدیق کریں۔


Research Highlights for DSP World Gold Fund