Lumpsum کیلکولیٹر
Lumpsum کیلکولیٹر سرمایہ کاروں کو یہ جانچنے میں مدد کرتا ہے کہ ایک مقررہ وقت کے دوران ان کی lumsum کی سرمایہ کاری کیسے بڑھتی ہے۔ سرمایہ کاری کے یکمشت موڈ میں، لوگ اسکیم میں ایک بار نیچے ادائیگی کے طور پر کافی رقم لگاتے ہیں۔ جب بھی، ہم میوچل فنڈ انویسٹمنٹ کے بارے میں بات کرتے ہیں، تو سب سے پہلی چیز جو ہمارے ذہن میں گھومتی ہے وہ ہے، "ہمیں کتنی رقم کی سرمایہ کاری کی ضرورت ہے؟" اگرچہ متوقع منافع، خطرے کی بھوک، سرمایہ کاری کی مدت، وغیرہ سے متعلق بہت سے سوالات ہیں؛ پہلی سوچ جو ہمیشہ ہمارے کانوں میں بجتی ہے وہ سرمایہ کاری کی رقم ہے۔
تو، آئیے دیکھتے ہیں کہ کس طرح ایک بار کی سرمایہ کاری کی نمو کا اندازہ لگانے میں لمپسم کیلکولیٹر مدد کرتا ہے۔باہمی چندہ.
Lumpsum کیلکولیٹر کی مثال
درج ذیل ڈیٹا کی مدد سے اپنی یکمشت سرمایہ کاری پر منافع کا حساب لگائیں۔
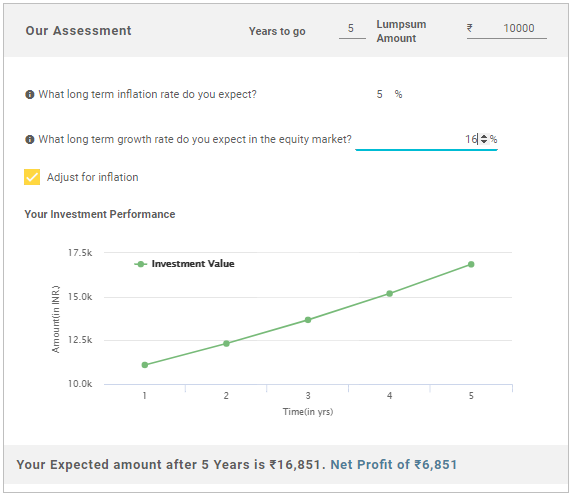
سرمایہ کاری کی مدت: 5 سال
لمپسم سرمایہ کاری کی رقم: 10 روپے،000
طویل مدتیمہنگائی (%): 5 (تقریباً)
طویل مدتی واپسی (%): 16 (تقریباً)
Lumpsum کیلکولیٹر کے مطابق متوقع واپسی: ₹6,851
5 سال کے بعد کل رقم: 16,851 روپے
Talk to our investment specialist
لمپسم انویسٹمنٹ کے لیے 2018 میں سرفہرست 10 پرفارم کرنے والے میوچل فنڈز
Fund NAV Net Assets (Cr) Min Investment 3 MO (%) 6 MO (%) 1 YR (%) 3 YR (%) 5 YR (%) 2024 (%) Sundaram Rural and Consumption Fund Growth ₹95.1263
↑ 0.10 ₹1,422 5,000 6 4.8 -2.2 10.6 11.7 -0.1 Franklin Asian Equity Fund Growth ₹44.1026
↑ 2.12 ₹979 5,000 9.3 14.1 39.7 18.4 8.1 23.7 Franklin Build India Fund Growth ₹144.394
↑ 0.99 ₹3,256 5,000 -2 1.9 1.9 18.1 19.7 3.7 DSP Natural Resources and New Energy Fund Growth ₹106.327
↑ 0.33 ₹2,401 1,000 -4.7 0.4 18.3 19.2 15 17.5 DSP Equity Opportunities Fund Growth ₹624.745
↑ 0.37 ₹17,906 1,000 3.4 -1.1 2.2 14.6 12.4 7.1 DSP US Flexible Equity Fund Growth ₹90.0193
↑ 0.77 ₹1,291 1,000 1.5 11.7 36.9 24.6 17.2 33.8 Bandhan Infrastructure Fund Growth ₹49.429
↑ 0.28 ₹1,545 5,000 1.5 7.9 -1.5 16.2 16.4 -6.9 Tata India Tax Savings Fund Growth ₹46.8846
↑ 0.31 ₹4,597 500 4.4 5.1 6.6 12.4 13 4.9 Aditya Birla Sun Life Banking And Financial Services Fund Growth ₹63.22
↑ 0.50 ₹3,676 1,000 3.6 -0.6 5 10.3 11.5 17.5 Aditya Birla Sun Life Small Cap Fund Growth ₹96.6213
↑ 0.64 ₹5,731 1,000 8.8 17.5 12.8 15.1 12.4 -3.7 Note: Returns up to 1 year are on absolute basis & more than 1 year are on CAGR basis. as on 31 Jul 26 Research Highlights & Commentary of 10 Funds showcased
Commentary Sundaram Rural and Consumption Fund Franklin Asian Equity Fund Franklin Build India Fund DSP Natural Resources and New Energy Fund DSP Equity Opportunities Fund DSP US Flexible Equity Fund Bandhan Infrastructure Fund Tata India Tax Savings Fund Aditya Birla Sun Life Banking And Financial Services Fund Aditya Birla Sun Life Small Cap Fund Point 1 Bottom quartile AUM (₹1,422 Cr). Bottom quartile AUM (₹979 Cr). Upper mid AUM (₹3,256 Cr). Lower mid AUM (₹2,401 Cr). Highest AUM (₹17,906 Cr). Bottom quartile AUM (₹1,291 Cr). Lower mid AUM (₹1,545 Cr). Upper mid AUM (₹4,597 Cr). Upper mid AUM (₹3,676 Cr). Top quartile AUM (₹5,731 Cr). Point 2 Established history (20+ yrs). Established history (18+ yrs). Established history (16+ yrs). Established history (18+ yrs). Oldest track record among peers (26 yrs). Established history (14+ yrs). Established history (15+ yrs). Established history (11+ yrs). Established history (12+ yrs). Established history (19+ yrs). Point 3 Top rated. Rating: 5★ (top quartile). Rating: 5★ (upper mid). Rating: 5★ (upper mid). Rating: 5★ (upper mid). Rating: 5★ (lower mid). Rating: 5★ (lower mid). Rating: 5★ (bottom quartile). Rating: 5★ (bottom quartile). Rating: 5★ (bottom quartile). Point 4 Risk profile: Moderately High. Risk profile: High. Risk profile: High. Risk profile: High. Risk profile: Moderately High. Risk profile: High. Risk profile: High. Risk profile: Moderately High. Risk profile: High. Risk profile: Moderately High. Point 5 5Y return: 11.75% (bottom quartile). 5Y return: 8.09% (bottom quartile). 5Y return: 19.68% (top quartile). 5Y return: 14.99% (upper mid). 5Y return: 12.42% (lower mid). 5Y return: 17.19% (top quartile). 5Y return: 16.44% (upper mid). 5Y return: 13.00% (upper mid). 5Y return: 11.51% (bottom quartile). 5Y return: 12.43% (lower mid). Point 6 3Y return: 10.63% (bottom quartile). 3Y return: 18.41% (upper mid). 3Y return: 18.05% (upper mid). 3Y return: 19.21% (top quartile). 3Y return: 14.61% (lower mid). 3Y return: 24.61% (top quartile). 3Y return: 16.23% (upper mid). 3Y return: 12.37% (bottom quartile). 3Y return: 10.29% (bottom quartile). 3Y return: 15.12% (lower mid). Point 7 1Y return: -2.17% (bottom quartile). 1Y return: 39.67% (top quartile). 1Y return: 1.90% (bottom quartile). 1Y return: 18.33% (upper mid). 1Y return: 2.24% (lower mid). 1Y return: 36.94% (top quartile). 1Y return: -1.52% (bottom quartile). 1Y return: 6.56% (upper mid). 1Y return: 4.98% (lower mid). 1Y return: 12.80% (upper mid). Point 8 Alpha: -6.29 (bottom quartile). Alpha: 0.00 (upper mid). Alpha: 0.00 (upper mid). Alpha: 0.00 (upper mid). Alpha: -2.56 (bottom quartile). Alpha: -4.10 (bottom quartile). Alpha: 0.00 (lower mid). Alpha: 4.23 (top quartile). Alpha: 3.47 (top quartile). Alpha: 0.00 (lower mid). Point 9 Sharpe: -0.67 (bottom quartile). Sharpe: 1.54 (top quartile). Sharpe: -0.04 (upper mid). Sharpe: 0.72 (upper mid). Sharpe: -0.35 (bottom quartile). Sharpe: 1.93 (top quartile). Sharpe: -0.25 (bottom quartile). Sharpe: -0.09 (lower mid). Sharpe: -0.06 (lower mid). Sharpe: 0.22 (upper mid). Point 10 Information ratio: -0.56 (bottom quartile). Information ratio: 0.00 (upper mid). Information ratio: 0.00 (lower mid). Information ratio: 0.00 (lower mid). Information ratio: 0.20 (upper mid). Information ratio: 0.15 (upper mid). Information ratio: 0.00 (bottom quartile). Information ratio: 0.22 (top quartile). Information ratio: 0.24 (top quartile). Information ratio: 0.00 (bottom quartile). Sundaram Rural and Consumption Fund
Franklin Asian Equity Fund
Franklin Build India Fund
DSP Natural Resources and New Energy Fund
DSP Equity Opportunities Fund
DSP US Flexible Equity Fund
Bandhan Infrastructure Fund
Tata India Tax Savings Fund
Aditya Birla Sun Life Banking And Financial Services Fund
Aditya Birla Sun Life Small Cap Fund
Lumpsum کیلکولیٹر کو سمجھنا
وہ افراد جو سرمایہ کاری کے لیے نئے ہیں، انہیں لمپسم کیلکولیٹر کے تصور اور اس کے کام کو سمجھنا مشکل ہوتا ہے۔ لہذا، پیچیدگیوں کو کم کرنے کے لئے، حساب کے بارے میں تفصیلی معلومات دی گئی ہیں. عمل کو سمجھنے کے لیے اس معلومات کو دیکھیں۔ ان پٹ ڈیٹا جو لمپسم کیلکولیٹر میں فیڈ کرنے کی ضرورت ہے اس میں شامل ہیں:
- یکمشت سرمایہ کاری کی مدت
- رقم کی رقم ایک لمپسم موڈ کے ذریعے لگائی جا رہی ہے۔
- ایکویٹی مارکیٹوں سے طویل مدتی منافع کی متوقع شرح
- متوقع سالانہ افراط زر کی شرح
یہ کیسے کام کرتا ہے؟
کسی بھی سرمایہ کاری کے مقصد کے لیے ہمیشہ ایک موثر منصوبہ بندی کی ضرورت ہوتی ہے۔ اگرچہ لوگ اس کی ماضی کی کارکردگی اور دیگر متعلقہ عوامل کی بنیاد پر بہترین اسکیموں کا انتخاب کرسکتے ہیں تاہم؛ یہ اس لمپسم کیلکولیٹر کی مدد سے ہے جو لوگوں کو یہ فیصلہ کرنے میں مدد کرتا ہے کہ ان کی سرمایہ کاری ایک وقت کے ساتھ عملی طور پر کیسے بڑھتی ہے۔ جیسا کہ پہلے ذکر کیا گیا ہے، اس کیلکولیٹر کے ان پٹ عناصر میں سرمایہ کاری کی مدت، سرمایہ کاری کی گئی رقم اور دیگر شامل ہیں۔ تو آئیے دیکھتے ہیں کہ ذیل میں دی گئی مثال کے ساتھ حساب کتاب کیسے کام کرتا ہے۔
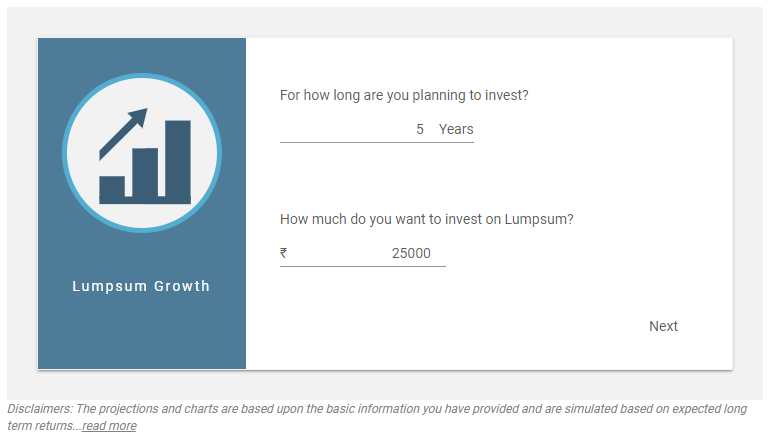
لمپسم سرمایہ کاری کی رقم: 25,000 روپے
سرمایہ کاری کی مدت: 5 سال
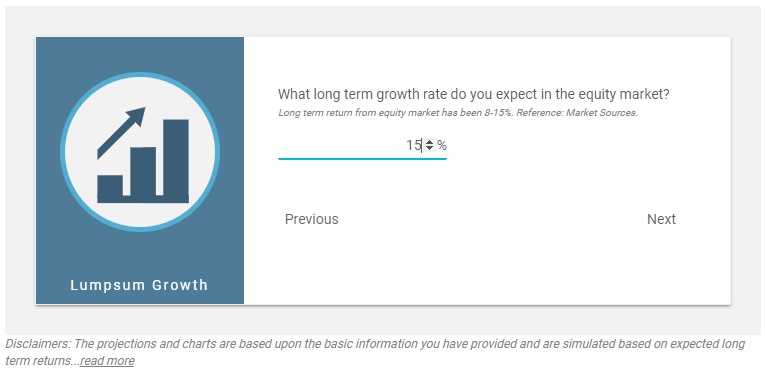
متوقع واپسی (%) (تقریبا): 15
متوقع افراط زر (%) (تقریبا): 5
1. اپنی لمپسم سرمایہ کاری کی رقم اور سرمایہ کاری کی مدت درج کریں۔
یہ پہلا سوال ہے جو آپ کو پوچھنا ہے، کہ مجھے کتنی رقم کی سرمایہ کاری کرنے کی ضرورت ہے تاکہ میں اپنے مقصد کو حاصل کر سکوں۔ اسی کے ساتھ، سرمایہ کاری کی مدت بھی بیان کریں۔ لہذا، ₹25,000 اور 5 سال کی مدت کے بارے میں ذکر کردہ رقم کی مدد سے، تصویر ذیل میں دی گئی ہے۔ یہاں، سرمایہ کاری کی رقم اور مدت داخل کرنے کے بعد، آپ کو کلک کرنے کی ضرورت ہے۔اگلا بٹن جو کہ سکرین کے نیچے ہے جیسا کہ تصویر میں دکھایا گیا ہے۔
2. اپنی سرمایہ کاری پر متوقع طویل مدتی ترقی درج کریں۔
یہ دوسرا سوال ہے جس کا آپ کو جواب دینا ہوگا۔ یہاں، آپ کو یکمشت سرمایہ کاری پر منافع کی متوقع شرح درج کرنے کی ضرورت ہے۔ مثال کے طور پر، آئیے فرض کریں کہ اس معاملے میں منافع کی شرح 15% ہے۔ اسی کے لیے تصویر ذیل میں درج ہے۔ واپسی کی متوقع شرح درج کرنے کے بعد، آپ کو کلک کرنے کی ضرورت ہے۔اگلا بٹن جو کہ ذیل میں دکھایا گیا ہے۔
3. افراط زر کے لیے ایڈجسٹ کریں۔
ایک بار جب آپ متوقع واپسی کا فیصد درج کرتے ہیں، اور اگلا پر کلک کرتے ہیں، تو آپ کو نتیجہ مل جاتا ہے۔ یہاں، آپ کو قریب کے باکس کو منتخب کرنے کی ضرورت ہے۔افراط زر کے لیے ایڈجسٹ کریں۔ اور طویل مدتی افراط زر کی شرح درج کریں۔ ہماری مثال میں، ہم نے افراط زر کی شرح کو 5% لیا ہے۔ ایک بار جب آپ افراط زر کی شرح درج کریں تو؛ آپ سرمایہ کاری کی قیمت. اس قدم کی تصویر مندرجہ ذیل ہے۔
4. اختتامی نتیجہ
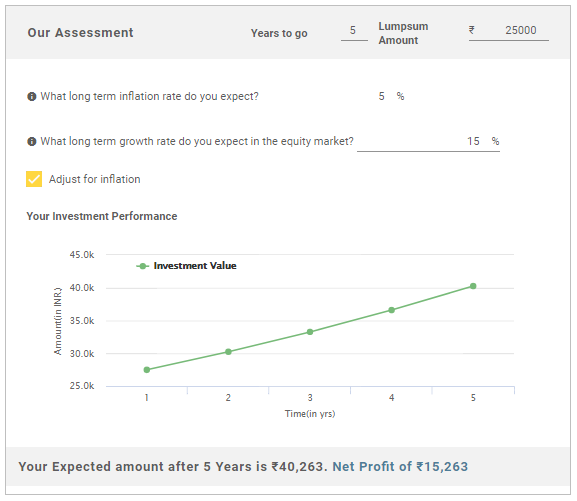
لہذا، ہم یہ نتیجہ اخذ کر سکتے ہیں کہ، پانچویں سال کے اختتام پر، سرمایہ کاری پر خالص منافع ₹15,263 ہے اور سرمایہ کاری کی کل قیمت ₹40,263 ہے۔
اس طرح، مذکورہ بالا مراحل سے، ہم دیکھ سکتے ہیں کہ Fincash Lumpsum کیلکولیٹر استعمال کرنا آسان ہے۔
مزید سوالات کی صورت میں، بلا جھجھک ہمارے کسٹمر کیئر ڈیپارٹمنٹ سے رابطہ کریں۔
2022 کے لیے سرفہرست فنڈز
*3 سال کی کارکردگی کی بنیاد پر بہترین فنڈز۔
"The primary investment objective of the Scheme is to seek capital appreciation by investing predominantly in units of MLIIF - WGF. The Scheme may, at the discretion of the Investment Manager, also invest in the units of other similar overseas mutual fund schemes, which may constitute a significant part of its corpus. The Scheme may also invest a certain portion of its corpus in money market securities and/or units of money market/liquid schemes of DSP Merrill Lynch Mutual Fund, in order to meet liquidity requirements from time to time. However, there is no assurance that the investment objective of the Scheme will be realized." Below is the key information for DSP World Gold Fund Returns up to 1 year are on The primary investment objective of the Scheme is to seek capital appreciation by investing predominantly in units of BGF – USFEF. The Scheme may, at the discretion of the Investment Manager also invest in the units of other similar overseas mutual fund schemes, which may constitute a significant part of its corpus. The Scheme may also invest a certain portion of its corpus in money market securities and/or money market/liquid schemes of DSP BlackRock Mutual Fund, in order to meet liquidity requirements from time to time. However, there is no assurance that the investment objective of the Scheme will be realized. It shall be noted ‘similar overseas mutual fund schemes’ shall have investment objective, investment strategy and risk profile/consideration similar to those of BGF – USFEF. Research Highlights for DSP US Flexible Equity Fund Below is the key information for DSP US Flexible Equity Fund Returns up to 1 year are on The investment objective of the scheme is to provide long term growth from a portfolio of equity / equity related instruments of companies engaged either directly or indirectly in the infrastructure sector. Research Highlights for LIC MF Infrastructure Fund Below is the key information for LIC MF Infrastructure Fund Returns up to 1 year are on 1. DSP World Gold Fund
DSP World Gold Fund
Growth Launch Date 14 Sep 07 NAV (30 Jul 26) ₹50.4247 ↑ 1.63 (3.33 %) Net Assets (Cr) ₹1,433 on 30 Jun 26 Category Equity - Global AMC DSP BlackRock Invmt Managers Pvt. Ltd. Rating ☆☆☆ Risk High Expense Ratio 1.41 Sharpe Ratio 1.22 Information Ratio -0.5 Alpha Ratio 2.12 Min Investment 1,000 Min SIP Investment 500 Exit Load 0-12 Months (1%),12 Months and above(NIL) Growth of 10,000 investment over the years.
Date Value 31 Jul 21 ₹10,000 31 Jul 22 ₹7,373 31 Jul 23 ₹9,366 31 Jul 24 ₹11,150 31 Jul 25 ₹16,504 31 Jul 26 ₹26,355 Returns for DSP World Gold Fund
absolute basis & more than 1 year are on CAGR (Compound Annual Growth Rate) basis. as on 30 Jul 26 Duration Returns 1 Month 2.3% 3 Month -12.7% 6 Month -17.8% 1 Year 62.8% 3 Year 43.6% 5 Year 22.1% 10 Year 15 Year Since launch 8.9% Historical performance (Yearly) on absolute basis
Year Returns 2024 167.1% 2023 15.9% 2022 7% 2021 -7.7% 2020 -9% 2019 31.4% 2018 35.1% 2017 -10.7% 2016 -4% 2015 52.7% Fund Manager information for DSP World Gold Fund
Name Since Tenure Kaivalya Nadkarni 1 May 25 1.17 Yr. Data below for DSP World Gold Fund as on 30 Jun 26
Equity Sector Allocation
Sector Value Basic Materials 94.47% Asset Allocation
Asset Class Value Cash 3.62% Equity 94.47% Debt 0% Other 1.91% Top Securities Holdings / Portfolio
Name Holding Value Quantity BGF World Gold I2
Investment Fund | -68% ₹1,141 Cr 1,005,044 VanEck Gold Miners ETF
- | GDX29% ₹490 Cr 573,719 Treps / Reverse Repo Investments
CBLO/Reverse Repo | -3% ₹54 Cr Net Receivables/Payables
Net Current Assets | -0% -₹6 Cr 2. DSP US Flexible Equity Fund
DSP US Flexible Equity Fund
Growth Launch Date 3 Aug 12 NAV (30 Jul 26) ₹90.0193 ↑ 0.77 (0.86 %) Net Assets (Cr) ₹1,291 on 30 Jun 26 Category Equity - Global AMC DSP BlackRock Invmt Managers Pvt. Ltd. Rating ☆☆☆☆☆ Risk High Expense Ratio 1.55 Sharpe Ratio 1.93 Information Ratio 0.15 Alpha Ratio -4.1 Min Investment 1,000 Min SIP Investment 500 Exit Load 0-12 Months (1%),12 Months and above(NIL) Growth of 10,000 investment over the years.
Date Value 31 Jul 21 ₹10,000 31 Jul 22 ₹10,023 31 Jul 23 ₹11,458 31 Jul 24 ₹13,332 31 Jul 25 ₹16,454 31 Jul 26 ₹22,370 Returns for DSP US Flexible Equity Fund
absolute basis & more than 1 year are on CAGR (Compound Annual Growth Rate) basis. as on 30 Jul 26 Duration Returns 1 Month -4.1% 3 Month 1.5% 6 Month 11.7% 1 Year 36.9% 3 Year 24.6% 5 Year 17.2% 10 Year 15 Year Since launch 17% Historical performance (Yearly) on absolute basis
Year Returns 2024 33.8% 2023 17.8% 2022 22% 2021 -5.9% 2020 24.2% 2019 22.6% 2018 27.5% 2017 -1.1% 2016 15.5% 2015 9.8% Fund Manager information for DSP US Flexible Equity Fund
Name Since Tenure Kaivalya Nadkarni 1 May 25 1.17 Yr. Data below for DSP US Flexible Equity Fund as on 30 Jun 26
Equity Sector Allocation
Sector Value Technology 33.05% Industrials 13.62% Financial Services 12.17% Communication Services 12.05% Consumer Cyclical 9.62% Health Care 7.65% Basic Materials 2.45% Energy 2.43% Asset Allocation
Asset Class Value Cash 6.96% Equity 93.02% Debt 0.01% Top Securities Holdings / Portfolio
Name Holding Value Quantity BGF US Flexible Equity I2
Investment Fund | -96% ₹1,265 Cr 1,784,131
↓ -32,921 Treps / Reverse Repo Investments
CBLO/Reverse Repo | -4% ₹59 Cr Net Receivables/Payables
Net Current Assets | -0% -₹2 Cr 3. LIC MF Infrastructure Fund
LIC MF Infrastructure Fund
Growth Launch Date 29 Feb 08 NAV (31 Jul 26) ₹54.5662 ↑ 0.75 (1.39 %) Net Assets (Cr) ₹1,137 on 30 Jun 26 Category Equity - Sectoral AMC LIC Mutual Fund Asset Mgmt Co Ltd Rating Risk High Expense Ratio 2.21 Sharpe Ratio 0.22 Information Ratio 0.58 Alpha Ratio 8.41 Min Investment 5,000 Min SIP Investment 1,000 Exit Load 0-1 Years (1%),1 Years and above(NIL) Growth of 10,000 investment over the years.
Date Value 31 Jul 21 ₹10,000 31 Jul 22 ₹11,519 31 Jul 23 ₹14,236 31 Jul 24 ₹26,350 31 Jul 25 ₹25,021 31 Jul 26 ₹27,470 Returns for LIC MF Infrastructure Fund
absolute basis & more than 1 year are on CAGR (Compound Annual Growth Rate) basis. as on 30 Jul 26 Duration Returns 1 Month -0.9% 3 Month 5.3% 6 Month 14.5% 1 Year 9.8% 3 Year 24.5% 5 Year 22.4% 10 Year 15 Year Since launch 9.7% Historical performance (Yearly) on absolute basis
Year Returns 2024 -3.7% 2023 47.8% 2022 44.4% 2021 7.9% 2020 46.6% 2019 -0.1% 2018 13.3% 2017 -14.6% 2016 42.2% 2015 -2.2% Fund Manager information for LIC MF Infrastructure Fund
Name Since Tenure Sumit Bhatnagar 7 Apr 26 0.23 Yr. Mahesh Bendre 1 Jul 24 2 Yr. Data below for LIC MF Infrastructure Fund as on 30 Jun 26
Equity Sector Allocation
Sector Value Industrials 37.05% Consumer Cyclical 20.88% Basic Materials 12.42% Utility 11.88% Communication Services 5.02% Financial Services 3.98% Real Estate 1.97% Health Care 1.89% Technology 1.08% Asset Allocation
Asset Class Value Cash 3.82% Equity 96.18% Top Securities Holdings / Portfolio
Name Holding Value Quantity Larsen & Toubro Ltd (Industrials)
Equity, Since 30 Apr 09 | LT4% ₹44 Cr 106,968
↓ -10,884 Garware Hi-Tech Films Ltd (Basic Materials)
Equity, Since 31 Aug 23 | 5006554% ₹40 Cr 65,325
↓ -7,684 Tata Motors Passenger Vehicles Ltd (Consumer Cyclical)
Equity, Since 28 Feb 26 | TMPV4% ₹39 Cr 982,891
↓ -332,760 Tata Motors Ltd (Consumer Cyclical)
Equity, Since 31 Oct 25 | TMCV4% ₹39 Cr 1,015,933
↑ 26,983 Tata Power Co Ltd (Utilities)
Equity, Since 29 Feb 24 | TATAPOWER3% ₹36 Cr 861,040
↑ 524,312 KSH International Ltd (Industrials)
Equity, Since 31 Dec 25 | KSHINTL3% ₹34 Cr 432,816
↑ 6,280 Siemens Energy India Ltd (Utilities)
Equity, Since 31 Aug 25 | ENRIN3% ₹34 Cr 87,106
↑ 24,800 JSW Infrastructure Ltd (Industrials)
Equity, Since 30 Apr 26 | JSWINFRA3% ₹31 Cr 1,133,858
↑ 745,681 Carraro India Ltd (Consumer Cyclical)
Equity, Since 31 Dec 24 | CARRARO3% ₹31 Cr 572,991 Bharat Dynamics Ltd Ordinary Shares (Industrials)
Equity, Since 31 Jan 26 | BDL3% ₹29 Cr 242,954
↑ 157,744
یہاں فراہم کردہ معلومات کے درست ہونے کو یقینی بنانے کے لیے تمام کوششیں کی گئی ہیں۔ تاہم، ڈیٹا کی درستگی کے حوالے سے کوئی ضمانت نہیں دی جاتی ہے۔ براہ کرم کوئی بھی سرمایہ کاری کرنے سے پہلے اسکیم کی معلومات کے دستاویز کے ساتھ تصدیق کریں۔


AMFI Registration No. 112358 | CIN: U74999MH2016PTC282153
Shepard Technologies Pvt. Ltd. (with ARN code 112358) makes no warranties or representations, express or implied, on products offered through the platform. It accepts no liability for any damages or losses, however caused, in connection with the use of, or on the reliance of its product or related services. Terms and conditions of the website are applicable.
©2026 Shepard Technologies Private Limited. All Rights Reserved
Research Highlights for DSP World Gold Fund