CAGR کیلکولیٹر
CAGR کیا ہے؟
سی اے جی آر ایک مخصوص مدت کے دوران سرمایہ کاری کی اوسط سالانہ ترقی سے مراد ہے۔ یہ فرض کیا جاتا ہے کہ سرمایہ کاری کی قدر مدت کے دوران بڑھ جاتی ہے۔ کے برعکسمطلق واپسی۔، CAGR لیتا ہے۔پیسے کی وقت کی قیمت اکاؤنٹ میں. نتیجے کے طور پر، یہ ایک سال کے دوران پیدا ہونے والی سرمایہ کاری کے حقیقی منافع کو ظاہر کرنے کے قابل ہے۔
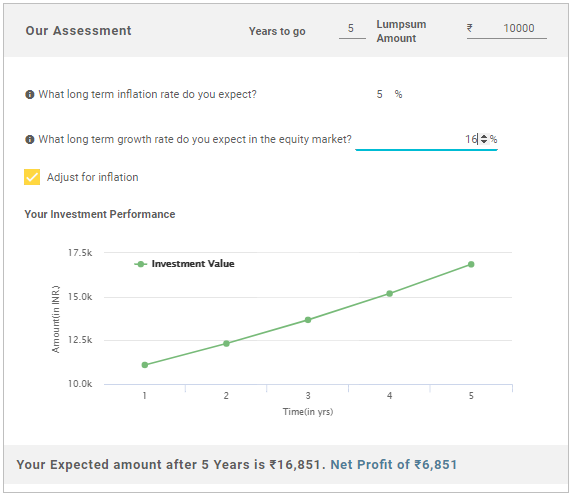
CAGR (Compound Annual Growth Rate) 20.11% CAGR Calculator
CAGR کیلکولیٹر کا استعمال کیسے کریں۔
آپ CAGR کیلکولیٹر کہاں استعمال کر سکتے ہیں CAGR آپ کے سرمایہ کاری کے فیصلوں کا تجزیہ کرنے کے لیے استعمال کرنے میں آسان ٹول ہے۔ یہ مندرجہ ذیل منظرناموں میں درخواست تلاش کرتا ہے:
- آپ نے کچھ مخصوص یونٹ خریدے ہیں۔ایکویٹی فنڈز اس سال اور آپ کے فنڈ کی قدر میں اضافہ ہوا۔ CAGR کیلکولیٹر کی مدد سے، آپ اپنی سرمایہ کاری پر منافع کی شرح کو جان سکیں گے۔
- آپ شروع کرنا چاہتے ہیں۔سرمایہ کاری اور کچھ مخصوص مقاصد ہیں. CAGR کیلکولیٹر کے ساتھ، آپ کو معلوم ہو جائے گا کہ آپ کو وقت کے اندر اپنی رقم کو کس شرح سے بڑھانا ہے۔
- غور کریں کہ آپ نے ایکویٹی فنڈ میں سرمایہ کاری کی ہے جس کے 3,5 اور 10 سالہ منافع بالترتیب 25%، 15% اور 10% ہیں۔ آپ جاننا چاہتے ہیں کہ اوسط شرح جس پر آپ کے فنڈ میں سالانہ اضافہ ہوا۔
- اپنی متوقع شرح کے ساتھ سرمایہ کاری کے CAGR کا موازنہ کرنے اور مناسب ہونے کی جانچ کریں۔ صرف اس صورت میں سرمایہ کاری کریں جب CAGR آپ کی متوقع شرح منافع سے زیادہ یا اس کے برابر ہو۔
- CAGR of aمشترکہ فنڈ ایک بینچ مارک کی واپسی کے ساتھ موازنہ کیا جا سکتا ہے
CAGR فارمولہ
CAGR کا حساب ریاضی کے فارمولے سے کیا جا سکتا ہے۔
CAGR = [ (اختتام کی قدر/ابتدائی قدر)^(1/N)] -1
مندرجہ بالا فارمولہ تین متغیرات پر منحصر ہے۔ یعنی ابتدائی قدر، اختتامی قدر اور سالوں کی تعداد (N)
جب آپ مندرجہ بالا تین متغیرات کو داخل کرتے ہیں، تو CAGR کیلکولیٹر آپ کو شرح بتائے گا۔سرمایہ کاری پر منافع.
Talk to our investment specialist
CAGR کی حدود
اگرچہ CAGR ایک مفید تصور ہے، اس کی بہت سی حدود ہیں۔ ان حدود سے آگاہی کی کمی سرمایہ کاری کے غلط فیصلوں کا باعث بنے گی۔ کچھ حدود یہ ہیں:
CAGR سے متعلق حسابات میں، یہ صرف آغاز اور اختتامی اقدار ہیں۔ یہ فرض کرتا ہے کہ ترقی وقت کی مدت کے دوران مستقل رہتی ہے اور اتار چڑھاؤ کے پہلو پر غور کرنے میں ناکام رہتی ہے۔
یہ صرف یکمشت سرمایہ کاری کے لیے موزوں ہے۔ جیسا کہ ایک کے معاملے میںSIP سرمایہ کاری، مختلف وقفوں پر منظم سرمایہ کاری پر غور نہیں کیا جائے گا کیونکہ CAGR کا حساب لگاتے وقت صرف ابتدائی قیمت پر غور کیا جاتا ہے۔
CAGR کسی سرمایہ کاری میں موروثی خطرے کا حساب نہیں رکھتا۔ جب ایکویٹی سرمایہ کاری کی بات آتی ہے تو، رسک ایڈجسٹ شدہ ریٹرن CAGR سے زیادہ اہم ہوتے ہیں۔ ان مقاصد کے لئے، آپ کو بہتر تناسب پر غور کرنے کی ضرورت ہے جیسےتیز تناسب
بہترین 3 سالہ CAGR کے ساتھ سرفہرست فنڈز
"The primary investment objective of the Scheme is to seek capital appreciation by investing predominantly in units of MLIIF - WGF. The Scheme may, at the discretion of the Investment Manager, also invest in the units of other similar overseas mutual fund schemes, which may constitute a significant part of its corpus. The Scheme may also invest a certain portion of its corpus in money market securities and/or units of money market/liquid schemes of DSP Merrill Lynch Mutual Fund, in order to meet liquidity requirements from time to time. However, there is no assurance that the investment objective of the Scheme will be realized." Below is the key information for DSP World Gold Fund Returns up to 1 year are on To generate returns that closely correspond to returns generated by Axis Gold ETF. Research Highlights for Axis Gold Fund Below is the key information for Axis Gold Fund Returns up to 1 year are on The investment objective of the Scheme is to seek to provide returns that closely correspond to returns provided by Reliance ETF Gold BeES. Research Highlights for Nippon India Gold Savings Fund Below is the key information for Nippon India Gold Savings Fund Returns up to 1 year are on 1. DSP World Gold Fund
DSP World Gold Fund
Growth Launch Date 14 Sep 07 NAV (18 Feb 26) ₹62.6234 ↑ 2.23 (3.69 %) Net Assets (Cr) ₹1,975 on 31 Jan 26 Category Equity - Global AMC DSP BlackRock Invmt Managers Pvt. Ltd. Rating ☆☆☆ Risk High Expense Ratio 1.41 Sharpe Ratio 3.41 Information Ratio -0.47 Alpha Ratio 2.12 Min Investment 1,000 Min SIP Investment 500 Exit Load 0-12 Months (1%),12 Months and above(NIL) Growth of 10,000 investment over the years.
Date Value 31 Jan 21 ₹10,000 31 Jan 22 ₹8,807 31 Jan 23 ₹9,422 31 Jan 24 ₹8,517 31 Jan 25 ₹12,548 31 Jan 26 ₹33,170 Returns for DSP World Gold Fund
absolute basis & more than 1 year are on CAGR (Compound Annual Growth Rate) basis. as on 18 Feb 26 Duration Returns 1 Month 6.2% 3 Month 39.2% 6 Month 84.2% 1 Year 156.2% 3 Year 58.2% 5 Year 29.3% 10 Year 15 Year Since launch 10.5% Historical performance (Yearly) on absolute basis
Year Returns 2024 167.1% 2023 15.9% 2022 7% 2021 -7.7% 2020 -9% 2019 31.4% 2018 35.1% 2017 -10.7% 2016 -4% 2015 52.7% Fund Manager information for DSP World Gold Fund
Name Since Tenure Jay Kothari 1 Mar 13 12.93 Yr. Data below for DSP World Gold Fund as on 31 Jan 26
Equity Sector Allocation
Sector Value Basic Materials 95.89% Asset Allocation
Asset Class Value Cash 1.55% Equity 95.89% Debt 0.01% Other 2.56% Top Securities Holdings / Portfolio
Name Holding Value Quantity BGF World Gold I2
Investment Fund | -74% ₹1,458 Cr 1,177,658
↓ -41,596 VanEck Gold Miners ETF
- | GDX25% ₹497 Cr 573,719 Treps / Reverse Repo Investments
CBLO/Reverse Repo | -2% ₹35 Cr Net Receivables/Payables
Net Current Assets | -1% -₹15 Cr 2. Axis Gold Fund
Axis Gold Fund
Growth Launch Date 20 Oct 11 NAV (19 Feb 26) ₹44.5747 ↑ 0.96 (2.21 %) Net Assets (Cr) ₹2,835 on 31 Jan 26 Category Gold - Gold AMC Axis Asset Management Company Limited Rating ☆ Risk Moderately High Expense Ratio 0.5 Sharpe Ratio 3.44 Information Ratio 0 Alpha Ratio 0 Min Investment 5,000 Min SIP Investment 1,000 Exit Load 0-1 Years (1%),1 Years and above(NIL) Growth of 10,000 investment over the years.
Date Value 31 Jan 21 ₹10,000 31 Jan 22 ₹9,659 31 Jan 23 ₹11,397 31 Jan 24 ₹12,487 31 Jan 25 ₹16,126 31 Jan 26 ₹29,924 Returns for Axis Gold Fund
absolute basis & more than 1 year are on CAGR (Compound Annual Growth Rate) basis. as on 18 Feb 26 Duration Returns 1 Month 4.7% 3 Month 24.3% 6 Month 54.2% 1 Year 73.8% 3 Year 37.9% 5 Year 25.6% 10 Year 15 Year Since launch 11% Historical performance (Yearly) on absolute basis
Year Returns 2024 69.8% 2023 19.2% 2022 14.7% 2021 12.5% 2020 -4.7% 2019 26.9% 2018 23.1% 2017 8.3% 2016 0.7% 2015 10.7% Fund Manager information for Axis Gold Fund
Name Since Tenure Aditya Pagaria 9 Nov 21 4.23 Yr. Pratik Tibrewal 1 Feb 25 1 Yr. Data below for Axis Gold Fund as on 31 Jan 26
Asset Allocation
Asset Class Value Cash 2.53% Other 97.47% Top Securities Holdings / Portfolio
Name Holding Value Quantity Axis Gold ETF
- | -99% ₹2,810 Cr 215,661,784
↑ 19,832,646 Clearing Corporation Of India Ltd
CBLO/Reverse Repo | -1% ₹35 Cr Net Receivables / (Payables)
CBLO | -0% -₹9 Cr 3. Nippon India Gold Savings Fund
Nippon India Gold Savings Fund
Growth Launch Date 7 Mar 11 NAV (19 Feb 26) ₹58.5294 ↑ 1.13 (1.96 %) Net Assets (Cr) ₹7,160 on 31 Jan 26 Category Gold - Gold AMC Nippon Life Asset Management Ltd. Rating ☆☆ Risk Moderately High Expense Ratio 0.35 Sharpe Ratio 3.01 Information Ratio 0 Alpha Ratio 0 Min Investment 5,000 Min SIP Investment 100 Exit Load 0-1 Years (2%),1 Years and above(NIL) Growth of 10,000 investment over the years.
Date Value 31 Jan 21 ₹10,000 31 Jan 22 ₹9,635 31 Jan 23 ₹11,321 31 Jan 24 ₹12,369 31 Jan 25 ₹15,957 31 Jan 26 ₹31,222 Returns for Nippon India Gold Savings Fund
absolute basis & more than 1 year are on CAGR (Compound Annual Growth Rate) basis. as on 18 Feb 26 Duration Returns 1 Month 4.9% 3 Month 24.2% 6 Month 54% 1 Year 74% 3 Year 37.9% 5 Year 25.5% 10 Year 15 Year Since launch 12.5% Historical performance (Yearly) on absolute basis
Year Returns 2024 71.2% 2023 19% 2022 14.3% 2021 12.3% 2020 -5.5% 2019 26.6% 2018 22.5% 2017 6% 2016 1.7% 2015 11.6% Fund Manager information for Nippon India Gold Savings Fund
Name Since Tenure Himanshu Mange 23 Dec 23 2.11 Yr. Data below for Nippon India Gold Savings Fund as on 31 Jan 26
Asset Allocation
Asset Class Value Cash 1.5% Other 98.5% Top Securities Holdings / Portfolio
Name Holding Value Quantity Nippon India ETF Gold BeES
- | -100% ₹7,154 Cr 527,059,679
↑ 44,753,946 Triparty Repo
CBLO/Reverse Repo | -1% ₹36 Cr Net Current Assets
Net Current Assets | -0% -₹29 Cr Cash Margin - Ccil
CBLO/Reverse Repo | -0% ₹0 Cr Cash
Net Current Assets | -0% ₹0 Cr 00
یہاں فراہم کردہ معلومات کے درست ہونے کو یقینی بنانے کے لیے تمام کوششیں کی گئی ہیں۔ تاہم، ڈیٹا کی درستگی کے حوالے سے کوئی ضمانت نہیں دی جاتی ہے۔ براہ کرم کوئی بھی سرمایہ کاری کرنے سے پہلے اسکیم کی معلومات کے دستاویز کے ساتھ تصدیق کریں۔


Research Highlights for DSP World Gold Fund