ای گولڈ بمقابلہ گولڈ ای ٹی ایف- کون سا بہتر آپشن ہے؟
ای گولڈ بمقابلہ گولڈ ای ٹی ایف؟ جو کہ بہتر ہے۔سونے کی سرمایہ کاری آپشن؟ کس ایونیو میں زیادہ پیداوار ہے؟ یہ کچھ عام سوالات ہیں جو اکثر پوچھے جاتے ہیں۔سرمایہ کار سونے کی ان غیر طبعی شکل میں سرمایہ کاری کرنا چاہتے ہیں۔ ٹھیک ہے، دونوں فارم ٹریڈنگ میں منفرد ہیں جن میں سے ہر ایک کے اپنے فوائد ہیں جیسے کہ ریٹرن، ٹیکسیشن، ہولڈنگ پیریڈ وغیرہ۔ لہذا، ہم دیکھیں گے کہ گولڈ ای ٹی ایف اور ای گولڈ دونوں ایک دوسرے سے کیسے مختلف ہیں اور کون سی شکل بناتی ہے۔ سونے کی سرمایہ کاری کا ایک بہتر آپشن!
ای گولڈ
E-Gold ایک منفرد سونے کی سرمایہ کاری کی مصنوعات ہے جسے نیشنل اسپاٹ ایکسچینج لمیٹڈ (NSEL) نے شروع کیا ہے۔ یہ پروڈکٹ سرمایہ کاروں کو قابل بناتا ہے۔سونا خریدیں۔ این ایس ای کے تجارتی پلیٹ فارم پر الیکٹرانک شکل میں اور آپ کی طرف سے خریدا گیا سونا آپ کے اندر ظاہر ہوگا۔ڈیمیٹ اکاؤنٹ.
ای-گولڈ ایک ایسی سرمایہ کاری ہے جو سرمایہ کاروں کو ایک چھوٹی قیمت میں سونا خریدنے کی اجازت دیتی ہے، جیسے کہ 1gm، 2gm، 3gm وغیرہ۔ سونے کی جو اکائیاں آپ یہاں خریدیں گے وہ T+2 دنوں میں آپ کے ڈیمٹ اکاؤنٹ میں جمع کر دی جائیں گی۔ اسی طرح، مثال کے طور پر، اگر آپ نے آج فروخت کیا ہے، تو وہی آپ کے ڈیمیٹ اکاؤنٹ سے 2 دن میں ڈیبٹ ہو جائے گا (فروخت کی تاریخ سے)۔
گولڈ ETFs کے مقابلے ای-گولڈ کم مہنگا ہے کیونکہ بعد میں مختلف چارجز جیسے کہ اثاثہ جات کے انتظام کی فیس، سیکیورٹی سروس فیس وغیرہ کا سامنا کرنا پڑتا ہے۔نہیں ہیں اس فنڈ کی لیکن ای گولڈ کے معاملے میں، قیمت سونے کی موجودہ قیمت کے برابر ہے۔
گولڈ ای ٹی ایف
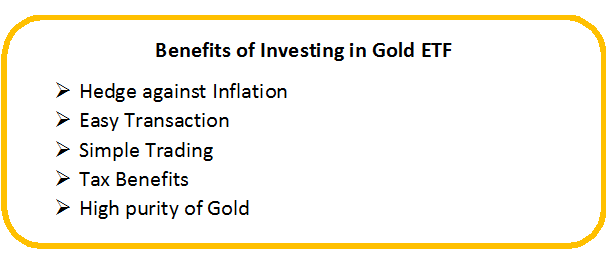
گولڈ ای ٹی ایف سونے کی سرمایہ کاری کے مقبول ترین طریقوں میں سے ایک بن گیا ہے۔ گولڈ ای ٹی ایف بھی ہیں۔زیرِ نظر اوپن اینڈ گولڈ کاباہمی چندہ جو آپ کو سونے میں اپنا پیسہ لگانے میں مدد کرتا ہے۔ بنیادی سونے کی پاکیزگی 99.5% ہے۔ گولڈ ای ٹی ایف کو پیپر گولڈ بھی کہا جاتا ہے۔ یہ بڑے اسٹاک ایکسچینج میں درج اور تجارت کی جاتی ہیں اور سرمایہ کاروں کو یونٹ تفویض کیے جاتے ہیں جہاں ہر یونٹ عام طور پر ایک گرام سونے کی نمائندگی کرتا ہے۔
گولڈ ای ٹی ایف میں، سرمایہ کار اپنے موجودہ ڈیمیٹ اکاؤنٹ میں تجارت کر سکتے ہیں۔ گولڈ ای ٹی ایف سرمایہ کاروں کو سونے تک رسائی کا ایک محفوظ طریقہ پیش کرتا ہے۔مارکیٹ. کا فائدہ بھی فراہم کرتے ہیں۔لیکویڈیٹی کیونکہ تجارتی مدت کے دوران کسی بھی وقت اس کی تجارت کی جا سکتی ہے۔
Talk to our investment specialist
ای گولڈ بمقابلہ گولڈ ای ٹی ایف: اہم فرق جانیں۔
ٹریڈنگ کا وقت
گولڈ ای ٹی ایف کی تجارت ہفتے کے دنوں میں صرف صبح 9:00 بجے سے دوپہر 3:30 بجے کے درمیان کی جا سکتی ہے۔ جبکہ ای گولڈ کی تجارت ہفتے کے دن صبح 10:00 بجے سے رات 11:30 بجے تک کی جاسکتی ہے۔
جسمانی شکل میں تبدیلی
دونوں شکلوں کو جسمانی سونے میں تبدیل کیا جا سکتا ہے، لیکن ہر ایک کے لیے کم از کم مقدار مختلف ہوتی ہے۔ ای گولڈ کی کم از کم مقدار 8 گرام ہے، جبکہ سونے میں-ای ٹی ایف، کوئی صرف تب بدل سکتا ہے جب یہ 500 گرام سے 1 کلو گرام کے ایک مخصوص سائز سے زیادہ ہو۔
ای گولڈ سب سے زیادہ قیمت ہے۔
موثر شکل اور سونے کی قیمتوں کو سونے کے ETFs کے مقابلے میں زیادہ قریب سے ٹریس کرنے کے قابل ہے۔ تاہم، جب ٹیکس لگانے کی بات آتی ہے تو ای گولڈ گولڈ ای ٹی ایف سے محروم ہوجاتا ہے۔
لیکن، اب، جب آپ کو ان دو شکلوں کے درمیان اہم فرق معلوم ہو گیا ہے، تو ایک ایسے ایوینیو میں سرمایہ کاری کریں جو بہتر منافع کے ساتھ محفوظ سرمایہ کاری کی پیشکش کرے!
| پیرامیٹرز | گولڈ ای ٹی ایف | ای گولڈ |
|---|---|---|
| علیحدہ ڈیمیٹ اکاؤنٹ | نہیں | جی ہاں |
| ہولڈنگز | کی ملکیتAMCs | جی ہاں |
| جسمانی سونے میں تبدیلی | کم از کم 0.5-1 کلوگرام | سرمایہ کار براہ راست سونے کے یونٹ ڈیمیٹ اکاؤنٹ میں رکھتے ہیں۔ |
| قلیل مدتسرمایہ فوائد | 1 سال سے کم - ریٹرن پر 20% ٹیکس | 3 سال سے کم - ریٹرن پر 20% ٹیکس |
| طویل مدتیکیپٹل گینز | 1 سال کے بعد- 10% ٹیکس ریٹرن | 3 سال کے بعد - ریٹرن پر 10% ٹیکس |
| بار بار چلنے والے اخراجات | 0.40% | 1% |
| واپسی | اس کی سب سے زیادہ قیمت سب سے زیادہ مؤثر ہے۔ | سے تھوڑا کمگولڈ ETF |
| قیمتوں کا تعین | بین الاقوامی سونے کی قیمت سے منسلک | ہندوستانی سونے کی قیمت سے منسلک |
| زیورات میں تبدیل کریں۔ | دستیاب نہیں ہے | منتخب جیولرز کے ساتھ دستیاب ہے۔ |
2022 میں سرمایہ کاری کے لیے بہترین گولڈ ای ٹی ایف
سرمایہ کاری کے لیے کچھ بہترین بنیادی گولڈ ای ٹی ایف درج ذیل ہیں:
An Open ended Fund of Funds Scheme with the investment objective to provide returns that tracks returns provided by Birla Sun Life Gold ETF (BSL Gold ETF). Below is the key information for Aditya Birla Sun Life Gold Fund Returns up to 1 year are on ICICI Prudential Regular Gold Savings Fund (the Scheme) is a fund of funds scheme with the primary objective to generate returns by investing in units of ICICI Prudential Gold Exchange Traded Fund (IPru Gold ETF).
However, there can be no assurance that the investment objectives of the Scheme will be realized. Research Highlights for ICICI Prudential Regular Gold Savings Fund Below is the key information for ICICI Prudential Regular Gold Savings Fund Returns up to 1 year are on The scheme seeks to provide returns that closely correspond to returns provided by SBI - ETF Gold (Previously known as SBI GETS). Research Highlights for SBI Gold Fund Below is the key information for SBI Gold Fund Returns up to 1 year are on The investment objective of the Scheme is to seek to provide returns that closely correspond to returns provided by Reliance ETF Gold BeES. Research Highlights for Nippon India Gold Savings Fund Below is the key information for Nippon India Gold Savings Fund Returns up to 1 year are on The investment objective of the scheme is to generate returns by investing in units of Kotak Gold Exchange Traded Fund. Research Highlights for Kotak Gold Fund Below is the key information for Kotak Gold Fund Returns up to 1 year are on 1. Aditya Birla Sun Life Gold Fund
Aditya Birla Sun Life Gold Fund
Growth Launch Date 20 Mar 12 NAV (18 Feb 26) ₹43.5454 ↓ -0.16 (-0.37 %) Net Assets (Cr) ₹1,266 on 31 Dec 25 Category Gold - Gold AMC Birla Sun Life Asset Management Co Ltd Rating ☆☆☆ Risk Moderately High Expense Ratio 0.51 Sharpe Ratio 4.49 Information Ratio 0 Alpha Ratio 0 Min Investment 100 Min SIP Investment 100 Exit Load 0-365 Days (1%),365 Days and above(NIL) Growth of 10,000 investment over the years.
Date Value 31 Jan 21 ₹10,000 31 Jan 22 ₹9,602 31 Jan 23 ₹11,314 31 Jan 24 ₹12,322 31 Jan 25 ₹15,883 31 Jan 26 ₹31,280 Returns for Aditya Birla Sun Life Gold Fund
absolute basis & more than 1 year are on CAGR (Compound Annual Growth Rate) basis. as on 18 Feb 26 Duration Returns 1 Month 5.6% 3 Month 23.6% 6 Month 50% 1 Year 72.9% 3 Year 37% 5 Year 24.7% 10 Year 15 Year Since launch 11.2% Historical performance (Yearly) on absolute basis
Year Returns 2024 72% 2023 18.7% 2022 14.5% 2021 12.3% 2020 -5% 2019 26% 2018 21.3% 2017 6.8% 2016 1.6% 2015 11.5% Fund Manager information for Aditya Birla Sun Life Gold Fund
Name Since Tenure Priya Sridhar 31 Dec 24 1.09 Yr. Data below for Aditya Birla Sun Life Gold Fund as on 31 Dec 25
Asset Allocation
Asset Class Value Cash 2.07% Other 97.93% Top Securities Holdings / Portfolio
Name Holding Value Quantity Aditya BSL Gold ETF
- | -99% ₹1,770 Cr 122,558,766
↑ 14,664,583 Clearing Corporation Of India Limited
CBLO/Reverse Repo | -3% ₹45 Cr Net Receivables / (Payables)
Net Current Assets | -2% -₹34 Cr 2. ICICI Prudential Regular Gold Savings Fund
ICICI Prudential Regular Gold Savings Fund
Growth Launch Date 11 Oct 11 NAV (18 Feb 26) ₹46.4349 ↑ 0.04 (0.08 %) Net Assets (Cr) ₹4,482 on 31 Dec 25 Category Gold - Gold AMC ICICI Prudential Asset Management Company Limited Rating ☆ Risk Moderately High Expense Ratio 0.38 Sharpe Ratio 4.33 Information Ratio 0 Alpha Ratio 0 Min Investment 5,000 Min SIP Investment 100 Exit Load 0-15 Months (2%),15 Months and above(NIL) Growth of 10,000 investment over the years.
Date Value 31 Jan 21 ₹10,000 31 Jan 22 ₹9,678 31 Jan 23 ₹11,361 31 Jan 24 ₹12,399 31 Jan 25 ₹16,060 31 Jan 26 ₹31,216 Returns for ICICI Prudential Regular Gold Savings Fund
absolute basis & more than 1 year are on CAGR (Compound Annual Growth Rate) basis. as on 18 Feb 26 Duration Returns 1 Month 5.7% 3 Month 23.6% 6 Month 50.1% 1 Year 72.9% 3 Year 37% 5 Year 24.8% 10 Year 15 Year Since launch 11.3% Historical performance (Yearly) on absolute basis
Year Returns 2024 72% 2023 19.5% 2022 13.5% 2021 12.7% 2020 -5.4% 2019 26.6% 2018 22.7% 2017 7.4% 2016 0.8% 2015 8.9% Fund Manager information for ICICI Prudential Regular Gold Savings Fund
Name Since Tenure Manish Banthia 27 Sep 12 13.36 Yr. Nishit Patel 29 Dec 20 5.1 Yr. Ashwini Bharucha 1 Nov 25 0.25 Yr. Venus Ahuja 1 Nov 25 0.25 Yr. Data below for ICICI Prudential Regular Gold Savings Fund as on 31 Dec 25
Asset Allocation
Asset Class Value Cash 2.73% Other 97.27% Top Securities Holdings / Portfolio
Name Holding Value Quantity ICICI Pru Gold ETF
- | -99% ₹6,265 Cr 448,751,665
↑ 56,893,421 Treps
CBLO/Reverse Repo | -3% ₹174 Cr Net Current Assets
Net Current Assets | -2% -₹101 Cr 3. SBI Gold Fund
SBI Gold Fund
Growth Launch Date 12 Sep 11 NAV (18 Feb 26) ₹43.8818 ↓ -0.02 (-0.04 %) Net Assets (Cr) ₹10,775 on 31 Dec 25 Category Gold - Gold AMC SBI Funds Management Private Limited Rating ☆☆ Risk Moderately High Expense Ratio 0.3 Sharpe Ratio 4.38 Information Ratio 0 Alpha Ratio 0 Min Investment 5,000 Min SIP Investment 500 Exit Load 0-1 Years (1%),1 Years and above(NIL) Growth of 10,000 investment over the years.
Date Value 31 Jan 21 ₹10,000 31 Jan 22 ₹9,629 31 Jan 23 ₹11,359 31 Jan 24 ₹12,462 31 Jan 25 ₹16,115 31 Jan 26 ₹30,818 Returns for SBI Gold Fund
absolute basis & more than 1 year are on CAGR (Compound Annual Growth Rate) basis. as on 18 Feb 26 Duration Returns 1 Month 5.7% 3 Month 23.5% 6 Month 50.1% 1 Year 72.6% 3 Year 37.3% 5 Year 24.9% 10 Year 15 Year Since launch 10.8% Historical performance (Yearly) on absolute basis
Year Returns 2024 71.5% 2023 19.6% 2022 14.1% 2021 12.6% 2020 -5.7% 2019 27.4% 2018 22.8% 2017 6.4% 2016 3.5% 2015 10% Fund Manager information for SBI Gold Fund
Name Since Tenure Raviprakash Sharma 12 Sep 11 14.4 Yr. Data below for SBI Gold Fund as on 31 Dec 25
Asset Allocation
Asset Class Value Cash 1.93% Other 98.07% Top Securities Holdings / Portfolio
Name Holding Value Quantity SBI Gold ETF
- | -100% ₹14,966 Cr 1,097,211,666
↑ 145,868,881 Treps
CBLO/Reverse Repo | -2% ₹306 Cr Net Receivable / Payable
CBLO | -2% -₹248 Cr 4. Nippon India Gold Savings Fund
Nippon India Gold Savings Fund
Growth Launch Date 7 Mar 11 NAV (18 Feb 26) ₹57.4018 ↑ 0.03 (0.05 %) Net Assets (Cr) ₹5,301 on 31 Dec 25 Category Gold - Gold AMC Nippon Life Asset Management Ltd. Rating ☆☆ Risk Moderately High Expense Ratio 0.35 Sharpe Ratio 4.46 Information Ratio 0 Alpha Ratio 0 Min Investment 5,000 Min SIP Investment 100 Exit Load 0-1 Years (2%),1 Years and above(NIL) Growth of 10,000 investment over the years.
Date Value 31 Jan 21 ₹10,000 31 Jan 22 ₹9,635 31 Jan 23 ₹11,321 31 Jan 24 ₹12,369 31 Jan 25 ₹15,957 31 Jan 26 ₹31,222 Returns for Nippon India Gold Savings Fund
absolute basis & more than 1 year are on CAGR (Compound Annual Growth Rate) basis. as on 18 Feb 26 Duration Returns 1 Month 5.8% 3 Month 23.4% 6 Month 50.3% 1 Year 72.5% 3 Year 37% 5 Year 24.8% 10 Year 15 Year Since launch 12.4% Historical performance (Yearly) on absolute basis
Year Returns 2024 71.2% 2023 19% 2022 14.3% 2021 12.3% 2020 -5.5% 2019 26.6% 2018 22.5% 2017 6% 2016 1.7% 2015 11.6% Fund Manager information for Nippon India Gold Savings Fund
Name Since Tenure Himanshu Mange 23 Dec 23 2.11 Yr. Data below for Nippon India Gold Savings Fund as on 31 Dec 25
Asset Allocation
Asset Class Value Cash 1.5% Other 98.5% Top Securities Holdings / Portfolio
Name Holding Value Quantity Nippon India ETF Gold BeES
- | -100% ₹7,154 Cr 527,059,679
↑ 44,753,946 Triparty Repo
CBLO/Reverse Repo | -1% ₹36 Cr Net Current Assets
Net Current Assets | -0% -₹29 Cr Cash Margin - Ccil
CBLO/Reverse Repo | -0% ₹0 Cr Cash
Net Current Assets | -0% ₹0 Cr 00 5. Kotak Gold Fund
Kotak Gold Fund
Growth Launch Date 25 Mar 11 NAV (18 Feb 26) ₹57.5909 ↓ -0.07 (-0.13 %) Net Assets (Cr) ₹5,213 on 31 Dec 25 Category Gold - Gold AMC Kotak Mahindra Asset Management Co Ltd Rating ☆ Risk Moderately High Expense Ratio 0.5 Sharpe Ratio 4.63 Information Ratio 0 Alpha Ratio 0 Min Investment 5,000 Min SIP Investment 1,000 Exit Load 0-6 Months (2%),6-12 Months (1%),12 Months and above(NIL) Growth of 10,000 investment over the years.
Date Value 31 Jan 21 ₹10,000 31 Jan 22 ₹9,630 31 Jan 23 ₹11,266 31 Jan 24 ₹12,247 31 Jan 25 ₹15,860 31 Jan 26 ₹29,505 Returns for Kotak Gold Fund
absolute basis & more than 1 year are on CAGR (Compound Annual Growth Rate) basis. as on 18 Feb 26 Duration Returns 1 Month 6% 3 Month 23.5% 6 Month 50% 1 Year 72.2% 3 Year 36.8% 5 Year 24.6% 10 Year 15 Year Since launch 12.5% Historical performance (Yearly) on absolute basis
Year Returns 2024 70.4% 2023 18.9% 2022 13.9% 2021 11.7% 2020 -4.7% 2019 26.6% 2018 24.1% 2017 7.3% 2016 2.5% 2015 10.2% Fund Manager information for Kotak Gold Fund
Name Since Tenure Abhishek Bisen 25 Mar 11 14.87 Yr. Jeetu Sonar 1 Oct 22 3.34 Yr. Data below for Kotak Gold Fund as on 31 Dec 25
Asset Allocation
Asset Class Value Cash 1.63% Other 98.37% Top Securities Holdings / Portfolio
Name Holding Value Quantity Kotak Gold ETF
- | -100% ₹6,544 Cr 502,813,962
↑ 31,071,029 Triparty Repo
CBLO/Reverse Repo | -1% ₹59 Cr Net Current Assets/(Liabilities)
Net Current Assets | -1% -₹47 Cr
گولڈ میوچل فنڈز میں آن لائن سرمایہ کاری کیسے کی جائے؟
Fincash.com پر لائف ٹائم کے لیے مفت انویسٹمنٹ اکاؤنٹ کھولیں۔
اپنی رجسٹریشن اور KYC کا عمل مکمل کریں۔
دستاویزات اپ لوڈ کریں (PAN، آدھار، وغیرہ)۔اور، آپ سرمایہ کاری کے لیے تیار ہیں!
یہاں فراہم کردہ معلومات کے درست ہونے کو یقینی بنانے کے لیے تمام کوششیں کی گئی ہیں۔ تاہم، ڈیٹا کی درستگی کے حوالے سے کوئی ضمانت نہیں دی جاتی ہے۔ براہ کرم کوئی بھی سرمایہ کاری کرنے سے پہلے اسکیم کی معلومات کے دستاویز کے ساتھ تصدیق کریں۔





Research Highlights for Aditya Birla Sun Life Gold Fund