یس بینک میں ایس آئی پی لین دین کے لیے بلر کو کیسے شامل کیا جائے؟
گھونٹ یا منظمسرمایہ کاری کا منصوبہ میں سرمایہ کاری کا موڈ ہے۔باہمی چندہ جہاں لوگ باقاعدہ وقفوں سے تھوڑی بہت سرمایہ کاری کرتے ہیں۔ لوگ مختلف مقاصد کے لیے منصوبہ بندی کر سکتے ہیں جیسے کہ اعلیٰ تعلیم، مکان خریدنا، گاڑی خریدنا وغیرہ۔ جب بات SIP ادائیگیوں کی ہو، ٹیکنالوجی میں ترقی کے ساتھ لوگ نیٹ بینکنگ کے ذریعے آسانی سے اپنی سرمایہ کاری کر سکتے ہیں۔ نیٹ بینکنگ کے معاملے میں، افراد کو صرف منفرد رجسٹریشن نمبر یا URN شامل کرنے کی ضرورت ہے جو انہیں ابتدائی لین دین کرنے کے بعد موصول ہوتا ہے۔ ایک بار جب لین دین ہو جائے۔
یہ URN نمبر بلر کو شامل کرکے نیٹ بینکنگ اکاؤنٹ میں شامل کیا جانا ہے تاکہ SIP ادائیگی کا عمل خودکار ہوجائے۔ یہ SIP ادائیگی کے عمل کو بھی پریشانی سے پاک بناتا ہے۔ تاہم، بلر کو شامل کرنے کا عمل ہر ایک کے معاملے میں مختلف ہے۔بینک. لہذا، آئیے وہ اقدامات دیکھیں جو یس بینک کے معاملے میں ایس آئی پی لین دین کے لیے بلر کو شامل کرنے کا طریقہ بیان کرتے ہیں۔
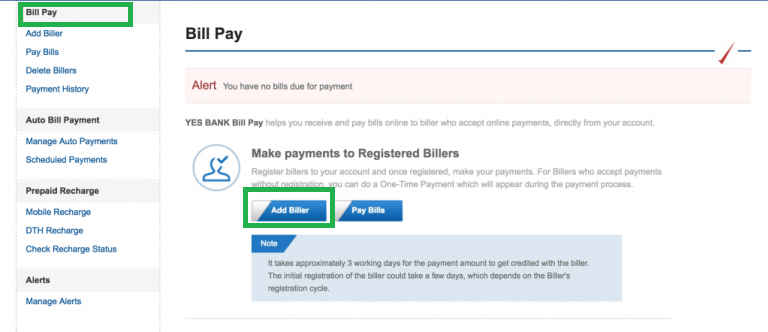
لاگ ان کریں، بل پے پر کلک کریں اور ایڈ بلر کو منتخب کریں۔
پہلا قدم ہمیشہ بینک کی ویب سائٹ پر لاگ ان کرنے سے شروع ہوتا ہے۔ یہاں، آپ اپنی درست اسناد کے ساتھ لاگ ان ہوں گے۔ ایک بار جب آپ لاگ ان ہو جاتے ہیں اور اپنے ہوم پیج پر پہنچ جاتے ہیں، تو چیک کریں۔بل کی ادائیگی آپ کی سکرین کے بائیں جانب آپشن۔ اگر آپ اس پر کلک کرتے ہیں، تو آپ اسکرین ڈسپلے کو بطور اور ادائیگی بل دیکھ سکتے ہیں۔ یہاں آپ کو منتخب کرنے کی ضرورت ہے۔بلر شامل کریں۔ اختیار اس قدم کی تصویر ذیل میں دی گئی ہے جہاں بل پے اوربلر شامل کریں۔ اختیارات کو سبز رنگ میں نمایاں کیا گیا ہے۔
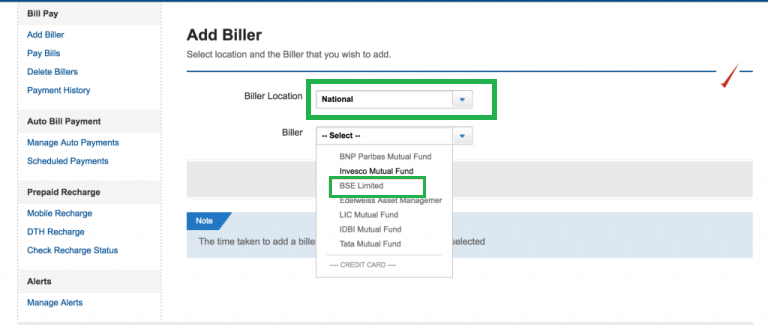
نیشنل اور بی ایس ای لمیٹڈ کو منتخب کریں۔
ایک بار جب آپ کلک کریں۔بلر شامل کریں۔ آپشن، ایک نئی اسکرین کھلتی ہے جس میں دو عناصر بلر لوکیشن اور بلر ہوتے ہیں۔ بلر لوکیشن کے آگے ڈراپ ڈاؤن میں آپ کو منتخب کرنے کی ضرورت ہے۔قومی آپشن اور بلر کے آگے ڈراپ ڈاؤن میں آپ کو منتخب کرنے کی ضرورت ہے۔بی ایس ای لمیٹڈ اختیار اس مرحلے کی تصویر نیچے ہے جہاں بلر لوکیشن اور بلر کے لیے دونوں ڈراپ ڈاؤن سبز رنگ میں نمایاں ہیں۔
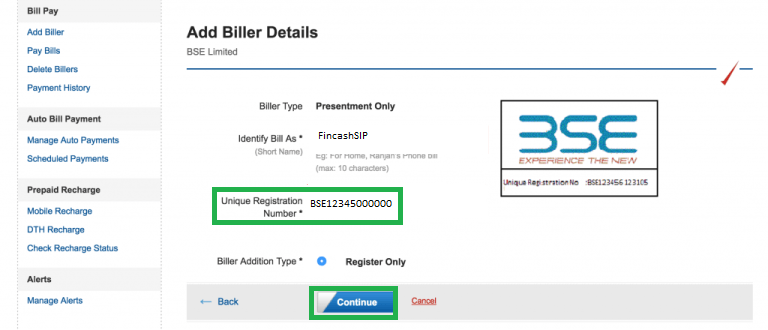
URN شامل کریں اور دیگر اجزاء کو بھریں۔
یہ یس بینک میں ایس آئی پی ٹرانزیکشن کے لیے بلر کے اضافے کے عمل میں ایک اہم قدم ہے۔ یہاں، افراد کو داخل ہونے کی ضرورت ہے۔یو آر این جو انہیں آپ کے ای میل میں موصول ہوا ہے۔ اگر آپ کو URN موصول نہیں ہوتا ہے تو، آپ اسے کی ویب سائٹ سے حاصل کر سکتے ہیں۔www.fincash.com کا دورہ کرکےمیرا SIPs سیکشن. افراد کو یہ یقینی بنانا چاہیے کہ وہ درست URN نمبر درج کریں۔ اس کے علاوہ، انہیں صفحہ پر دیے گئے دیگر اجزاء کو بھی داخل کرنے کی ضرورت ہے۔ ایک بار جب وہ تمام اجزاء کو بھرتے ہیں، تو انہیں کلک کرنے کی ضرورت ہےجاری رہے. اس قدم کی تصویر نیچے دی گئی ہے جہاں URN اور Continue کے اختیارات کو سبز رنگ میں نمایاں کیا گیا ہے۔
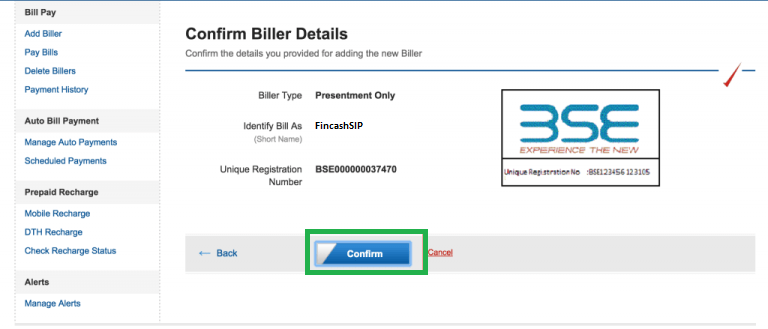
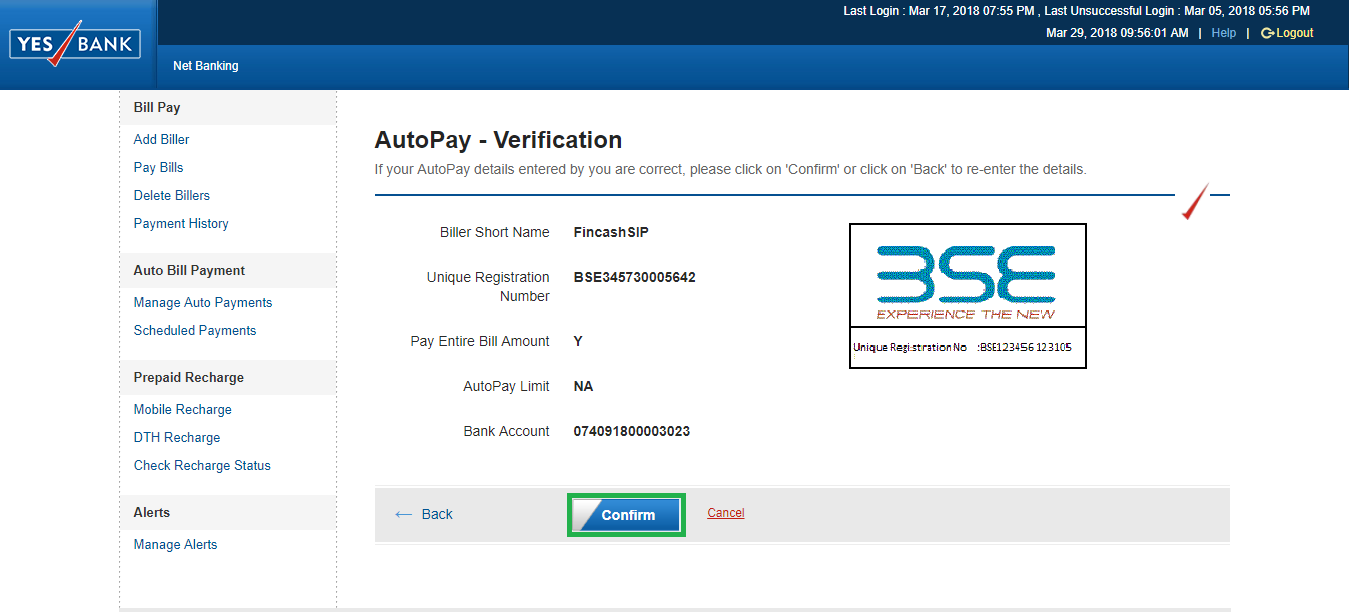
یو آر این کی تصدیق
ایک بار جب آپ کلک کریں۔جاری رہے، ایک نئی اسکرین پاپ اپ ہوتی ہے جو آپ کی بھری ہوئی معلومات کو ظاہر کرتی ہے۔ آپ یہاں اپنی معلومات کی تصدیق کر سکتے ہیں اور کسی بھی تبدیلی کی صورت میں، پچھلی اسکرین پر واپس جائیں۔ اگر درج کیا گیا تمام ڈیٹا درست ہے؛ آپ پر کلک کر سکتے ہیںتصدیق کریں۔. نیچے دی گئی تصویر اس قدم کی نمائندگی کرتی ہے جہاںتصدیق کریں۔ بٹن کو سبز رنگ میں نمایاں کیا گیا ہے۔
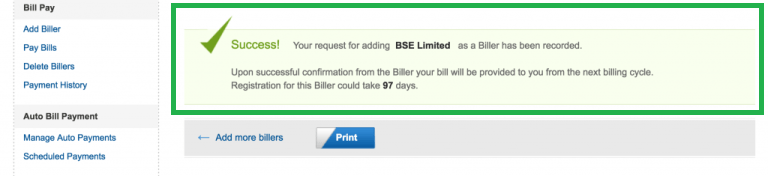
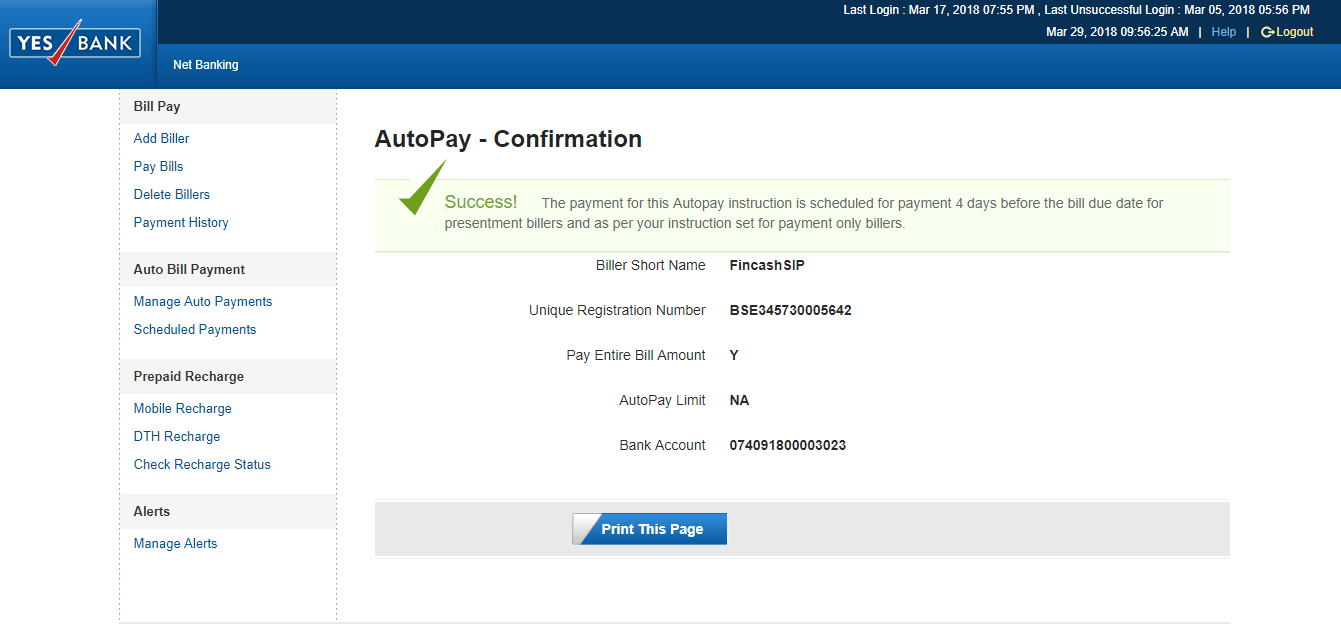
تصدیق کی کامیابی
یہ یس بینک کے بلر کے اضافے کے عمل کا آخری مرحلہ ہے۔ ایک بار جب آپ کلک کریں۔تصدیق کریں۔ آپ کو ایک اسکرین ملتی ہے جس میں کہا جاتا ہے کہ بلر کو شامل کرنے کا عمل کامیاب ہو گیا ہے اور آپ کا بلر شامل کر دیا گیا ہے۔ اس قدم کے لیے تصویر ذیل میں دی گئی ہے جہاں پرکامیابی کا پیغام سبز رنگ میں نمایاں کیا گیا ہے۔
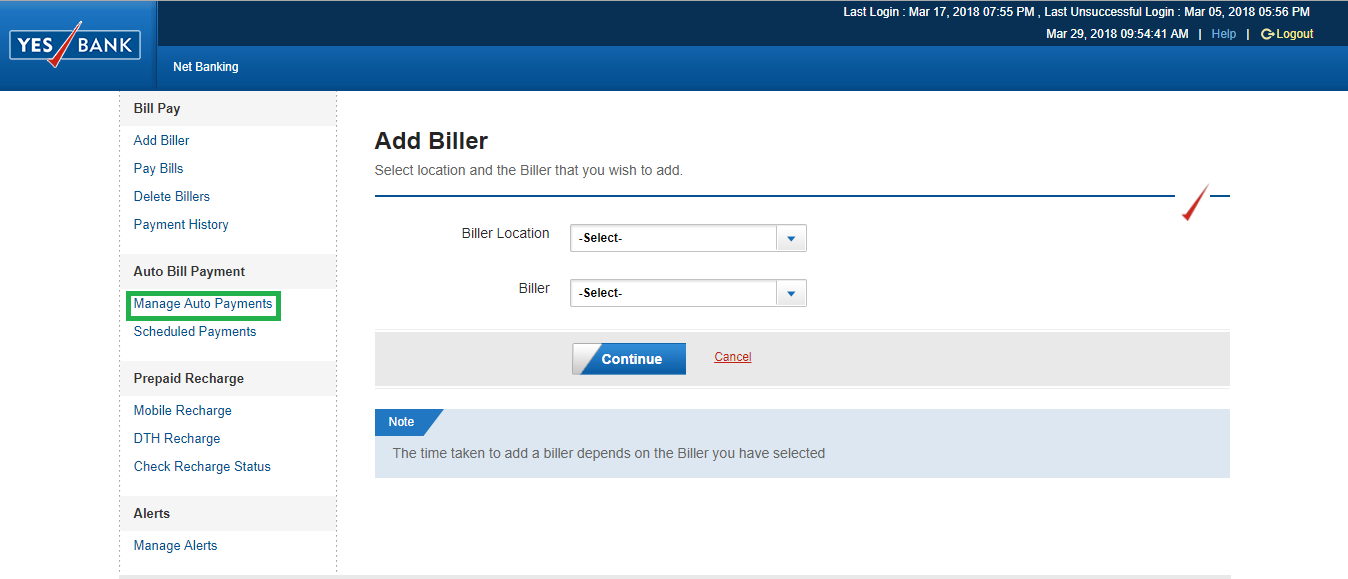
ایڈ بلر پر جائیں اور خودکار ادائیگیوں کا نظم کریں ٹیب پر کلک کریں۔
رجسٹریشن کا عمل صرف بلر کو رجسٹر کرنے سے مکمل نہیں ہوتا ہے۔ بلر کو رجسٹر کرنے کے بعد، آپ کو سیٹ اپ کرنے کی ضرورت ہے۔خودکار ادائیگی کا عمل تاکہ ایس آئی پی کی ادائیگی خودکار ہو جائے۔ عمل کو ترتیب دینے کے لیے، آپ کو بلرز سیکشن کو شامل کرنے کے لیے جانا ہوگا اور اس پر کلک کرنا ہوگا۔خودکار ادائیگیوں کا نظم کریں۔ ٹیب جو اسکرین کے بائیں جانب ہے۔ اس قدم کی تصویر نیچے دی گئی ہے جہاں خودکار ادائیگیوں کا نظم کریں ٹیب کو سبز رنگ میں نمایاں کیا گیا ہے۔
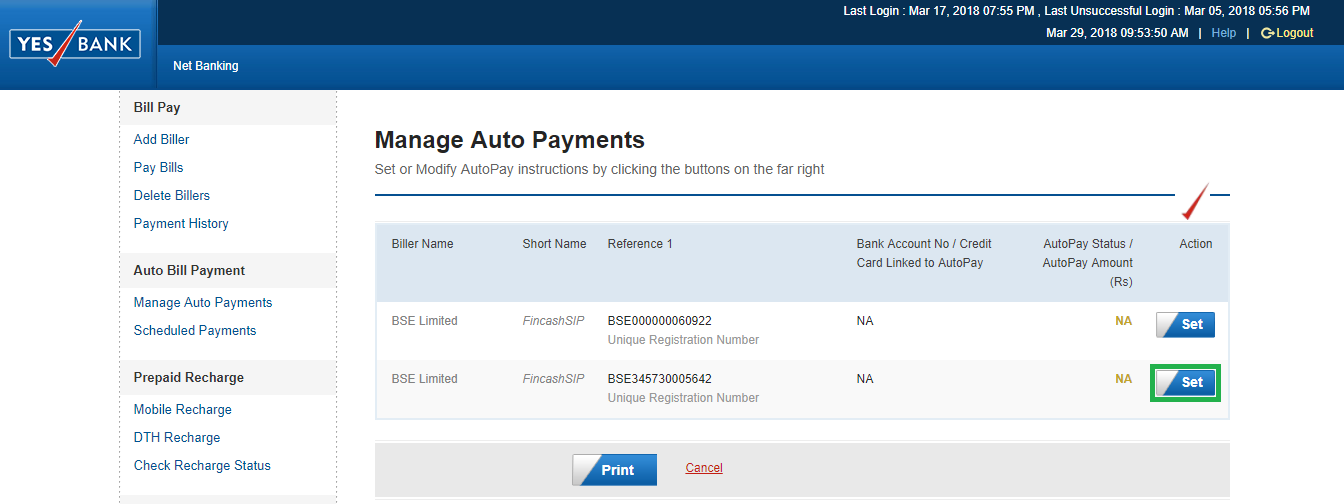
URN رجسٹرڈ کے خلاف سیٹ آپشن پر کلک کریں۔
ایک بار جب آپ کلک کریں۔خودکار ادائیگیوں کا نظم کریں۔ پچھلے مرحلے میں، ایک نئی اسکرین کھلتی ہے۔ اس اسکرین میں، آپ رجسٹرڈ SIP کا URN تلاش کر سکتے ہیں جس کے خلاف آپ کو کلک کرنے کی ضرورت ہے۔سیٹ اختیار اس اسکرین کی تصویر نیچے دی گئی ہے جہاں سیٹ آپشن کو سبز رنگ میں نمایاں کیا گیا ہے۔
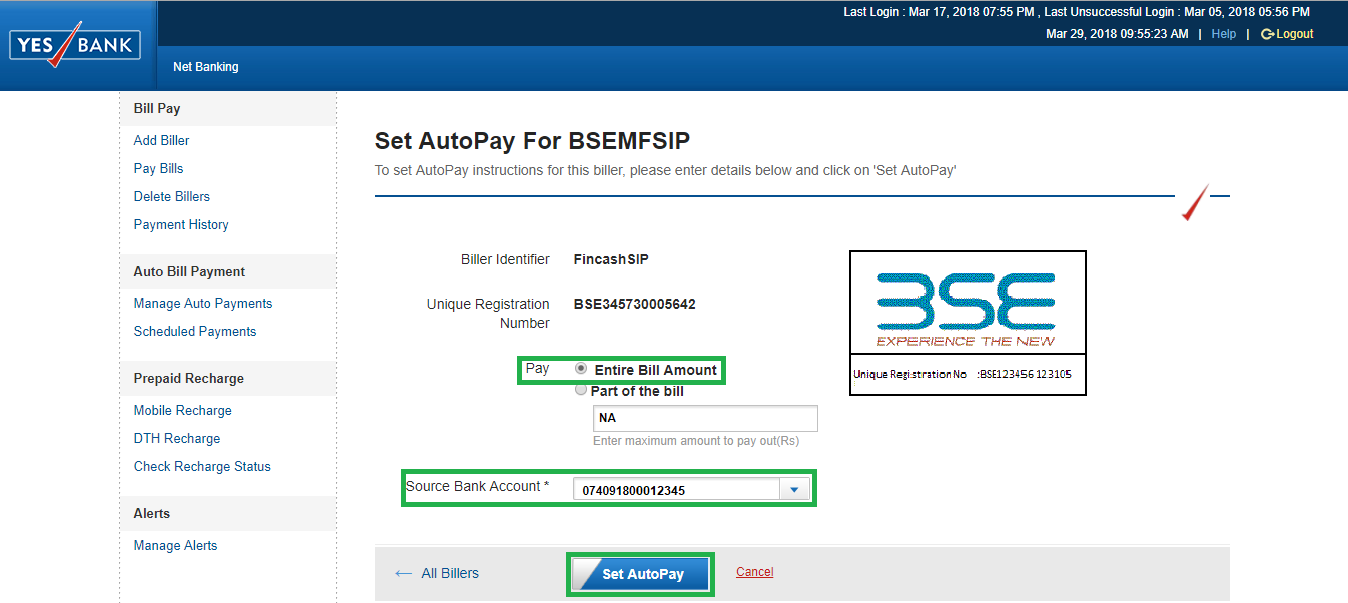
ادائیگی کے اختیارات سیٹ کریں۔
ایک بار جب آپ کلک کریں۔سیٹ، آپ کو ایک نئی اسکرین پر بھیج دیا جاتا ہے جس میں؛ آپ کو ادائیگی کی تفصیلات درج کرنے کی ضرورت ہے۔ اس مرحلے میں، پے آپشن کے خلاف، آپ کو منتخب کرنے کی ضرورت ہے۔بل کی پوری رقم، وہ بینک اکاؤنٹ منتخب کریں جس کے خلاف SIP کی قسط کاٹی جائے گی۔ ان تفصیلات کو داخل کرنے کے بعد پھر آپ کو کلک کرنے کی ضرورت ہے۔آٹو پے سیٹ کریں۔ اختیار اس قدم کی تصویر نیچے دی گئی ہے جہاں پے آپشن، سورس بینک اکاؤنٹ، اور سیٹ آٹو پے ٹیب کو سبز رنگ میں نمایاں کیا گیا ہے۔
تصدیق اور تصدیق کریں۔
ایک بار جب آپ کلک کریں۔آٹو پے سیٹ کریں۔ آپشن پر، ایک نئی سکرین کھلتی ہے جس میں آپ تفصیلات چیک کر سکتے ہیں اور اگر تمام تفصیلات درست ہیں تو پر کلک کریں۔تصدیق کریں۔ اختیار اس قدم کے لیے تصویر نیچے دی گئی ہے جہاں Confirm آپشن کو سبز رنگ میں نمایاں کیا گیا ہے۔
فائنل رجسٹریشن
یہ آخری مرحلہ ہے جس میں؛ ایک بار جب آپ کلک کریںتصدیق کریں۔، آپ آٹو پے کے عمل کی تصدیق دیکھ سکتے ہیں۔ اس قدم کی تصویر نیچے دی گئی ہے۔ اس طرح، مندرجہ بالا پانچ مراحل سے پتہ چلتا ہے کہ یس بینک کے معاملے میں بلر کے اضافے کا عمل آسان ہے۔
اس طرح، مندرجہ بالا دس مراحل سے پتہ چلتا ہے کہ یس بینک کے معاملے میں بلر کے اضافے کا عمل آسان ہے۔
بہتر منافع کمانے کے لیے سرمایہ کاری کے لیے بہترین SIPs
یہاں کے مطابق کچھ تجویز کردہ SIPs ہیں۔5 سال سے زیادہ کی واپسی اور AUMINR 500 کروڑ
Fund NAV Net Assets (Cr) Min SIP Investment 3 MO (%) 6 MO (%) 1 YR (%) 3 YR (%) 5 YR (%) 2025 (%) ICICI Prudential Infrastructure Fund Growth ₹202.51
↑ 0.83 ₹8,550 100 1.1 5.4 4.6 18.4 23 6.7 SBI PSU Fund Growth ₹34.3228
↑ 0.27 ₹6,684 500 -4.4 -1.7 9.6 22.4 22.9 11.3 SBI Gold Fund Growth ₹41.2688
↓ -0.10 ₹15,294 500 -5.3 -11.5 42.4 32 22.6 71.5 Axis Gold Fund Growth ₹40.9229
↓ -0.11 ₹2,828 1,000 -5.5 -9.5 41.8 31.6 22.5 69.8 Aditya Birla Sun Life Gold Fund Growth ₹40.9668
↓ -0.05 ₹1,648 100 -5 -13.8 42.1 31.8 22.5 72 Note: Returns up to 1 year are on absolute basis & more than 1 year are on CAGR basis. as on 31 Jul 26 Research Highlights & Commentary of 5 Funds showcased
Commentary ICICI Prudential Infrastructure Fund SBI PSU Fund SBI Gold Fund Axis Gold Fund Aditya Birla Sun Life Gold Fund Point 1 Upper mid AUM (₹8,550 Cr). Lower mid AUM (₹6,684 Cr). Highest AUM (₹15,294 Cr). Bottom quartile AUM (₹2,828 Cr). Bottom quartile AUM (₹1,648 Cr). Point 2 Oldest track record among peers (20 yrs). Established history (16+ yrs). Established history (14+ yrs). Established history (14+ yrs). Established history (14+ yrs). Point 3 Top rated. Rating: 2★ (lower mid). Rating: 2★ (bottom quartile). Rating: 1★ (bottom quartile). Rating: 3★ (upper mid). Point 4 Risk profile: High. Risk profile: High. Risk profile: Moderately High. Risk profile: Moderately High. Risk profile: Moderately High. Point 5 5Y return: 22.96% (top quartile). 5Y return: 22.88% (upper mid). 5Y return: 22.65% (lower mid). 5Y return: 22.48% (bottom quartile). 5Y return: 22.48% (bottom quartile). Point 6 3Y return: 18.40% (bottom quartile). 3Y return: 22.37% (bottom quartile). 3Y return: 32.03% (top quartile). 3Y return: 31.56% (lower mid). 3Y return: 31.78% (upper mid). Point 7 1Y return: 4.59% (bottom quartile). 1Y return: 9.60% (bottom quartile). 1Y return: 42.41% (top quartile). 1Y return: 41.84% (lower mid). 1Y return: 42.10% (upper mid). Point 8 Alpha: 0.00 (top quartile). Alpha: -0.30 (bottom quartile). 1M return: 1.02% (top quartile). 1M return: 0.97% (lower mid). 1M return: 0.98% (upper mid). Point 9 Sharpe: -0.07 (bottom quartile). Sharpe: 0.12 (bottom quartile). Alpha: 0.00 (upper mid). Alpha: 0.00 (lower mid). Alpha: 0.00 (bottom quartile). Point 10 Information ratio: 0.00 (top quartile). Information ratio: -0.11 (bottom quartile). Sharpe: 1.29 (upper mid). Sharpe: 1.35 (top quartile). Sharpe: 1.20 (lower mid). ICICI Prudential Infrastructure Fund
SBI PSU Fund
SBI Gold Fund
Axis Gold Fund
Aditya Birla Sun Life Gold Fund
To generate capital appreciation and income distribution to unit holders by investing predominantly in equity/equity related securities of the companies belonging to the infrastructure development and balance in debt securities and money market instruments. Below is the key information for ICICI Prudential Infrastructure Fund Returns up to 1 year are on The objective of the scheme would be to provide investors with opportunities for long-term growth in capital along with the liquidity of an open-ended scheme through an active management of investments in a diversified basket of equity stocks of domestic Public Sector Undertakings and in debt and money market instruments issued by PSUs AND others. Research Highlights for SBI PSU Fund Below is the key information for SBI PSU Fund Returns up to 1 year are on The scheme seeks to provide returns that closely correspond to returns provided by SBI - ETF Gold (Previously known as SBI GETS). Research Highlights for SBI Gold Fund Below is the key information for SBI Gold Fund Returns up to 1 year are on To generate returns that closely correspond to returns generated by Axis Gold ETF. Research Highlights for Axis Gold Fund Below is the key information for Axis Gold Fund Returns up to 1 year are on An Open ended Fund of Funds Scheme with the investment objective to provide returns that tracks returns provided by Birla Sun Life Gold ETF (BSL Gold ETF). Research Highlights for Aditya Birla Sun Life Gold Fund Below is the key information for Aditya Birla Sun Life Gold Fund Returns up to 1 year are on 1. ICICI Prudential Infrastructure Fund
ICICI Prudential Infrastructure Fund
Growth Launch Date 31 Aug 05 NAV (31 Jul 26) ₹202.51 ↑ 0.83 (0.41 %) Net Assets (Cr) ₹8,550 on 30 Jun 26 Category Equity - Sectoral AMC ICICI Prudential Asset Management Company Limited Rating ☆☆☆ Risk High Expense Ratio 1.89 Sharpe Ratio -0.07 Information Ratio 0 Alpha Ratio 0 Min Investment 5,000 Min SIP Investment 100 Exit Load 0-1 Years (1%),1 Years and above(NIL) Growth of 10,000 investment over the years.
Date Value 31 Jul 21 ₹10,000 31 Jul 22 ₹11,961 31 Jul 23 ₹16,935 31 Jul 24 ₹27,533 31 Jul 25 ₹26,878 31 Jul 26 ₹28,111 Returns for ICICI Prudential Infrastructure Fund
absolute basis & more than 1 year are on CAGR (Compound Annual Growth Rate) basis. as on 31 Jul 26 Duration Returns 1 Month -0.8% 3 Month 1.1% 6 Month 5.4% 1 Year 4.6% 3 Year 18.4% 5 Year 23% 10 Year 15 Year Since launch 15.5% Historical performance (Yearly) on absolute basis
Year Returns 2025 6.7% 2024 27.4% 2023 44.6% 2022 28.8% 2021 50.1% 2020 3.6% 2019 2.6% 2018 -14% 2017 40.8% 2016 2% Fund Manager information for ICICI Prudential Infrastructure Fund
Name Since Tenure Ihab Dalwai 3 Jun 17 9.08 Yr. Sharmila D’mello 30 Jun 22 4.01 Yr. Data below for ICICI Prudential Infrastructure Fund as on 30 Jun 26
Equity Sector Allocation
Sector Value Industrials 47.57% Financial Services 10.57% Utility 10.32% Basic Materials 9.74% Real Estate 8.09% Energy 5.04% Consumer Cyclical 1.98% Communication Services 0.09% Asset Allocation
Asset Class Value Cash 5.83% Equity 94.17% Top Securities Holdings / Portfolio
Name Holding Value Quantity InterGlobe Aviation Ltd (Industrials)
Equity, Since 28 Feb 23 | INDIGO9% ₹745 Cr 1,691,985
↑ 50,000 Larsen & Toubro Ltd (Industrials)
Equity, Since 30 Nov 09 | LT7% ₹614 Cr 1,505,704 Oberoi Realty Ltd (Real Estate)
Equity, Since 31 May 23 | OBEROIRLTY4% ₹365 Cr 2,139,426 Gujarat Energy Ltd (Utilities)
Equity, Since 31 Jan 23 | GUJGASLTD4% ₹340 Cr 8,482,024
↑ 156,557 NTPC Ltd (Utilities)
Equity, Since 29 Feb 16 | NTPC4% ₹334 Cr 8,626,448 Shree Cement Ltd (Basic Materials)
Equity, Since 30 Apr 24 | SHREECEM3% ₹270 Cr 106,892
↑ 3,387 Kalpataru Projects International Ltd (Industrials)
Equity, Since 30 Sep 06 | KPIL3% ₹262 Cr 2,005,608 AIA Engineering Ltd (Industrials)
Equity, Since 28 Feb 21 | AIAENG3% ₹258 Cr 572,697 HDFC Bank Ltd (Financial Services)
Equity, Since 31 Jan 22 | HDFCBANK3% ₹250 Cr 3,357,506
↑ 1,057,506 Container Corporation of India Ltd (Industrials)
Equity, Since 31 Jan 16 | CONCOR3% ₹227 Cr 4,885,153 2. SBI PSU Fund
SBI PSU Fund
Growth Launch Date 7 Jul 10 NAV (31 Jul 26) ₹34.3228 ↑ 0.27 (0.79 %) Net Assets (Cr) ₹6,684 on 30 Jun 26 Category Equity - Sectoral AMC SBI Funds Management Private Limited Rating ☆☆ Risk High Expense Ratio 1.89 Sharpe Ratio 0.12 Information Ratio -0.11 Alpha Ratio -0.3 Min Investment 5,000 Min SIP Investment 500 Exit Load 0-1 Years (1%),1 Years and above(NIL) Growth of 10,000 investment over the years.
Date Value 31 Jul 21 ₹10,000 31 Jul 22 ₹10,878 31 Jul 23 ₹15,287 31 Jul 24 ₹28,684 31 Jul 25 ₹25,557 31 Jul 26 ₹28,011 Returns for SBI PSU Fund
absolute basis & more than 1 year are on CAGR (Compound Annual Growth Rate) basis. as on 31 Jul 26 Duration Returns 1 Month -0.8% 3 Month -4.4% 6 Month -1.7% 1 Year 9.6% 3 Year 22.4% 5 Year 22.9% 10 Year 15 Year Since launch 8% Historical performance (Yearly) on absolute basis
Year Returns 2025 11.3% 2024 23.5% 2023 54% 2022 29% 2021 32.4% 2020 -10% 2019 6% 2018 -23.8% 2017 21.9% 2016 16.2% Fund Manager information for SBI PSU Fund
Name Since Tenure Rohit Shimpi 1 Jun 24 2.08 Yr. Data below for SBI PSU Fund as on 30 Jun 26
Equity Sector Allocation
Sector Value Financial Services 32.54% Utility 31.22% Industrials 14.07% Energy 11.97% Basic Materials 6.94% Asset Allocation
Asset Class Value Cash 3.18% Equity 96.74% Debt 0.07% Top Securities Holdings / Portfolio
Name Holding Value Quantity State Bank of India (Financial Services)
Equity, Since 31 Jul 10 | SBIN17% ₹1,112 Cr 11,527,500
↑ 1,000,000 GAIL (India) Ltd (Utilities)
Equity, Since 31 May 24 | GAIL10% ₹628 Cr 38,150,000 NTPC Ltd (Utilities)
Equity, Since 31 Jul 10 | NTPC9% ₹597 Cr 15,443,244 Bharat Electronics Ltd (Industrials)
Equity, Since 30 Jun 24 | BEL9% ₹583 Cr 14,185,000
↑ 800,000 Power Grid Corp Of India Ltd (Utilities)
Equity, Since 31 Jul 10 | POWERGRID9% ₹579 Cr 19,935,554 Oil & Natural Gas Corp Ltd (Energy)
Equity, Since 31 May 20 | ONGC6% ₹389 Cr 14,655,000 Bank of Baroda (Financial Services)
Equity, Since 31 Aug 24 | BANKBARODA5% ₹352 Cr 13,100,000 Bharat Petroleum Corp Ltd (Energy)
Equity, Since 31 Aug 24 | BPCL4% ₹289 Cr 9,700,000 Bharat Heavy Electricals Ltd (Industrials)
Equity, Since 30 Jun 25 | BHEL4% ₹271 Cr 6,500,000 NMDC Ltd (Basic Materials)
Equity, Since 31 Oct 23 | NMDC4% ₹245 Cr 27,900,000 3. SBI Gold Fund
SBI Gold Fund
Growth Launch Date 12 Sep 11 NAV (31 Jul 26) ₹41.2688 ↓ -0.10 (-0.24 %) Net Assets (Cr) ₹15,294 on 30 Jun 26 Category Gold - Gold AMC SBI Funds Management Private Limited Rating ☆☆ Risk Moderately High Expense Ratio 0.3 Sharpe Ratio 1.29 Information Ratio 0 Alpha Ratio 0 Min Investment 5,000 Min SIP Investment 500 Exit Load 0-1 Years (1%),1 Years and above(NIL) Growth of 10,000 investment over the years.
Date Value 31 Jul 21 ₹10,000 31 Jul 22 ₹10,500 31 Jul 23 ₹12,058 31 Jul 24 ₹13,968 31 Jul 25 ₹19,487 31 Jul 26 ₹27,752 Returns for SBI Gold Fund
absolute basis & more than 1 year are on CAGR (Compound Annual Growth Rate) basis. as on 31 Jul 26 Duration Returns 1 Month 1% 3 Month -5.3% 6 Month -11.5% 1 Year 42.4% 3 Year 32% 5 Year 22.6% 10 Year 15 Year Since launch 10% Historical performance (Yearly) on absolute basis
Year Returns 2025 71.5% 2024 19.6% 2023 14.1% 2022 12.6% 2021 -5.7% 2020 27.4% 2019 22.8% 2018 6.4% 2017 3.5% 2016 10% Fund Manager information for SBI Gold Fund
Name Since Tenure Viral Chhadva 1 Mar 26 0.33 Yr. Data below for SBI Gold Fund as on 30 Jun 26
Asset Allocation
Asset Class Value Cash 1.64% Other 98.36% Top Securities Holdings / Portfolio
Name Holding Value Quantity SBI Gold ETF
- | -100% ₹16,542 Cr 1,246,686,194
↑ 13,950,000 Net Receivable / Payable
CBLO | -0% -₹55 Cr Treps
CBLO/Reverse Repo | -0% ₹45 Cr 4. Axis Gold Fund
Axis Gold Fund
Growth Launch Date 20 Oct 11 NAV (31 Jul 26) ₹40.9229 ↓ -0.11 (-0.27 %) Net Assets (Cr) ₹2,828 on 30 Jun 26 Category Gold - Gold AMC Axis Asset Management Company Limited Rating ☆ Risk Moderately High Expense Ratio 0.5 Sharpe Ratio 1.35 Information Ratio 0 Alpha Ratio 0 Min Investment 5,000 Min SIP Investment 1,000 Exit Load 0-1 Years (1%),1 Years and above(NIL) Growth of 10,000 investment over the years.
Date Value 31 Jul 21 ₹10,000 31 Jul 22 ₹10,512 31 Jul 23 ₹12,108 31 Jul 24 ₹14,013 31 Jul 25 ₹19,436 31 Jul 26 ₹27,568 Returns for Axis Gold Fund
absolute basis & more than 1 year are on CAGR (Compound Annual Growth Rate) basis. as on 31 Jul 26 Duration Returns 1 Month 1% 3 Month -5.5% 6 Month -9.5% 1 Year 41.8% 3 Year 31.6% 5 Year 22.5% 10 Year 15 Year Since launch 10% Historical performance (Yearly) on absolute basis
Year Returns 2025 69.8% 2024 19.2% 2023 14.7% 2022 12.5% 2021 -4.7% 2020 26.9% 2019 23.1% 2018 8.3% 2017 0.7% 2016 10.7% Fund Manager information for Axis Gold Fund
Name Since Tenure Aditya Pagaria 9 Nov 21 4.64 Yr. Pratik Tibrewal 1 Feb 25 1.41 Yr. Data below for Axis Gold Fund as on 30 Jun 26
Asset Allocation
Asset Class Value Cash 1.81% Other 98.19% Top Securities Holdings / Portfolio
Name Holding Value Quantity Axis Gold ETF
- | -100% ₹3,091 Cr 238,687,058
↑ 2,659,572 Clearing Corporation Of India Ltd
CBLO | -0% ₹6 Cr Net Receivables / (Payables)
CBLO | -0% -₹5 Cr 5. Aditya Birla Sun Life Gold Fund
Aditya Birla Sun Life Gold Fund
Growth Launch Date 20 Mar 12 NAV (31 Jul 26) ₹40.9668 ↓ -0.05 (-0.13 %) Net Assets (Cr) ₹1,648 on 30 Jun 26 Category Gold - Gold AMC Birla Sun Life Asset Management Co Ltd Rating ☆☆☆ Risk Moderately High Expense Ratio 0.51 Sharpe Ratio 1.2 Information Ratio 0 Alpha Ratio 0 Min Investment 100 Min SIP Investment 100 Exit Load 0-365 Days (1%),365 Days and above(NIL) Growth of 10,000 investment over the years.
Date Value 31 Jul 21 ₹10,000 31 Jul 22 ₹10,548 31 Jul 23 ₹12,046 31 Jul 24 ₹13,896 31 Jul 25 ₹19,398 31 Jul 26 ₹27,564 Returns for Aditya Birla Sun Life Gold Fund
absolute basis & more than 1 year are on CAGR (Compound Annual Growth Rate) basis. as on 31 Jul 26 Duration Returns 1 Month 1% 3 Month -5% 6 Month -13.8% 1 Year 42.1% 3 Year 31.8% 5 Year 22.5% 10 Year 15 Year Since launch 10.3% Historical performance (Yearly) on absolute basis
Year Returns 2025 72% 2024 18.7% 2023 14.5% 2022 12.3% 2021 -5% 2020 26% 2019 21.3% 2018 6.8% 2017 1.6% 2016 11.5% Fund Manager information for Aditya Birla Sun Life Gold Fund
Name Since Tenure Priya Sridhar 31 Dec 24 1.5 Yr. Data below for Aditya Birla Sun Life Gold Fund as on 30 Jun 26
Asset Allocation
Asset Class Value Cash 1.57% Other 98.43% Top Securities Holdings / Portfolio
Name Holding Value Quantity Aditya BSL Gold ETF
- | -100% ₹1,821 Cr 133,076,381
↑ 939,171 Clearing Corporation Of India Limited
CBLO/Reverse Repo | -0% ₹5 Cr Net Receivables / (Payables)
Net Current Assets | -0% -₹4 Cr
مزید کسی بھی سوال کی صورت میں، آپ ہم سے 8451864111 پر کسی بھی کام کے دن صبح 9.30 بجے سے شام 6.30 بجے کے درمیان رابطہ کر سکتے ہیں یا ہمیں کسی بھی وقت ای میل لکھ سکتے ہیں۔support@fincash.com یا ہماری ویب سائٹ پر لاگ ان کرکے ہمارے ساتھ بات چیت کریں۔www.fincash.com.
یہاں فراہم کردہ معلومات کے درست ہونے کو یقینی بنانے کے لیے تمام کوششیں کی گئی ہیں۔ تاہم، ڈیٹا کی درستگی کے حوالے سے کوئی ضمانت نہیں دی جاتی ہے۔ براہ کرم کوئی بھی سرمایہ کاری کرنے سے پہلے اسکیم کی معلومات کے دستاویز کے ساتھ تصدیق کریں۔
")


AMFI Registration No. 112358 | CIN: U74999MH2016PTC282153
Shepard Technologies Pvt. Ltd. (with ARN code 112358) makes no warranties or representations, express or implied, on products offered through the platform. It accepts no liability for any damages or losses, however caused, in connection with the use of, or on the reliance of its product or related services. Terms and conditions of the website are applicable.
©2026 Shepard Technologies Private Limited. All Rights Reserved
Research Highlights for ICICI Prudential Infrastructure Fund