انڈس انڈ بینک میں ایس آئی پی ٹرانزیکشنز کے لیے بلر کیسے شامل کریں؟
گھونٹ یا منظمسرمایہ کاری کا منصوبہ میں سرمایہ کاری کا موڈ ہے۔مشترکہ فنڈ جس کے ذریعے افراد باقاعدہ وقفوں پر تھوڑی بہت رقم جمع کراتے ہیں۔ ایک اہم نکتہ جسے افراد کو یہاں سمجھنا چاہیے، وہ یہ ہے کہ رقم کو وقفے وقفے سے کاٹ لیا جاتا ہے۔ نتیجے کے طور پر، اس بات کا یقین کرنے کے لئے کہ پوریSIP سرمایہ کاری عمل آسانی سے ہوتا ہے؛ افراد بلر کو اپنے میں شامل کر سکتے ہیں۔بینک اکاؤنٹس بینک اکاؤنٹس میں بلر شامل کرنے کے لیے، افراد کو SIP کا منفرد رجسٹریشن نمبر یا URN درکار ہوتا ہے جسے نیٹ بینکنگ یا موبائل بینکنگ کے عمل کے ذریعے بینک اکاؤنٹ میں شامل کرنے کی ضرورت ہوتی ہے۔ ہر بینک کے لیے بلر شامل کرنے کا عمل مختلف ہے۔ لہذا، آئیے انڈس انڈ بینک میں ایس آئی پی لین دین کے لیے بلر شامل کرنے کے عمل کو چیک کریں۔
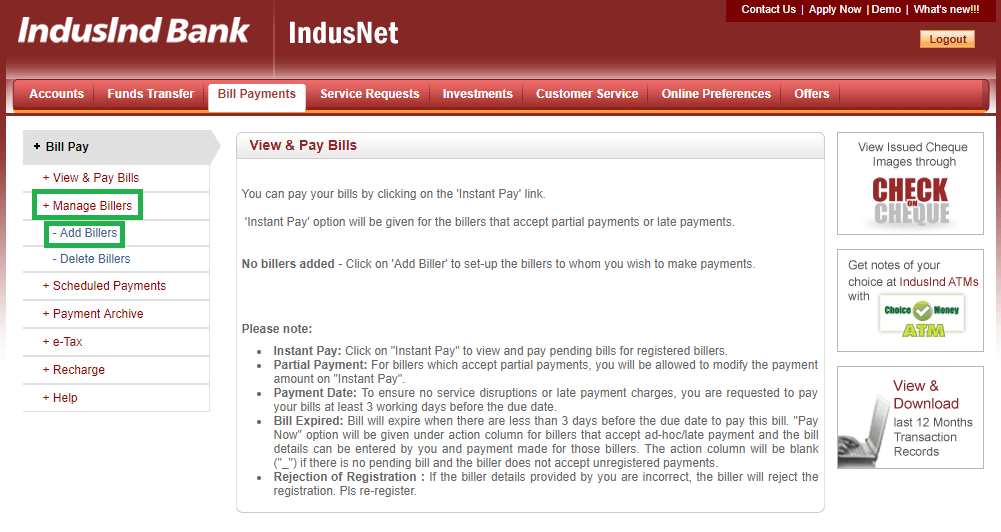
اپنے انڈس انڈ بینک اکاؤنٹ میں لاگ ان کریں اور بل پے آپشن پر کلک کریں۔
پہلا مرحلہ زیادہ تر بینکوں میں تقریباً یکساں ہے جن میں افراد کو اپنے بینک اکاؤنٹس میں لاگ ان کرنے کی ضرورت ہوتی ہے۔ یہاں تک کہ اس صورت میں، آپ کو پہلے اپنے لاگ ان کی اسناد کا استعمال کرتے ہوئے اپنے اکاؤنٹ میں لاگ ان کرنے کی ضرورت ہے۔ لاگ ان کرنے کے بعد، ایک بار جب آپ ہوم اسکرین پر پہنچ جاتے ہیں، تو آپ کو کلک کرنے کی ضرورت ہوتی ہے۔بل کی ادائیگی ٹیب جو اسکرین کے اوپری حصے میں ہے۔ اس قدم کی تصویر نیچے دی گئی ہے جہاںبل کی ادائیگی ٹیب کو سبز رنگ میں نمایاں کیا گیا ہے۔

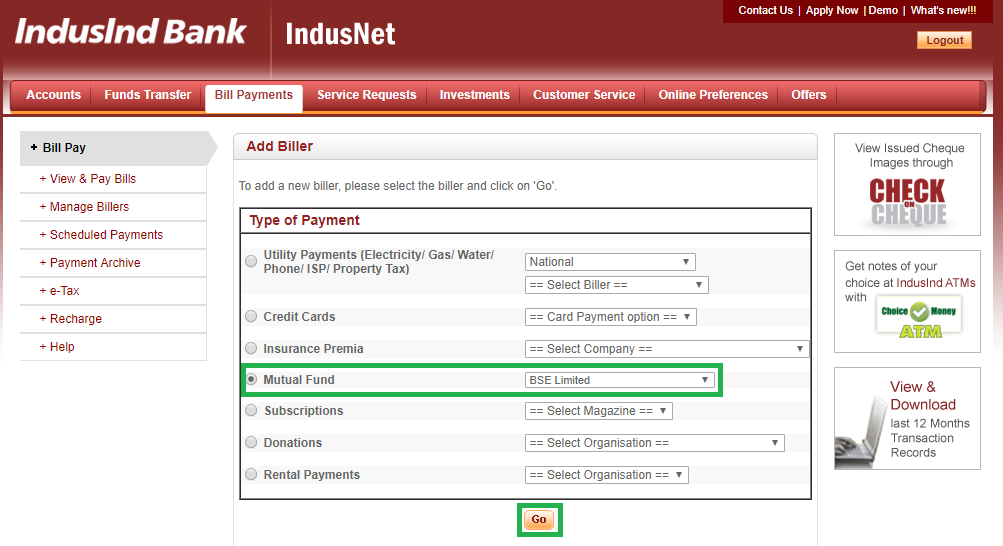
مینیج بلر ٹیب پر کلک کریں اور ایڈ بلر آپشن کو منتخب کریں۔
بل کی ادائیگی پر کلک کرنے کے بعد، ایک نئی اسکرین کھل جائے گی۔ اس اسکرین میں، آپ کو کلک کرنے کی ضرورت ہے۔بلرز کا نظم کریں۔ ٹیب جو اسکرین کے بائیں جانب ہے۔ ایک بار، آپ مینیج بلر آپشن پر کلک کرتے ہیں، ٹیب پھیل جاتا ہے اور اس ٹیب میں، آپ کو کلک کرنے کی ضرورت ہوتی ہے۔بلرز شامل کریں۔ اختیار اس قدم کی تصویر نیچے دی گئی ہے جہاں مینیج بلرز اور ایڈ بلرز آپشن کو سبز رنگ میں نمایاں کیا گیا ہے۔
میوچل فنڈ آپشن پر کلک کریں اور بی ایس ای لمیٹڈ کو منتخب کریں۔
ایک بار جب آپ کلک کریں۔بلر شامل کریں۔ پچھلے مرحلے میں، آپ کو ایک نئی اسکرین پر بھیج دیا جائے گا جو ادائیگی کی قسم کے طور پر ظاہر ہوتی ہے۔ اس سیکشن میں، مختلف اختیارات ہیں جیسے یوٹیلیٹی ادائیگیاں،کریڈٹ کارڈ,انشورنس پریمیا، اور بہت کچھ۔ اس سیکشن میں، آپ کو کلک کرنے کی ضرورت ہے۔مشترکہ فنڈ اختیار اور منتخب کریں۔بی ایس ای لمیٹڈ اس کے ساتھ والے ڈراپ ڈاؤن میں۔ منتخب کرنے کے بعدبی ایس ای لمیٹڈ آپشن پر کلک کرنے کی ضرورت ہے۔جاؤ اختیار اس قدم کی تصویر نیچے دی گئی ہے جہاں میوچل فنڈ، بی ایس ای لمیٹڈ، اور گو بٹن کو سبز رنگ میں نمایاں کیا گیا ہے۔
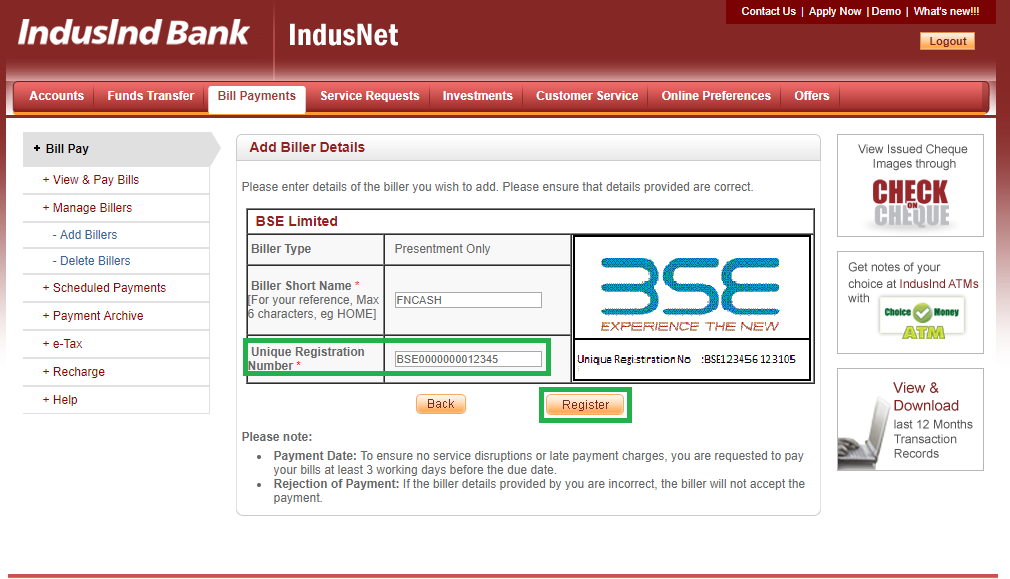
URN تفصیلات درج کریں۔
یہ ایڈ بلر کے عمل کا اہم مرحلہ ہے۔ ایک بار جب آپ Go پر کلک کرتے ہیں، اس مرحلے میں، آپ کو ایک نئی اسکرین پر بھیج دیا جاتا ہے، جس میں آپ کو اپنا URN اور دیگر تفصیلات درج کرنے کی ضرورت ہوتی ہے۔ ابتدائی ادائیگی کرنے کے بعد آپ کو یہ URN نمبر Fincash سے ای میل کے ذریعے اپنے SIP کے لیے موصول ہوگا۔ اگر آپ اسے وصول نہیں کرتے ہیں تو آپ اسے سے تلاش کرسکتے ہیں۔میرے ایس آئی پیز section of your Fincash Account. URN حاصل کرنے کے بعد، آپ کو اسے یہاں درج کرنے اور دیگر تفصیلات شامل کرنے کی ضرورت ہے۔ تفصیلات درج کرنے کے بعد، آپ کو کلک کرنے کی ضرورت ہے۔رجسٹر کریں۔ اختیار اس مرحلے کی تصویر نیچے دی گئی ہے جہاں URN تفصیلات اور رجسٹر بٹن دونوں کو سبز رنگ میں نمایاں کیا گیا ہے۔
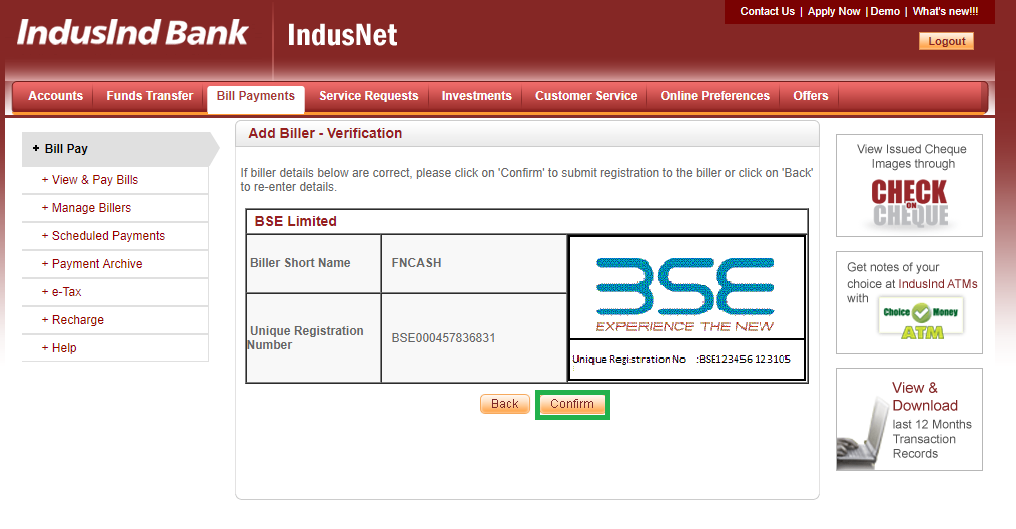
خلاصہ کی تصدیق
ایک بار جب آپ کلک کریں۔رجسٹر کریں۔ پچھلے مرحلے میں، ایک نئی اسکرین کھلتی ہے جس میں آپ اپنی درج کردہ تفصیلات کا خلاصہ دیکھ سکتے ہیں۔ اس مرحلے میں، آپ کو تصدیق کرنے کی ضرورت ہے کہ آیا درج کردہ تفصیلات درست ہیں یا نہیں۔ ایک بار جب آپ تفصیلات کے ساتھ تصدیق کر لیتے ہیں، تو آپ کو کلک کرنے کی ضرورت ہے۔تصدیق کریں۔. اس قدم کی تصویر نیچے دی گئی ہے جہاںتصدیق کریں۔ بٹن کو سبز رنگ میں نمایاں کیا گیا ہے۔
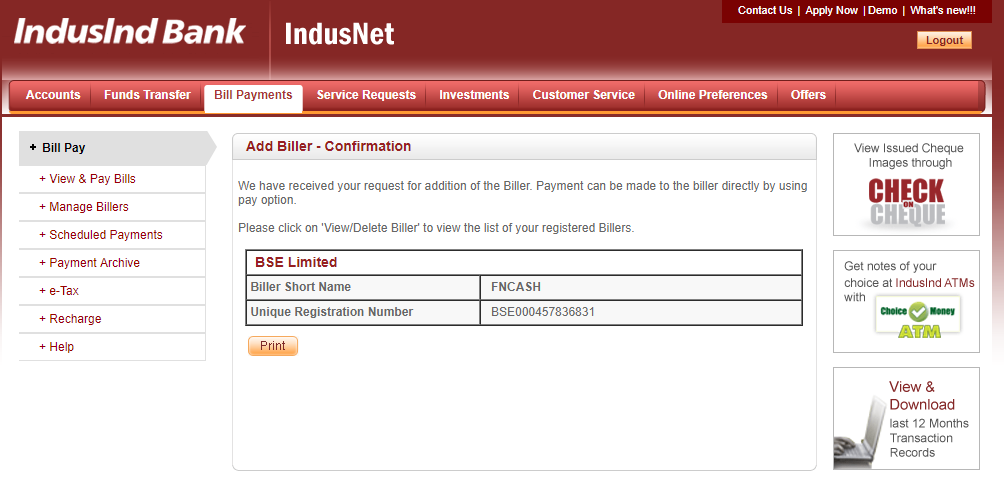
بلر کی تصدیق
اس مرحلے میں، آپ کو بلر کی تصدیق موصول ہوتی ہے جس میں کہا جاتا ہے کہ آپ کا بلر کامیابی کے ساتھ شامل کر دیا گیا ہے۔ اس قدم کی تصویر نیچے دی گئی ہے۔
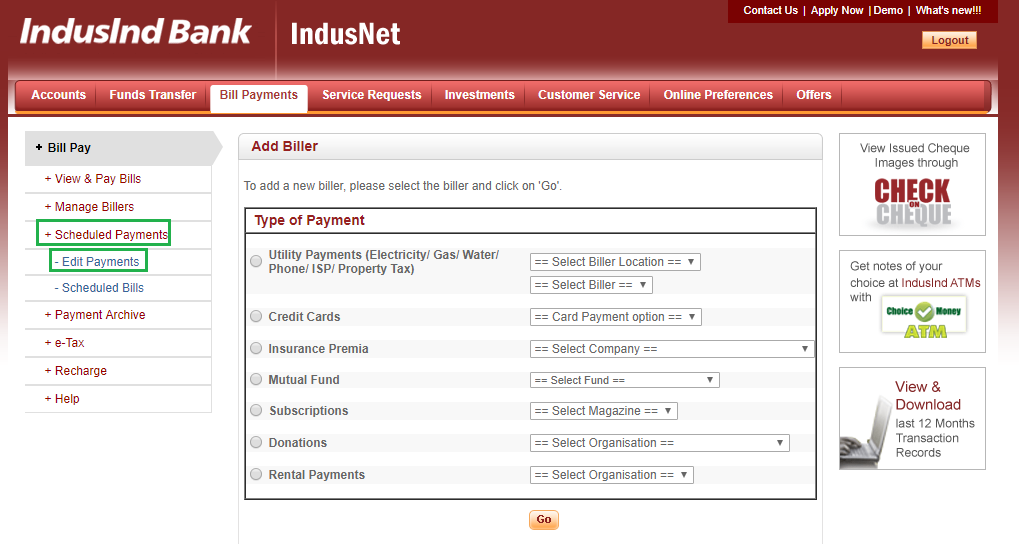
ادائیگیوں کے شیڈول پر کلک کریں اور ادائیگیوں میں ترمیم کریں کو منتخب کریں۔
بلر کو شامل کرنے کا آپ کا عمل صرف بلر کو شامل کرنے سے نہیں رکتا. ایک بار جب آپ کامیابی کے ساتھ بلر کو شامل کرتے ہیں، تو آپ کو کلک کرنے کی ضرورت ہے۔ادائیگیوں کا شیڈول بنائیں ٹیب جو اسکرین کے بائیں جانب ہے۔ ایک بار جب آپ کلک کرتے ہیں، اس پر ٹیب پھیل جاتا ہے اور اس کے نیچے متعدد اختیارات دکھاتا ہے۔ یہاں، آپ کو کلک کرنے کی ضرورت ہے۔ادائیگیوں میں ترمیم کریں۔ اختیار اس قدم کی تصویر نیچے دی گئی ہے جہاں ادائیگیوں کا شیڈول ٹیب اور ادائیگیوں میں ترمیم کا اختیار دونوں کو سبز رنگ میں نمایاں کیا گیا ہے۔
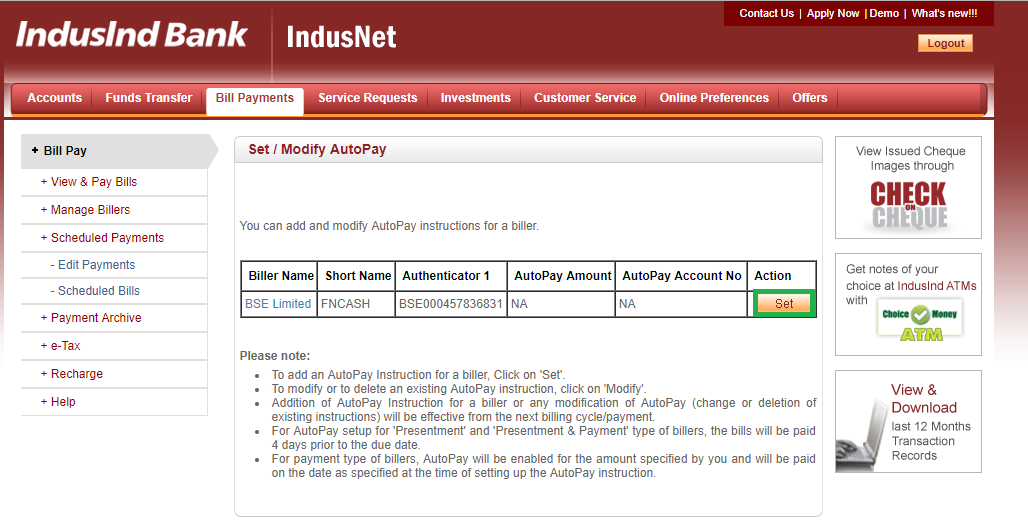
موڈیفائی آٹو پے اسکرین میں سیٹ آپشن پر کلک کریں۔
ایک بار جب آپ کلک کریں۔ادائیگیوں میں ترمیم کریں۔، ایک نئی اسکرین کھلتی ہے جس میں آپ میوچل فنڈ بلر کو شامل کیا ہوا دیکھ سکتے ہیں۔ آپ بلر کے خلاف SIP کا URN بھی دیکھ سکتے ہیں۔ یہاں، آپ کو کلک کرنے کی ضرورت ہے۔سیٹ میوچل فنڈ بلر کے خلاف آپشن۔ اس قدم کی تصویر نیچے دی گئی ہے جہاں سیٹ آپشن کو سبز رنگ میں نمایاں کیا گیا ہے۔
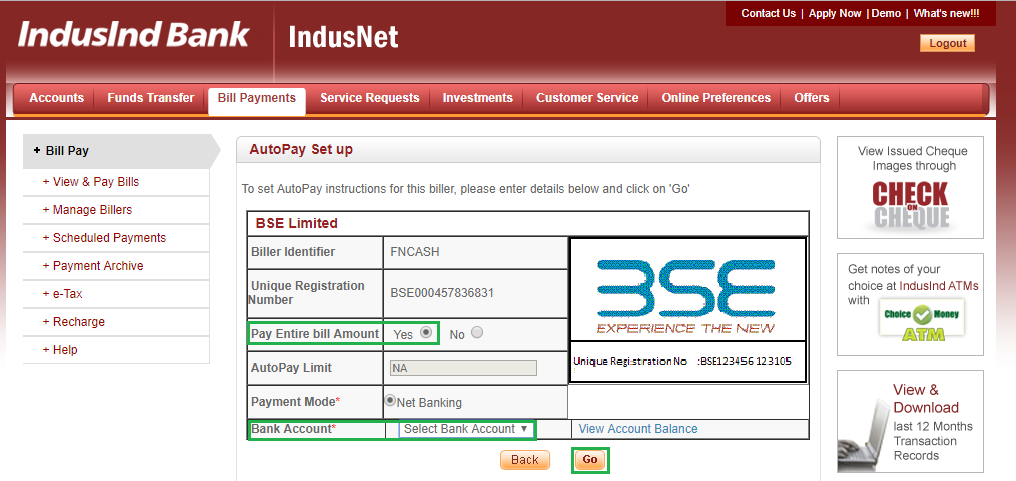
ادائیگی کی تفصیلات درج کریں اور Go پر کلک کریں۔
اس مرحلے میں، آپ کو ادائیگی کی تفصیلات درج کرنے کی ضرورت ہے۔ ایک بار جب آپ کلک کریں۔سیٹ پچھلے مرحلے میں، ایک نئی اسکرین کھلتی ہے جس میں آپ کو ادائیگی کی تفصیلات درج کرنے کی ضرورت ہوتی ہے۔ یہاں، کے خلافبل کی پوری رقم ادا کریں۔ اختیار، آپ کو منتخب کرنے کی ضرورت ہےجی ہاں اختیار پھر آپ کو ادائیگی کے موڈ کو نیٹ بینکنگ کے طور پر منتخب کرنے کی ضرورت ہے۔ مزید یہ کہ، آپ کو وہ بینک اکاؤنٹ نمبر منتخب کرنے کی ضرورت ہے جس سے آپ ادائیگی کرنا چاہتے ہیں۔ تمام تفصیلات درج کرنے کے بعد، آپ کو کلک کرنے کی ضرورت ہے۔جاؤ بٹن جو اسکرین کے نیچے ہے۔ اس قدم کی تصویر نیچے دی گئی ہے جہاں پے پورے بل اماؤنٹ آپشن، بینک اکاؤنٹ ٹیب اور گو بٹن کو سبز رنگ میں نمایاں کیا گیا ہے۔
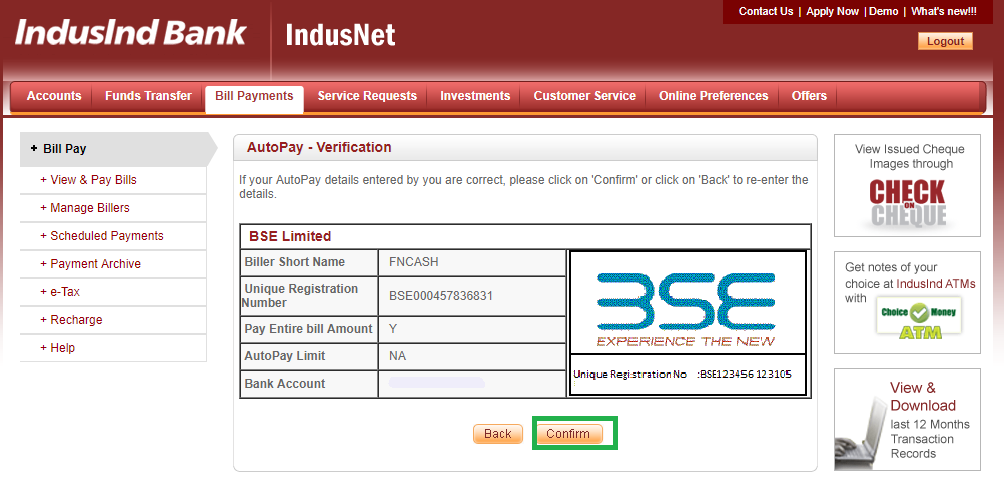
ادائیگی کی تفصیلات کی تصدیق
ایک بار جب آپ ادائیگی کی تفصیلات درج کریں اور پر کلک کریں۔جاؤ، آپ کو ایک نئی اسکرین پر بھیج دیا جاتا ہے جس میں آپ ان تمام تفصیلات کی تصدیق کر سکتے ہیں جو آپ نے درج کی ہیں۔ اگر آپ کو معلوم ہوتا ہے کہ تمام تفصیلات درست طریقے سے درج کی گئی ہیں، تو آپ کلک کر سکتے ہیں۔تصدیق کریں۔. اگر نہیں، تو بیک پر کلک کریں تاکہ آپ متعلقہ تفصیلات میں ترمیم کر سکیں۔ اس قدم کے لیے تصویر نیچے دی گئی ہے جہاں کنفرم بٹن کو سبز رنگ میں نمایاں کیا گیا ہے۔
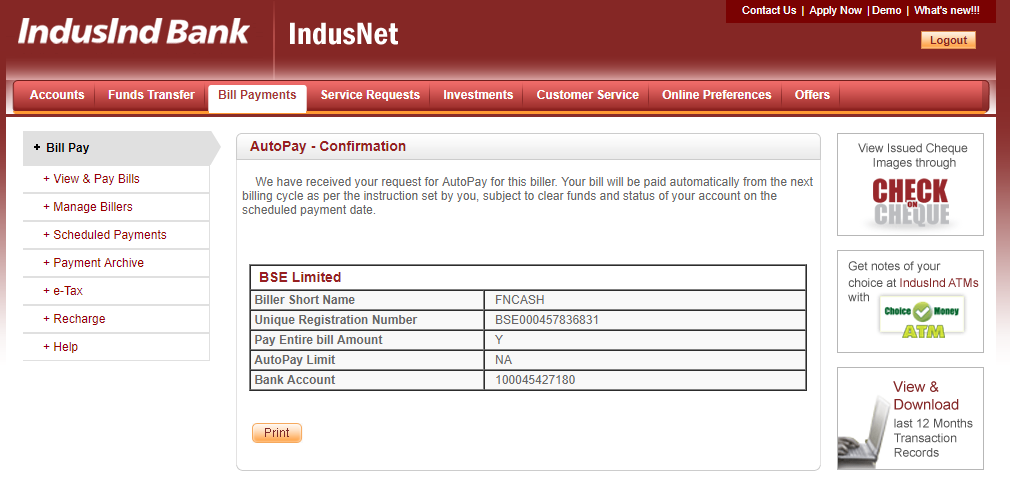
آٹو پے کی تفصیلات کی تصدیق
اس مرحلے میں، آپ کو آٹو پے اسٹیٹس کے بارے میں تصدیق ملتی ہے۔ اس قدم کی تصویر نیچے دی گئی ہے۔
اس طرح، مندرجہ بالا اقدامات سے، یہ کہا جا سکتا ہے کہ انڈس انڈ بینک میں ایس آئی پی ٹرانزیکشنز کے لیے بلر کو شامل کرنے کا عمل مشکل نہیں ہے۔ اسے شامل کر کے، افراد اس بات کو یقینی بنا سکتے ہیں کہ ان کی SIP کٹوتی بروقت ہو جائے۔ انہیں صرف اس بات کو یقینی بنانا ہوگا کہ ان کے بینک اکاؤنٹ میں کافی رقم موجود ہے۔
بہتر منافع کمانے کے لیے سرمایہ کاری کے لیے بہترین SIPs
یہاں کے مطابق کچھ تجویز کردہ SIPs ہیں۔5 سال سے زیادہ کی واپسی اور AUMINR 500 کروڑ
Fund NAV Net Assets (Cr) Min SIP Investment 3 MO (%) 6 MO (%) 1 YR (%) 3 YR (%) 5 YR (%) 2024 (%) ICICI Prudential Infrastructure Fund Growth ₹204.32
↑ 1.07 ₹8,351 100 5.7 4.8 2.5 20.7 23.3 6.7 LIC MF Infrastructure Fund Growth ₹54.4288
↑ 0.08 ₹1,099 1,000 10.2 13.1 8.4 25.4 23 -3.7 SBI PSU Fund Growth ₹34.4616
↑ 0.11 ₹6,594 500 -2.2 0.3 6.7 25.5 22.9 11.3 SBI Gold Fund Growth ₹41.0269
↑ 0.16 ₹16,533 500 -6.3 -2 41.3 31.7 22.5 71.5 IDBI Gold Fund Growth ₹36.3178
↑ 0.06 ₹824 500 -5.8 -4.1 40.4 31.5 22.5 79 Note: Returns up to 1 year are on absolute basis & more than 1 year are on CAGR basis. as on 15 Jul 26 Research Highlights & Commentary of 5 Funds showcased
Commentary ICICI Prudential Infrastructure Fund LIC MF Infrastructure Fund SBI PSU Fund SBI Gold Fund IDBI Gold Fund Point 1 Upper mid AUM (₹8,351 Cr). Bottom quartile AUM (₹1,099 Cr). Lower mid AUM (₹6,594 Cr). Highest AUM (₹16,533 Cr). Bottom quartile AUM (₹824 Cr). Point 2 Oldest track record among peers (20 yrs). Established history (18+ yrs). Established history (16+ yrs). Established history (14+ yrs). Established history (13+ yrs). Point 3 Top rated. Not Rated. Rating: 2★ (upper mid). Rating: 2★ (lower mid). Not Rated. Point 4 Risk profile: High. Risk profile: High. Risk profile: High. Risk profile: Moderately High. Risk profile: Moderately High. Point 5 5Y return: 23.33% (top quartile). 5Y return: 22.95% (upper mid). 5Y return: 22.93% (lower mid). 5Y return: 22.52% (bottom quartile). 5Y return: 22.51% (bottom quartile). Point 6 3Y return: 20.66% (bottom quartile). 3Y return: 25.43% (bottom quartile). 3Y return: 25.47% (lower mid). 3Y return: 31.66% (top quartile). 3Y return: 31.46% (upper mid). Point 7 1Y return: 2.54% (bottom quartile). 1Y return: 8.39% (lower mid). 1Y return: 6.66% (bottom quartile). 1Y return: 41.33% (top quartile). 1Y return: 40.36% (upper mid). Point 8 Alpha: 0.00 (lower mid). Alpha: 4.51 (top quartile). Alpha: 0.16 (upper mid). 1M return: -4.90% (bottom quartile). 1M return: -4.72% (bottom quartile). Point 9 Sharpe: 0.00 (bottom quartile). Sharpe: 0.26 (lower mid). Sharpe: 0.26 (bottom quartile). Alpha: 0.00 (bottom quartile). Alpha: 0.00 (bottom quartile). Point 10 Information ratio: 0.00 (upper mid). Information ratio: 0.55 (top quartile). Information ratio: -0.02 (bottom quartile). Sharpe: 1.93 (top quartile). Sharpe: 1.82 (upper mid). ICICI Prudential Infrastructure Fund
LIC MF Infrastructure Fund
SBI PSU Fund
SBI Gold Fund
IDBI Gold Fund
To generate capital appreciation and income distribution to unit holders by investing predominantly in equity/equity related securities of the companies belonging to the infrastructure development and balance in debt securities and money market instruments. Below is the key information for ICICI Prudential Infrastructure Fund Returns up to 1 year are on The investment objective of the scheme is to provide long term growth from a portfolio of equity / equity related instruments of companies engaged either directly or indirectly in the infrastructure sector. Research Highlights for LIC MF Infrastructure Fund Below is the key information for LIC MF Infrastructure Fund Returns up to 1 year are on The objective of the scheme would be to provide investors with opportunities for long-term growth in capital along with the liquidity of an open-ended scheme through an active management of investments in a diversified basket of equity stocks of domestic Public Sector Undertakings and in debt and money market instruments issued by PSUs AND others. Research Highlights for SBI PSU Fund Below is the key information for SBI PSU Fund Returns up to 1 year are on The scheme seeks to provide returns that closely correspond to returns provided by SBI - ETF Gold (Previously known as SBI GETS). Research Highlights for SBI Gold Fund Below is the key information for SBI Gold Fund Returns up to 1 year are on The investment objective of the Scheme will be to generate returns that correspond closely to the returns generated by IDBI Gold Exchange Traded Fund (IDBI GOLD ETF). Research Highlights for IDBI Gold Fund Below is the key information for IDBI Gold Fund Returns up to 1 year are on 1. ICICI Prudential Infrastructure Fund
ICICI Prudential Infrastructure Fund
Growth Launch Date 31 Aug 05 NAV (15 Jul 26) ₹204.32 ↑ 1.07 (0.53 %) Net Assets (Cr) ₹8,351 on 31 May 26 Category Equity - Sectoral AMC ICICI Prudential Asset Management Company Limited Rating ☆☆☆ Risk High Expense Ratio 1.89 Sharpe Ratio 0 Information Ratio 0 Alpha Ratio 0 Min Investment 5,000 Min SIP Investment 100 Exit Load 0-1 Years (1%),1 Years and above(NIL) Growth of 10,000 investment over the years.
Date Value 30 Jun 21 ₹10,000 30 Jun 22 ₹11,534 30 Jun 23 ₹16,346 30 Jun 24 ₹27,296 30 Jun 25 ₹28,743 30 Jun 26 ₹29,425 Returns for ICICI Prudential Infrastructure Fund
absolute basis & more than 1 year are on CAGR (Compound Annual Growth Rate) basis. as on 15 Jul 26 Duration Returns 1 Month 2.7% 3 Month 5.7% 6 Month 4.8% 1 Year 2.5% 3 Year 20.7% 5 Year 23.3% 10 Year 15 Year Since launch 15.5% Historical performance (Yearly) on absolute basis
Year Returns 2024 6.7% 2023 27.4% 2022 44.6% 2021 28.8% 2020 50.1% 2019 3.6% 2018 2.6% 2017 -14% 2016 40.8% 2015 2% Fund Manager information for ICICI Prudential Infrastructure Fund
Name Since Tenure Ihab Dalwai 3 Jun 17 9.08 Yr. Sharmila D’mello 30 Jun 22 4.01 Yr. Data below for ICICI Prudential Infrastructure Fund as on 31 May 26
Equity Sector Allocation
Sector Value Industrials 47.57% Financial Services 10.57% Utility 10.32% Basic Materials 9.74% Real Estate 8.09% Energy 5.04% Consumer Cyclical 1.98% Communication Services 0.09% Asset Allocation
Asset Class Value Cash 5.83% Equity 94.17% Top Securities Holdings / Portfolio
Name Holding Value Quantity InterGlobe Aviation Ltd (Industrials)
Equity, Since 28 Feb 23 | INDIGO9% ₹745 Cr 1,691,985
↑ 50,000 Larsen & Toubro Ltd (Industrials)
Equity, Since 30 Nov 09 | LT7% ₹614 Cr 1,505,704 Oberoi Realty Ltd (Real Estate)
Equity, Since 31 May 23 | OBEROIRLTY4% ₹365 Cr 2,139,426 Gujarat Energy Ltd (Utilities)
Equity, Since 31 Jan 23 | GUJGASLTD4% ₹340 Cr 8,482,024
↑ 156,557 NTPC Ltd (Utilities)
Equity, Since 29 Feb 16 | NTPC4% ₹334 Cr 8,626,448 Shree Cement Ltd (Basic Materials)
Equity, Since 30 Apr 24 | SHREECEM3% ₹270 Cr 106,892
↑ 3,387 Kalpataru Projects International Ltd (Industrials)
Equity, Since 30 Sep 06 | KPIL3% ₹262 Cr 2,005,608 AIA Engineering Ltd (Industrials)
Equity, Since 28 Feb 21 | AIAENG3% ₹258 Cr 572,697 HDFC Bank Ltd (Financial Services)
Equity, Since 31 Jan 22 | HDFCBANK3% ₹250 Cr 3,357,506
↑ 1,057,506 Container Corporation of India Ltd (Industrials)
Equity, Since 31 Jan 16 | CONCOR3% ₹227 Cr 4,885,153 2. LIC MF Infrastructure Fund
LIC MF Infrastructure Fund
Growth Launch Date 29 Feb 08 NAV (15 Jul 26) ₹54.4288 ↑ 0.08 (0.15 %) Net Assets (Cr) ₹1,099 on 31 May 26 Category Equity - Sectoral AMC LIC Mutual Fund Asset Mgmt Co Ltd Rating Risk High Expense Ratio 2.21 Sharpe Ratio 0.26 Information Ratio 0.55 Alpha Ratio 4.51 Min Investment 5,000 Min SIP Investment 1,000 Exit Load 0-1 Years (1%),1 Years and above(NIL) Growth of 10,000 investment over the years.
Date Value 30 Jun 21 ₹10,000 30 Jun 22 ₹11,137 30 Jun 23 ₹14,179 30 Jun 24 ₹26,268 30 Jun 25 ₹26,896 30 Jun 26 ₹29,151 Returns for LIC MF Infrastructure Fund
absolute basis & more than 1 year are on CAGR (Compound Annual Growth Rate) basis. as on 15 Jul 26 Duration Returns 1 Month 2.5% 3 Month 10.2% 6 Month 13.1% 1 Year 8.4% 3 Year 25.4% 5 Year 23% 10 Year 15 Year Since launch 9.7% Historical performance (Yearly) on absolute basis
Year Returns 2024 -3.7% 2023 47.8% 2022 44.4% 2021 7.9% 2020 46.6% 2019 -0.1% 2018 13.3% 2017 -14.6% 2016 42.2% 2015 -2.2% Fund Manager information for LIC MF Infrastructure Fund
Name Since Tenure Sumit Bhatnagar 7 Apr 26 0.23 Yr. Mahesh Bendre 1 Jul 24 2 Yr. Data below for LIC MF Infrastructure Fund as on 31 May 26
Equity Sector Allocation
Sector Value Industrials 37.05% Consumer Cyclical 20.88% Basic Materials 12.42% Utility 11.88% Communication Services 5.02% Financial Services 3.98% Real Estate 1.97% Health Care 1.89% Technology 1.08% Asset Allocation
Asset Class Value Cash 3.82% Equity 96.18% Top Securities Holdings / Portfolio
Name Holding Value Quantity Larsen & Toubro Ltd (Industrials)
Equity, Since 30 Apr 09 | LT4% ₹44 Cr 106,968
↓ -10,884 Garware Hi-Tech Films Ltd (Basic Materials)
Equity, Since 31 Aug 23 | 5006554% ₹40 Cr 65,325
↓ -7,684 Tata Motors Passenger Vehicles Ltd (Consumer Cyclical)
Equity, Since 28 Feb 26 | TMPV4% ₹39 Cr 982,891
↓ -332,760 Tata Motors Ltd (Consumer Cyclical)
Equity, Since 31 Oct 25 | TMCV4% ₹39 Cr 1,015,933
↑ 26,983 Tata Power Co Ltd (Utilities)
Equity, Since 29 Feb 24 | TATAPOWER3% ₹36 Cr 861,040
↑ 524,312 KSH International Ltd (Industrials)
Equity, Since 31 Dec 25 | KSHINTL3% ₹34 Cr 432,816
↑ 6,280 Siemens Energy India Ltd (Utilities)
Equity, Since 31 Aug 25 | ENRIN3% ₹34 Cr 87,106
↑ 24,800 JSW Infrastructure Ltd (Industrials)
Equity, Since 30 Apr 26 | JSWINFRA3% ₹31 Cr 1,133,858
↑ 745,681 Carraro India Ltd (Consumer Cyclical)
Equity, Since 31 Dec 24 | CARRARO3% ₹31 Cr 572,991 Bharat Dynamics Ltd Ordinary Shares (Industrials)
Equity, Since 31 Jan 26 | BDL3% ₹29 Cr 242,954
↑ 157,744 3. SBI PSU Fund
SBI PSU Fund
Growth Launch Date 7 Jul 10 NAV (15 Jul 26) ₹34.4616 ↑ 0.11 (0.31 %) Net Assets (Cr) ₹6,594 on 31 May 26 Category Equity - Sectoral AMC SBI Funds Management Private Limited Rating ☆☆ Risk High Expense Ratio 1.89 Sharpe Ratio 0.26 Information Ratio -0.02 Alpha Ratio 0.16 Min Investment 5,000 Min SIP Investment 500 Exit Load 0-1 Years (1%),1 Years and above(NIL) Growth of 10,000 investment over the years.
Date Value 30 Jun 21 ₹10,000 30 Jun 22 ₹9,973 30 Jun 23 ₹13,609 30 Jun 24 ₹26,792 30 Jun 25 ₹26,602 30 Jun 26 ₹28,255 Returns for SBI PSU Fund
absolute basis & more than 1 year are on CAGR (Compound Annual Growth Rate) basis. as on 15 Jul 26 Duration Returns 1 Month -0.8% 3 Month -2.2% 6 Month 0.3% 1 Year 6.7% 3 Year 25.5% 5 Year 22.9% 10 Year 15 Year Since launch 8% Historical performance (Yearly) on absolute basis
Year Returns 2024 11.3% 2023 23.5% 2022 54% 2021 29% 2020 32.4% 2019 -10% 2018 6% 2017 -23.8% 2016 21.9% 2015 16.2% Fund Manager information for SBI PSU Fund
Name Since Tenure Rohit Shimpi 1 Jun 24 2.08 Yr. Data below for SBI PSU Fund as on 31 May 26
Equity Sector Allocation
Sector Value Financial Services 32.54% Utility 31.22% Industrials 14.07% Energy 11.97% Basic Materials 6.94% Asset Allocation
Asset Class Value Cash 3.18% Equity 96.74% Debt 0.07% Top Securities Holdings / Portfolio
Name Holding Value Quantity State Bank of India (Financial Services)
Equity, Since 31 Jul 10 | SBIN17% ₹1,112 Cr 11,527,500
↑ 1,000,000 GAIL (India) Ltd (Utilities)
Equity, Since 31 May 24 | GAIL10% ₹628 Cr 38,150,000 NTPC Ltd (Utilities)
Equity, Since 31 Jul 10 | NTPC9% ₹597 Cr 15,443,244 Bharat Electronics Ltd (Industrials)
Equity, Since 30 Jun 24 | BEL9% ₹583 Cr 14,185,000
↑ 800,000 Power Grid Corp Of India Ltd (Utilities)
Equity, Since 31 Jul 10 | POWERGRID9% ₹579 Cr 19,935,554 Oil & Natural Gas Corp Ltd (Energy)
Equity, Since 31 May 20 | ONGC6% ₹389 Cr 14,655,000 Bank of Baroda (Financial Services)
Equity, Since 31 Aug 24 | BANKBARODA5% ₹352 Cr 13,100,000 Bharat Petroleum Corp Ltd (Energy)
Equity, Since 31 Aug 24 | BPCL4% ₹289 Cr 9,700,000 Bharat Heavy Electricals Ltd (Industrials)
Equity, Since 30 Jun 25 | BHEL4% ₹271 Cr 6,500,000 NMDC Ltd (Basic Materials)
Equity, Since 31 Oct 23 | NMDC4% ₹245 Cr 27,900,000 4. SBI Gold Fund
SBI Gold Fund
Growth Launch Date 12 Sep 11 NAV (15 Jul 26) ₹41.0269 ↑ 0.16 (0.40 %) Net Assets (Cr) ₹16,533 on 31 May 26 Category Gold - Gold AMC SBI Funds Management Private Limited Rating ☆☆ Risk Moderately High Expense Ratio 0.3 Sharpe Ratio 1.93 Information Ratio 0 Alpha Ratio 0 Min Investment 5,000 Min SIP Investment 500 Exit Load 0-1 Years (1%),1 Years and above(NIL) Growth of 10,000 investment over the years.
Date Value 30 Jun 21 ₹10,000 30 Jun 22 ₹10,828 30 Jun 23 ₹12,154 30 Jun 24 ₹14,949 30 Jun 25 ₹19,644 30 Jun 26 ₹28,455 Returns for SBI Gold Fund
absolute basis & more than 1 year are on CAGR (Compound Annual Growth Rate) basis. as on 15 Jul 26 Duration Returns 1 Month -4.9% 3 Month -6.3% 6 Month -2% 1 Year 41.3% 3 Year 31.7% 5 Year 22.5% 10 Year 15 Year Since launch 10% Historical performance (Yearly) on absolute basis
Year Returns 2024 71.5% 2023 19.6% 2022 14.1% 2021 12.6% 2020 -5.7% 2019 27.4% 2018 22.8% 2017 6.4% 2016 3.5% 2015 10% Fund Manager information for SBI Gold Fund
Name Since Tenure Viral Chhadva 1 Mar 26 0.33 Yr. Data below for SBI Gold Fund as on 31 May 26
Asset Allocation
Asset Class Value Cash 1.64% Other 98.36% Top Securities Holdings / Portfolio
Name Holding Value Quantity SBI Gold ETF
- | -100% ₹16,542 Cr 1,246,686,194
↑ 13,950,000 Net Receivable / Payable
CBLO | -0% -₹55 Cr Treps
CBLO/Reverse Repo | -0% ₹45 Cr 5. IDBI Gold Fund
IDBI Gold Fund
Growth Launch Date 14 Aug 12 NAV (15 Jul 26) ₹36.3178 ↑ 0.06 (0.16 %) Net Assets (Cr) ₹824 on 31 May 26 Category Gold - Gold AMC IDBI Asset Management Limited Rating Risk Moderately High Expense Ratio 0.64 Sharpe Ratio 1.82 Information Ratio 0 Alpha Ratio 0 Min Investment 5,000 Min SIP Investment 500 Exit Load 0-12 Months (1%),12 Months and above(NIL) Growth of 10,000 investment over the years.
Date Value 30 Jun 21 ₹10,000 30 Jun 22 ₹10,739 30 Jun 23 ₹12,175 30 Jun 24 ₹14,979 30 Jun 25 ₹19,637 30 Jun 26 ₹28,198 Returns for IDBI Gold Fund
absolute basis & more than 1 year are on CAGR (Compound Annual Growth Rate) basis. as on 15 Jul 26 Duration Returns 1 Month -4.7% 3 Month -5.8% 6 Month -4.1% 1 Year 40.4% 3 Year 31.5% 5 Year 22.5% 10 Year 15 Year Since launch 9.7% Historical performance (Yearly) on absolute basis
Year Returns 2024 79% 2023 18.7% 2022 14.8% 2021 12% 2020 -4% 2019 24.2% 2018 21.6% 2017 5.8% 2016 1.4% 2015 8.3% Fund Manager information for IDBI Gold Fund
Name Since Tenure Sumit Bhatnagar 1 Jun 24 2.08 Yr. Data below for IDBI Gold Fund as on 31 May 26
Asset Allocation
Asset Class Value Cash 1.65% Other 98.35% Top Securities Holdings / Portfolio
Name Holding Value Quantity LIC MF Gold ETF
- | -100% ₹823 Cr 58,774,200
↑ 705,000 Treps
CBLO/Reverse Repo | -0% ₹3 Cr Net Receivables / (Payables)
CBLO | -0% -₹2 Cr
مزید کسی بھی سوال کی صورت میں، آپ ہم سے 8451864111 پر کسی بھی کام کے دن صبح 9.30 بجے سے شام 6.30 بجے کے درمیان رابطہ کر سکتے ہیں یا ہمیں کسی بھی وقت ای میل لکھ سکتے ہیں۔support@fincash.com یا ہماری ویب سائٹ پر لاگ ان کرکے ہمارے ساتھ بات چیت کریں۔www.fincash.com.
یہاں فراہم کردہ معلومات کے درست ہونے کو یقینی بنانے کے لیے تمام کوششیں کی گئی ہیں۔ تاہم، ڈیٹا کی درستگی کے حوالے سے کوئی ضمانت نہیں دی جاتی ہے۔ براہ کرم کوئی بھی سرمایہ کاری کرنے سے پہلے اسکیم کی معلومات کے دستاویز کے ساتھ تصدیق کریں۔
")


AMFI Registration No. 112358 | CIN: U74999MH2016PTC282153
Shepard Technologies Pvt. Ltd. (with ARN code 112358) makes no warranties or representations, express or implied, on products offered through the platform. It accepts no liability for any damages or losses, however caused, in connection with the use of, or on the reliance of its product or related services. Terms and conditions of the website are applicable.
©2026 Shepard Technologies Private Limited. All Rights Reserved
Research Highlights for ICICI Prudential Infrastructure Fund