Financial Statement Definition
Financial statements are the documents written to describe a company's operations and financial performance. Government authorities, accountants, corporations, and others frequently audit financial statements to verify accuracy, financing, tax and Investing purposes. The balance sheet, income statement, and cash flow statement are the three crucial financial statements.

These are closely entwined, and this guide will show you how they all co-relate.
Three Financial Statement
1. Income Statement
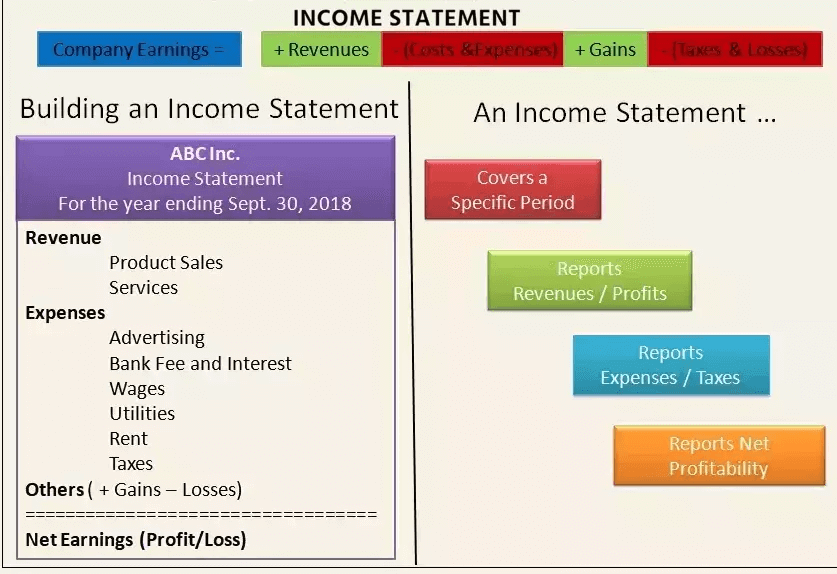
The Income Statement is the first thing an investor or analyst looks at. It mainly depicts the company's performance through time, with revenue at the top. After that, the statement subtracts the Cost Of Goods Sold (COGS) to arrive at gross profit. Then, based on the nature of the firm, other operating expenses and revenues, it alters the gross profit, resulting in net earnings at the bottom - the company's "bottom line."
Features
- Displays a company's revenue and expenses
- Expressed for a period (i.e., one year, one quarter, Year-to-Date, etc.)
- To depict figures, it employs Accounting principles like matching and Accruals (not available on a cash basis)
- Figures out the profitable of a business
Talk to our investment specialist
2. Balance Sheet
The balance sheet shows the liabilities, assets, and shareholders' equity of a corporation at a certain point in time. Assets must equal obligations plus equity, as is well recognized. The cash and equivalents part of the asset section should equal the sum found at the end of the cash flow statement. The balance statement then shows how each primary account has changed from one period to the next. Finally, the income statement's net revenue is transferred to the balance sheet to change retained profits (adjusted for payment of dividends).
Features
- Depicts a company's financial situation
- Represented as a "snapshot" or financial image of the company at a specific period in time (i.e., as of December 31, 2017)
- Three sections present: assets, liabilities, and equity held by shareholders
- Liabilities + Shareholders Equity = Assets
3. Cash Flow Statement
After that, the cash flow statement adjusts net income for any non-cash expenses. The usage and receipt of cash are then determined using changes in the balance sheet. Finally, the cash flow statement shows the movement in cash from one period to the next and the beginning and ending cash balances.
Features
- Depicts the changes in cash
- Represented in an accounting period (i.e., one year, one quarter, Year-to-Date, etc.)
- Accounting concepts overturned to demonstrate pure cash transactions
- Three sections: Cash from operations, cash utilized in investment, and cash from borrowing
- Represents the net change in the cash balance from beginning to the end of the period
How are Three Financial Statements Used?
Each of these financial statements has a vital role. For example, economic models employ trends in the relationship of information inside these statements and the movement between periods in past data to anticipate future performance.
This information's preparation and presentation might be pretty tricky. In general, though, the procedures for creating a financial model are as follows.
- Each of the fundamental statements has its collection of line items. It establishes the overall structure and skeleton for the financial model.
- Each of the line items has a historical number.
- At this point, the model's author will frequently double-check that each of the fundamental claims agrees with the data in the other. For example, the cash flow statement ending balance of cash must equal the cash account on the balance sheet.
- Inside the sheet, an assumptions section is constructed to examine the trend in each item of the core statements over time.
- The predicted assumptions for the same line items are created using assumptions derived from known historical data.
- The forecasted assumptions will be used to create values for each line item in the forecasted section of each core statement. The populated numbers should match previous patterns because the analyst or user studied past trends when developing the projected assumptions.
- More complex line items are calculated using supporting schedules. Like, the debt schedule is used to compute interest costs and debt balances. Depreciation expense and the long-term fixed assets' balances are calculated using the amortization schedule. The three primary statements will be based on these values.
All efforts have been made to ensure the information provided here is accurate. However, no guarantees are made regarding correctness of data. Please verify with scheme information document before making any investment.
