What is On-balance Volume?
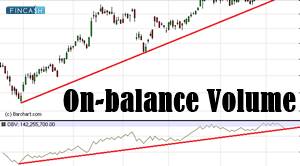
Launched by Joseph Granville, the on-balance volume is one of the popular technical indicators that is used to predict the changes in the stock Market based on the flow of volume. The chart features the on-balance volume line that could go up, down, and sideways. Basically, it is represented in the zig-zag form, giving the investors the bullish and bearish stock market signals.
The on-balance volume of the OBV line emerged when computers and modern technology was not used for analyzing the stock market or tracking the changes in this Industry. The calculation of the stock prices with the on-balance method is quite simple. A random number is used to start the OBV line. The volume of the stock when it closes higher is added to the on-balance volume line, while the same is subtracted when the stock closes lower. Let’s understand this with an example.
Example
Suppose the stock price of the company increases from INR 300 to 400 in 24 hours. The company managed to sell 1 Lakh shares worth INR 400 on this day. The price of the shares gets back to INR 300 the next day. However, the company sold only 50,000 shares (half the shares it managed to trade the other day).
Despite ending up at the same price it started with, the on-balance volume line will grow by 50,000 due to the differences between the trading volume on the first and second day. If a similar trading pattern occurred for the next few days with the stock price remaining the same, the on-balance volume line would increase. According to Granville, this pattern is quite bullish. Sooner or later, the hidden stock prices will rise again and the price of the commodity will be reduced.
Talk to our investment specialist
Understanding OBV Lines
Usually, technical indicators are not that reliable since they work on facts. The indicators make predictions based on the patterns that have occurred. The on-balance line happens to be one of the few tools that can predict the changes in the stock price easily. The theory proposed by Joe Granville indicates that the OBV line rises when the volume of shares traded during an uptrend is higher as compared to the trading volume during a downtrend.
In order to draw the OBV line or calculate the on-balance volume of a security, you are supposed to know the connection between the closing prices of the shares on two consecutive trading days. Even though the OBV line is drawn on the price chart and is calculated numerically, the real quantitative value of the volume does not seem to be significant.
The starting line of the OBV relies completely on the starting date. Usually, the OBV line is used by researchers and analysts to see a pattern in the volume of the trade. It helps them predict the future prices of the shares. The slope of this line is enough to give you insights into the share market prices. This quantitative data is also used to track institutional investors.
All efforts have been made to ensure the information provided here is accurate. However, no guarantees are made regarding correctness of data. Please verify with scheme information document before making any investment.


AMFI Registration No. 112358 | CIN: U74999MH2016PTC282153
Shepard Technologies Pvt. Ltd. (with ARN code 112358) makes no warranties or representations, express or implied, on products offered through the platform. It accepts no liability for any damages or losses, however caused, in connection with the use of, or on the reliance of its product or related services. Terms and conditions of the website are applicable.
©2026 Shepard Technologies Private Limited. All Rights Reserved