
 +91-22-48913909
निवेश के लिए सर्वश्रेष्ठ निफ्टी इंडेक्स म्यूचुअल फंड 2022 - 2023
गंधाइंडेक्स फंड्स यह आपकी जानकारी के लिए हैम्यूचुअल फंड स्कीमें जिनके पोर्टफोलियो का निर्माण निफ्टी को इंडेक्स के रूप में करते हुए किया गया है। वे इंडेक्स फंड का एक हिस्सा हैं जो एक निष्क्रिय रणनीति का पालन करते हैं जिसमें; उनके पोर्टफोलियो का निर्माण एक बेंचमार्क का उपयोग करके किया गया है। निफ्टी फंड होने के नाते ये योजनाएं अपने पोर्टफोलियो के निर्माण के लिए एनएसई निफ्टी को बेंचमार्क के रूप में उपयोग करती हैं। इन योजनाओं का प्रदर्शन कंपनी के प्रदर्शन पर निर्भर करता हैआधारभूत अनुक्रमणिका। इन योजनाओं की पोर्टफोलियो संरचना इंडेक्स के पोर्टफोलियो के समान है। निफ्टी इंडेक्स फंड का प्रदर्शन निफ्टी के प्रदर्शन पर निर्भर करेगा। आइए एक उदाहरण के साथ इंडेक्स फंड के बारे में अधिक स्पष्ट समझ लें।
चित्रण:
यदि निफ्टी इंडेक्स में टाटा ऑटोमोबाइल्स के शेयरों का अनुपात 20% है तो; निफ्टी इंडेक्स फंड भी अपने फंड का 20% टाटा ऑटोमोबाइल्स के शेयरों में आवंटित करेंगे।

Talk to our investment specialist
टॉप 10 बेस्ट परफॉर्मिंग निफ्टी इंडेक्स फंड्स 2022
(Erstwhile ICICI Prudential Nifty Index Fund) An open-ended index linked growth scheme seeking to track the returns of the S&P CNX Nifty index through investment in a basket of stocks drawn from the constituents of the Nifty. Below is the key information for ICICI Prudential Nifty Index Fund Returns up to 1 year are on The scheme will adopt a passive investment strategy. The scheme will
invest in stocks comprising the Nifty 50 Index in the same proportion as in the
index with the objective of achieving returns equivalent to the Total Returns
Index of Nifty 50 Index by minimizing the performance difference between the
benchmark index and the scheme. The Total Returns Index is an index that
reflects the returns on the index from index gain/loss plus dividend payments
by the constituent stocks. Research Highlights for SBI Nifty Index Fund Below is the key information for SBI Nifty Index Fund Returns up to 1 year are on The investment objective of the scheme is to replicate the Nifty 50 by investing in securities of the Nifty 50 in the same proportion / weightage. However, there is no assurance or guarantee that the objectives of the scheme will be realized
and the scheme does not assure or guarantee any returns . Research Highlights for Bandhan Nifty Fund Below is the key information for Bandhan Nifty Fund Returns up to 1 year are on The investment objective of the scheme is to invest in the stocks and equity related instruments comprising the S&P CNX Nifty Index in the same weights as these stocks represented in the Index with the intent to replicate the performance of the Total Returns Index of S&P CNX Nifty index. The scheme will adopt a passive investment strategy and will seek to achieve the investment objective by minimizing the tracking error between the S&P CNX Nifty index (Total Returns Index) and the scheme. Research Highlights for IDBI Nifty Index Fund Below is the key information for IDBI Nifty Index Fund Returns up to 1 year are on The principal investment objective of the scheme is to invest in stocks of companies comprising Nifty 50 Index and endeavour to achieve return equivalent to Nifty 50 by “passive” investment. The scheme will be managed
by replicating the index in the same weightage as in the Nifty 50 Index with the intention of minimising the performance differences between the scheme and the Nifty 50 Index in capital terms, subject to market liquidity, costs of trading, management expenses and other factors which may cause tracking error. The
scheme would alter the scrips/weights as and when the same are altered in the Nifty 50 Index. Research Highlights for UTI Nifty Index Fund Below is the key information for UTI Nifty Index Fund Returns up to 1 year are on The Investment Objective of the Scheme is to invest in companies whose securities are included in the Nifty and subject to tracking errors, endeavouring to attain results commensurate with the Nifty 50 under NSENifty Plan Research Highlights for Franklin India Index Fund Nifty Plan Below is the key information for Franklin India Index Fund Nifty Plan Returns up to 1 year are on The fund's objective is to invest in companies whose securities are included in Nifty Junior Index and to endeavor to achieve the returns of the above index as closely as possible, though subject to tracking error. The fund intends to track only 90-95% of the Index i.e. it will always keep cash balance between 5-10% of the Net Asset to meet the redemption and other liquidity requirements. However, as and when the liquidity in the Index improves the fund intends to track up to 100% of the Index. The fund will not seek to outperform the CNX Nifty Junior. The objective is that the performance of the NAV of the fund should closely track the performance of the CNX Nifty Junior over the same period subject to tracking error. Research Highlights for ICICI Prudential Nifty Next 50 Index Fund Below is the key information for ICICI Prudential Nifty Next 50 Index Fund Returns up to 1 year are on The investment objective of the scheme is to invest in the stocks and equity related instruments comprising the CNX Nifty Junior Index in the same weights as these stocks represented in the Index with the intent to replicate the performance of the Total Returns Index of CNX Nifty Junior Index. The scheme will adopt a passive investment strategy and will seek to achieve the investment objective by minimizing the tracking error between the CNX Nifty Junior Index (Total Returns Index) and the scheme. Research Highlights for IDBI Nifty Junior Index Fund Below is the key information for IDBI Nifty Junior Index Fund Returns up to 1 year are on The main investment objective of the fund is to generate returns commensurate with the performance of the index either Nifty / Sensex based on the plans by investing in the respective index stocks subject to tracking errors. Research Highlights for LIC MF Index Fund Nifty Below is the key information for LIC MF Index Fund Nifty Returns up to 1 year are on The primary investment objective of the scheme is to replicate the composition of the Nifty 50, with a view to generate returns that are commensurate with the
performance of the Nifty 50, subject to tracking errors. Research Highlights for Nippon India Index Fund - Nifty Plan Below is the key information for Nippon India Index Fund - Nifty Plan Returns up to 1 year are on Fund NAV Net Assets (Cr) 3 MO (%) 6 MO (%) 1 YR (%) 3 YR (%) 5 YR (%) 2025 (%) ICICI Prudential Nifty Index Fund Growth ₹229.085
↓ -0.87 ₹16,311 -5.2 -5.9 -12.1 6.2 5.3 11.4 SBI Nifty Index Fund Growth ₹201.107
↓ -0.76 ₹13,190 -5.2 -5.9 -12.2 6.1 5.2 11.3 Bandhan Nifty Fund Growth ₹48.886
↓ -0.19 ₹2,671 -5.2 -6 -12.3 5.9 5.1 11.2 IDBI Nifty Index Fund Growth ₹36.2111
↓ -0.02 ₹208 9.1 11.9 16.2 20.3 11.7 UTI Nifty Index Fund Growth ₹156.734
↓ -0.59 ₹28,064 -5.2 -5.8 -12 6.3 5.4 11.6 Franklin India Index Fund Nifty Plan Growth ₹183.376
↓ -0.69 ₹654 -5.2 -6 -12.2 6 5.1 11.3 ICICI Prudential Nifty Next 50 Index Fund Growth ₹57.8694
↓ -1.33 ₹9,744 -8.3 -6.5 -5.1 14.6 9.2 2.1 IDBI Nifty Junior Index Fund Growth ₹49.0147
↓ -1.12 ₹109 -8.2 -6.1 -4.8 14.6 9.2 2 LIC MF Index Fund Nifty Growth ₹124.911
↓ -0.48 ₹345 -5.3 -6.2 -12.7 5.5 4.6 10.7 Nippon India Index Fund - Nifty Plan Growth ₹38.6148
↓ -0.15 ₹3,461 -5.2 -5.9 -12.1 6.1 5.1 11.4 Note: Returns up to 1 year are on absolute basis & more than 1 year are on CAGR basis. as on 23 Oct 26 Research Highlights & Commentary of 10 Funds showcased
Commentary ICICI Prudential Nifty Index Fund SBI Nifty Index Fund Bandhan Nifty Fund IDBI Nifty Index Fund UTI Nifty Index Fund Franklin India Index Fund Nifty Plan ICICI Prudential Nifty Next 50 Index Fund IDBI Nifty Junior Index Fund LIC MF Index Fund Nifty Nippon India Index Fund - Nifty Plan Point 1 Top quartile AUM (₹16,311 Cr). Upper mid AUM (₹13,190 Cr). Lower mid AUM (₹2,671 Cr). Bottom quartile AUM (₹208 Cr). Highest AUM (₹28,064 Cr). Lower mid AUM (₹654 Cr). Upper mid AUM (₹9,744 Cr). Bottom quartile AUM (₹109 Cr). Bottom quartile AUM (₹345 Cr). Upper mid AUM (₹3,461 Cr). Point 2 Established history (24+ yrs). Established history (24+ yrs). Established history (16+ yrs). Established history (16+ yrs). Oldest track record among peers (26 yrs). Established history (26+ yrs). Established history (16+ yrs). Established history (16+ yrs). Established history (23+ yrs). Established history (16+ yrs). Point 3 Rating: 2★ (upper mid). Rating: 1★ (lower mid). Rating: 2★ (upper mid). Rating: 1★ (lower mid). Rating: 2★ (upper mid). Rating: 1★ (bottom quartile). Top rated. Rating: 5★ (top quartile). Rating: 1★ (bottom quartile). Rating: 1★ (bottom quartile). Point 4 Risk profile: Moderately High. Risk profile: Moderately High. Risk profile: Moderately High. Risk profile: Moderately High. Risk profile: Moderately High. Risk profile: Moderately High. Risk profile: Moderately High. Risk profile: Moderately High. Risk profile: Moderately High. Risk profile: Moderately High. Point 5 5Y return: 5.30% (upper mid). 5Y return: 5.21% (lower mid). 5Y return: 5.12% (lower mid). 5Y return: 11.74% (top quartile). 5Y return: 5.41% (upper mid). 5Y return: 5.09% (bottom quartile). 5Y return: 9.24% (top quartile). 5Y return: 9.22% (upper mid). 5Y return: 4.63% (bottom quartile). 5Y return: 5.07% (bottom quartile). Point 6 3Y return: 6.22% (upper mid). 3Y return: 6.14% (lower mid). 3Y return: 5.94% (bottom quartile). 3Y return: 20.28% (top quartile). 3Y return: 6.32% (upper mid). 3Y return: 6.04% (bottom quartile). 3Y return: 14.63% (top quartile). 3Y return: 14.63% (upper mid). 3Y return: 5.54% (bottom quartile). 3Y return: 6.12% (lower mid). Point 7 1Y return: -12.12% (upper mid). 1Y return: -12.16% (lower mid). 1Y return: -12.33% (bottom quartile). 1Y return: 16.16% (top quartile). 1Y return: -12.02% (upper mid). 1Y return: -12.22% (bottom quartile). 1Y return: -5.11% (upper mid). 1Y return: -4.80% (top quartile). 1Y return: -12.66% (bottom quartile). 1Y return: -12.14% (lower mid). Point 8 1M return: -3.62% (upper mid). 1M return: -3.62% (upper mid). 1M return: -3.63% (bottom quartile). 1M return: 3.68% (top quartile). 1M return: -3.61% (upper mid). 1M return: -3.58% (top quartile). 1M return: -9.18% (bottom quartile). 1M return: -9.18% (bottom quartile). 1M return: -3.62% (lower mid). 1M return: -3.62% (lower mid). Point 9 Alpha: -0.44 (top quartile). Alpha: -0.47 (upper mid). Alpha: -0.66 (lower mid). Alpha: -1.03 (bottom quartile). Alpha: -0.29 (top quartile). Alpha: -0.58 (upper mid). Alpha: -0.87 (bottom quartile). Alpha: -0.58 (lower mid). Alpha: -1.11 (bottom quartile). Alpha: -0.46 (upper mid). Point 10 Sharpe: -0.70 (upper mid). Sharpe: -0.70 (lower mid). Sharpe: -0.71 (bottom quartile). Sharpe: 1.04 (top quartile). Sharpe: -0.69 (upper mid). Sharpe: -0.70 (bottom quartile). Sharpe: -0.01 (upper mid). Sharpe: 0.00 (top quartile). Sharpe: -0.74 (bottom quartile). Sharpe: -0.70 (lower mid). ICICI Prudential Nifty Index Fund
SBI Nifty Index Fund
Bandhan Nifty Fund
IDBI Nifty Index Fund
UTI Nifty Index Fund
Franklin India Index Fund Nifty Plan
ICICI Prudential Nifty Next 50 Index Fund
IDBI Nifty Junior Index Fund
LIC MF Index Fund Nifty
Nippon India Index Fund - Nifty Plan
1. ICICI Prudential Nifty Index Fund
ICICI Prudential Nifty Index Fund
Growth Launch Date 26 Feb 02 NAV (23 Oct 26) ₹229.085 ↓ -0.87 (-0.38 %) Net Assets (Cr) ₹16,311 on 30 Sep 26 Category Others - Index Fund AMC ICICI Prudential Asset Management Company Limited Rating ☆☆ Risk Moderately High Expense Ratio 0.36 Sharpe Ratio -0.7 Information Ratio -9.02 Alpha Ratio -0.44 Min Investment 5,000 Min SIP Investment 100 Exit Load NIL Growth of 10,000 investment over the years.
Date Value 30 Sep 21 ₹10,000 30 Sep 22 ₹9,790 30 Sep 23 ₹11,312 30 Sep 24 ₹14,976 30 Sep 25 ₹14,399 30 Sep 26 ₹13,323 Returns for ICICI Prudential Nifty Index Fund
absolute basis & more than 1 year are on CAGR (Compound Annual Growth Rate) basis. as on 23 Oct 26 Duration Returns 1 Month -3.6% 3 Month -5.2% 6 Month -5.9% 1 Year -12.1% 3 Year 6.2% 5 Year 5.3% 10 Year 15 Year Since launch 13.5% Historical performance (Yearly) on absolute basis
Year Returns 2025 11.4% 2024 9.6% 2023 20.7% 2022 5.2% 2021 24.9% 2020 15.2% 2019 12.8% 2018 3.4% 2017 28.7% 2016 3.6% Fund Manager information for ICICI Prudential Nifty Index Fund
Name Since Tenure Nishit Patel 18 Jan 21 5.62 Yr. Ajaykumar Solanki 1 Feb 24 2.58 Yr. Ashwini Bharucha 18 Dec 24 1.7 Yr. Venus Ahuja 1 Nov 25 0.83 Yr. Data below for ICICI Prudential Nifty Index Fund as on 30 Sep 26
Asset Allocation
Asset Class Value Cash 0.04% Equity 99.96% Top Securities Holdings / Portfolio
Name Holding Value Quantity HDFC Bank Ltd (Financial Services)
Equity, Since 31 Mar 05 | HDFCBANK10% ₹1,699 Cr 23,965,268
↑ 230,065 ICICI Bank Ltd (Financial Services)
Equity, Since 31 Mar 05 | ICICIBANK9% ₹1,630 Cr 11,211,199
↑ 107,629 Reliance Industries Ltd (Energy)
Equity, Since 31 Mar 05 | RELIANCE8% ₹1,350 Cr 10,572,602
↑ 101,499 Bharti Airtel Ltd (Communication Services)
Equity, Since 31 Aug 09 | BHARTIARTL5% ₹862 Cr 4,758,963
↑ 45,693 Larsen & Toubro Ltd (Industrials)
Equity, Since 29 Feb 12 | LT4% ₹741 Cr 1,831,740
↑ 17,593 State Bank of India (Financial Services)
Equity, Since 31 Mar 05 | SBIN4% ₹686 Cr 6,468,862
↑ 62,103 Infosys Ltd (Technology)
Equity, Since 31 Mar 05 | INFY4% ₹622 Cr 5,489,256
↑ 52,703 Axis Bank Ltd (Financial Services)
Equity, Since 31 Mar 09 | 5322153% ₹584 Cr 4,494,554
↑ 43,154 Kotak Mahindra Bank Ltd (Financial Services)
Equity, Since 29 Feb 12 | KOTAKBANK3% ₹483 Cr 11,522,374
↑ 110,616 Mahindra & Mahindra Ltd (Consumer Cyclical)
Equity, Since 31 Mar 05 | M&M3% ₹459 Cr 1,397,202
↑ 13,420 2. SBI Nifty Index Fund
SBI Nifty Index Fund
Growth Launch Date 17 Jan 02 NAV (23 Oct 26) ₹201.107 ↓ -0.76 (-0.38 %) Net Assets (Cr) ₹13,190 on 30 Sep 26 Category Others - Index Fund AMC SBI Funds Management Private Limited Rating ☆ Risk Moderately High Expense Ratio 0.41 Sharpe Ratio -0.7 Information Ratio -24.94 Alpha Ratio -0.47 Min Investment 5,000 Min SIP Investment 500 Exit Load 0-15 Days (0.2%),15 Days and above(NIL) Growth of 10,000 investment over the years.
Date Value 30 Sep 21 ₹10,000 30 Sep 22 ₹9,779 30 Sep 23 ₹11,291 30 Sep 24 ₹14,931 30 Sep 25 ₹14,344 30 Sep 26 ₹13,266 Returns for SBI Nifty Index Fund
absolute basis & more than 1 year are on CAGR (Compound Annual Growth Rate) basis. as on 23 Oct 26 Duration Returns 1 Month -3.6% 3 Month -5.2% 6 Month -5.9% 1 Year -12.2% 3 Year 6.1% 5 Year 5.2% 10 Year 15 Year Since launch 13.1% Historical performance (Yearly) on absolute basis
Year Returns 2025 11.3% 2024 9.5% 2023 20.7% 2022 5.1% 2021 24.7% 2020 14.6% 2019 12.5% 2018 3.8% 2017 29.1% 2016 3.4% Fund Manager information for SBI Nifty Index Fund
Name Since Tenure Viral Chhadva 1 Mar 26 0.5 Yr. Data below for SBI Nifty Index Fund as on 30 Sep 26
Asset Allocation
Asset Class Value Equity 100.04% Top Securities Holdings / Portfolio
Name Holding Value Quantity HDFC Bank Ltd (Financial Services)
Equity, Since 31 Mar 03 | HDFCBANK10% ₹1,372 Cr 19,357,662
↑ 66,631 ICICI Bank Ltd (Financial Services)
Equity, Since 31 Jan 03 | ICICIBANK9% ₹1,317 Cr 9,055,715
↑ 31,171 Reliance Industries Ltd (Energy)
Equity, Since 31 Jan 03 | RELIANCE8% ₹1,091 Cr 8,539,895
↑ 29,397 Bharti Airtel Ltd (Communication Services)
Equity, Since 29 Feb 04 | BHARTIARTL5% ₹696 Cr 3,843,997
↑ 13,232 Larsen & Toubro Ltd (Industrials)
Equity, Since 31 Dec 04 | LT4% ₹598 Cr 1,479,567
↑ 5,093 State Bank of India (Financial Services)
Equity, Since 31 Jan 03 | SBIN4% ₹554 Cr 5,225,148
↑ 17,985 Infosys Ltd (Technology)
Equity, Since 31 Jan 03 | INFY4% ₹503 Cr 4,433,881
↑ 15,261 Axis Bank Ltd (Financial Services)
Equity, Since 28 Feb 10 | 5322153% ₹472 Cr 3,630,420
↑ 12,495 Kotak Mahindra Bank Ltd (Financial Services)
Equity, Since 31 Mar 12 | KOTAKBANK3% ₹390 Cr 9,307,060
↑ 32,035 Mahindra & Mahindra Ltd (Consumer Cyclical)
Equity, Since 30 Jun 10 | M&M3% ₹370 Cr 1,128,575
↑ 3,885 3. Bandhan Nifty Fund
Bandhan Nifty Fund
Growth Launch Date 30 Apr 10 NAV (23 Oct 26) ₹48.886 ↓ -0.19 (-0.38 %) Net Assets (Cr) ₹2,671 on 30 Sep 26 Category Others - Index Fund AMC IDFC Asset Management Company Limited Rating ☆☆ Risk Moderately High Expense Ratio 0.6 Sharpe Ratio -0.71 Information Ratio -12.57 Alpha Ratio -0.66 Min Investment 100 Min SIP Investment 1,000 Exit Load 0-7 Days (1%),7 Days and above(NIL) Growth of 10,000 investment over the years.
Date Value 30 Sep 21 ₹10,000 30 Sep 22 ₹9,804 30 Sep 23 ₹11,303 30 Sep 24 ₹14,921 30 Sep 25 ₹14,309 30 Sep 26 ₹13,208 Returns for Bandhan Nifty Fund
absolute basis & more than 1 year are on CAGR (Compound Annual Growth Rate) basis. as on 23 Oct 26 Duration Returns 1 Month -3.6% 3 Month -5.2% 6 Month -6% 1 Year -12.3% 3 Year 5.9% 5 Year 5.1% 10 Year 15 Year Since launch 10.1% Historical performance (Yearly) on absolute basis
Year Returns 2025 11.2% 2024 9.2% 2023 20.5% 2022 5.4% 2021 24.4% 2020 16.2% 2019 12.9% 2018 4.4% 2017 29.5% 2016 3.9% Fund Manager information for Bandhan Nifty Fund
Name Since Tenure Abhishek Jain 8 Mar 25 1.48 Yr. Mayuresh Nagvekar 17 Feb 26 0.54 Yr. Data below for Bandhan Nifty Fund as on 30 Sep 26
Asset Allocation
Asset Class Value Cash 0.13% Equity 99.87% Top Securities Holdings / Portfolio
Name Holding Value Quantity HDFC Bank Ltd (Financial Services)
Equity, Since 30 Apr 10 | HDFCBANK10% ₹277 Cr 3,904,246
↑ 78,212 ICICI Bank Ltd (Financial Services)
Equity, Since 30 Apr 10 | ICICIBANK9% ₹266 Cr 1,826,447
↑ 36,589 Reliance Industries Ltd (Energy)
Equity, Since 30 Apr 10 | RELIANCE8% ₹220 Cr 1,722,411
↑ 34,504 Bharti Airtel Ltd (Communication Services)
Equity, Since 30 Apr 10 | BHARTIARTL5% ₹140 Cr 775,295
↑ 15,531 Larsen & Toubro Ltd (Industrials)
Equity, Since 29 Feb 12 | LT4% ₹121 Cr 298,414
↑ 5,978 State Bank of India (Financial Services)
Equity, Since 31 Aug 11 | SBIN4% ₹112 Cr 1,053,860
↑ 21,111 Infosys Ltd (Technology)
Equity, Since 30 Apr 10 | INFY4% ₹101 Cr 894,269
↑ 17,914 Axis Bank Ltd (Financial Services)
Equity, Since 30 Apr 10 | 5322153% ₹95 Cr 732,220
↑ 14,668 Kotak Mahindra Bank Ltd (Financial Services)
Equity, Since 31 Mar 12 | KOTAKBANK3% ₹79 Cr 1,877,141
↑ 37,604 Mahindra & Mahindra Ltd (Consumer Cyclical)
Equity, Since 31 Jan 11 | M&M3% ₹75 Cr 227,622
↑ 4,560 4. IDBI Nifty Index Fund
IDBI Nifty Index Fund
Growth Launch Date 25 Jun 10 NAV (28 Jul 23) ₹36.2111 ↓ -0.02 (-0.06 %) Net Assets (Cr) ₹208 on 30 Jun 23 Category Others - Index Fund AMC IDBI Asset Management Limited Rating ☆ Risk Moderately High Expense Ratio 0.9 Sharpe Ratio 1.04 Information Ratio -3.93 Alpha Ratio -1.03 Min Investment 5,000 Min SIP Investment 500 Exit Load NIL Growth of 10,000 investment over the years.
Date Value Returns for IDBI Nifty Index Fund
absolute basis & more than 1 year are on CAGR (Compound Annual Growth Rate) basis. as on 23 Oct 26 Duration Returns 1 Month 3.7% 3 Month 9.1% 6 Month 11.9% 1 Year 16.2% 3 Year 20.3% 5 Year 11.7% 10 Year 15 Year Since launch 10.3% Historical performance (Yearly) on absolute basis
Year Returns 2025 2024 2023 2022 2021 2020 2019 2018 2017 2016 Fund Manager information for IDBI Nifty Index Fund
Name Since Tenure Data below for IDBI Nifty Index Fund as on 30 Jun 23
Asset Allocation
Asset Class Value Top Securities Holdings / Portfolio
Name Holding Value Quantity 5. UTI Nifty Index Fund
UTI Nifty Index Fund
Growth Launch Date 6 Mar 00 NAV (23 Oct 26) ₹156.734 ↓ -0.59 (-0.38 %) Net Assets (Cr) ₹28,064 on 30 Sep 26 Category Others - Index Fund AMC UTI Asset Management Company Ltd Rating ☆☆ Risk Moderately High Expense Ratio 0.29 Sharpe Ratio -0.69 Information Ratio -10.52 Alpha Ratio -0.29 Min Investment 5,000 Min SIP Investment 500 Exit Load NIL Growth of 10,000 investment over the years.
Date Value 30 Sep 21 ₹10,000 30 Sep 22 ₹9,803 30 Sep 23 ₹11,342 30 Sep 24 ₹15,017 30 Sep 25 ₹14,457 30 Sep 26 ₹13,393 Returns for UTI Nifty Index Fund
absolute basis & more than 1 year are on CAGR (Compound Annual Growth Rate) basis. as on 23 Oct 26 Duration Returns 1 Month -3.6% 3 Month -5.2% 6 Month -5.8% 1 Year -12% 3 Year 6.3% 5 Year 5.4% 10 Year 15 Year Since launch 10.9% Historical performance (Yearly) on absolute basis
Year Returns 2025 11.6% 2024 9.6% 2023 20.9% 2022 5.3% 2021 25.2% 2020 15.5% 2019 13.2% 2018 4.3% 2017 29.7% 2016 4% Fund Manager information for UTI Nifty Index Fund
Name Since Tenure Sharwan Goyal 31 Jul 18 8.09 Yr. Ayush Jain 2 May 22 4.34 Yr. Lokesh Kulthia 19 Jun 26 0.2 Yr. Data below for UTI Nifty Index Fund as on 30 Sep 26
Asset Allocation
Asset Class Value Equity 100% Top Securities Holdings / Portfolio
Name Holding Value Quantity HDFC Bank Ltd (Financial Services)
Equity, Since 31 Jan 10 | HDFCBANK10% ₹2,905 Cr 40,975,419
↑ 466,798 ICICI Bank Ltd (Financial Services)
Equity, Since 31 Jan 03 | ICICIBANK9% ₹2,787 Cr 19,168,725
↑ 218,374 Reliance Industries Ltd (Energy)
Equity, Since 31 Jan 03 | RELIANCE8% ₹2,308 Cr 18,076,860
↑ 205,934 Bharti Airtel Ltd (Communication Services)
Equity, Since 29 Feb 04 | BHARTIARTL5% ₹1,474 Cr 8,136,797
↑ 92,696 Larsen & Toubro Ltd (Industrials)
Equity, Since 31 Dec 04 | LT4% ₹1,267 Cr 3,131,881
↑ 35,679 State Bank of India (Financial Services)
Equity, Since 31 Jan 03 | SBIN4% ₹1,172 Cr 11,060,356
↑ 126,001 Infosys Ltd (Technology)
Equity, Since 31 Jan 03 | INFY4% ₹1,064 Cr 9,385,439
↑ 106,920 Axis Bank Ltd (Financial Services)
Equity, Since 31 Mar 09 | 5322153% ₹999 Cr 7,684,715
↑ 87,546 Kotak Mahindra Bank Ltd (Financial Services)
Equity, Since 31 Dec 10 | KOTAKBANK3% ₹826 Cr 19,700,767
↑ 224,434 Mahindra & Mahindra Ltd (Consumer Cyclical)
Equity, Since 31 Jan 03 | M&M3% ₹784 Cr 2,388,915
↑ 27,215 6. Franklin India Index Fund Nifty Plan
Franklin India Index Fund Nifty Plan
Growth Launch Date 4 Aug 00 NAV (23 Oct 26) ₹183.376 ↓ -0.69 (-0.38 %) Net Assets (Cr) ₹654 on 30 Sep 26 Category Others - Index Fund AMC Franklin Templeton Asst Mgmt(IND)Pvt Ltd Rating ☆ Risk Moderately High Expense Ratio 0.63 Sharpe Ratio -0.71 Information Ratio -4.81 Alpha Ratio -0.58 Min Investment 5,000 Min SIP Investment 500 Exit Load 0-30 Days (1%),30 Days and above(NIL) Growth of 10,000 investment over the years.
Date Value 30 Sep 21 ₹10,000 30 Sep 22 ₹9,772 30 Sep 23 ₹11,253 30 Sep 24 ₹14,859 30 Sep 25 ₹14,265 30 Sep 26 ₹13,186 Returns for Franklin India Index Fund Nifty Plan
absolute basis & more than 1 year are on CAGR (Compound Annual Growth Rate) basis. as on 23 Oct 26 Duration Returns 1 Month -3.6% 3 Month -5.2% 6 Month -6% 1 Year -12.2% 3 Year 6% 5 Year 5.1% 10 Year 15 Year Since launch 11.7% Historical performance (Yearly) on absolute basis
Year Returns 2025 11.3% 2024 9.5% 2023 20.2% 2022 4.9% 2021 24.3% 2020 14.7% 2019 12% 2018 3.2% 2017 28.3% 2016 3.3% Fund Manager information for Franklin India Index Fund Nifty Plan
Name Since Tenure Sandeep Manam 18 Oct 21 4.87 Yr. Shyam Sriram 26 Sep 24 1.93 Yr. Data below for Franklin India Index Fund Nifty Plan as on 30 Sep 26
Asset Allocation
Asset Class Value Cash 0.31% Equity 99.69% Top Securities Holdings / Portfolio
Name Holding Value Quantity HDFC Bank Ltd (Financial Services)
Equity, Since 31 Jan 03 | HDFCBANK10% ₹70 Cr 990,850
↓ -8,577 ICICI Bank Ltd (Financial Services)
Equity, Since 31 Jan 10 | ICICIBANK9% ₹67 Cr 463,530
↓ -4,012 Reliance Industries Ltd (Energy)
Equity, Since 31 Jan 03 | RELIANCE8% ₹56 Cr 437,127
↓ -3,784 Bharti Airtel Ltd (Communication Services)
Equity, Since 31 Mar 04 | BHARTIARTL5% ₹36 Cr 196,760
↓ -1,704 Larsen & Toubro Ltd (Industrials)
Equity, Since 30 Jun 12 | LT4% ₹31 Cr 75,734
↓ -655 State Bank of India (Financial Services)
Equity, Since 31 Jan 03 | SBIN4% ₹28 Cr 267,457
↓ -2,315 Infosys Ltd (Technology)
Equity, Since 29 Feb 12 | INFY4% ₹26 Cr 226,955
↓ -1,964 Axis Bank Ltd (Financial Services)
Equity, Since 30 Jun 09 | 5322153% ₹24 Cr 185,828
↓ -1,609 Kotak Mahindra Bank Ltd (Financial Services)
Equity, Since 31 Mar 12 | KOTAKBANK3% ₹20 Cr 476,395
↓ -4,124 Mahindra & Mahindra Ltd (Consumer Cyclical)
Equity, Since 28 Feb 07 | M&M3% ₹19 Cr 57,768
↓ -500 7. ICICI Prudential Nifty Next 50 Index Fund
ICICI Prudential Nifty Next 50 Index Fund
Growth Launch Date 25 Jun 10 NAV (23 Oct 26) ₹57.8694 ↓ -1.33 (-2.24 %) Net Assets (Cr) ₹9,744 on 30 Sep 26 Category Others - Index Fund AMC ICICI Prudential Asset Management Company Limited Rating ☆☆☆☆☆ Risk Moderately High Expense Ratio 0.68 Sharpe Ratio -0.01 Information Ratio -6.31 Alpha Ratio -0.87 Min Investment 5,000 Min SIP Investment 100 Exit Load 0-7 Days (0.25%),7 Days and above(NIL) Growth of 10,000 investment over the years.
Date Value 30 Sep 21 ₹10,000 30 Sep 22 ₹10,037 30 Sep 23 ₹10,650 30 Sep 24 ₹18,220 30 Sep 25 ₹16,022 30 Sep 26 ₹16,477 Returns for ICICI Prudential Nifty Next 50 Index Fund
absolute basis & more than 1 year are on CAGR (Compound Annual Growth Rate) basis. as on 23 Oct 26 Duration Returns 1 Month -9.2% 3 Month -8.3% 6 Month -6.5% 1 Year -5.1% 3 Year 14.6% 5 Year 9.2% 10 Year 15 Year Since launch 11.4% Historical performance (Yearly) on absolute basis
Year Returns 2025 2.1% 2024 27.2% 2023 26.3% 2022 0.1% 2021 29.5% 2020 14.3% 2019 0.6% 2018 -8.8% 2017 45.7% 2016 7.6% Fund Manager information for ICICI Prudential Nifty Next 50 Index Fund
Name Since Tenure Nishit Patel 18 Jan 21 5.62 Yr. Ajaykumar Solanki 1 Feb 24 2.58 Yr. Ashwini Bharucha 18 Dec 24 1.7 Yr. Venus Ahuja 1 Nov 25 0.83 Yr. Data below for ICICI Prudential Nifty Next 50 Index Fund as on 30 Sep 26
Asset Allocation
Asset Class Value Cash 0.13% Equity 99.87% Top Securities Holdings / Portfolio
Name Holding Value Quantity Divi's Laboratories Ltd (Healthcare)
Equity, Since 30 Sep 24 | DIVISLAB5% ₹479 Cr 505,895
↑ 8,068 TVS Motor Co Ltd (Consumer Cyclical)
Equity, Since 30 Sep 23 | 5323434% ₹406 Cr 935,104
↑ 14,920 Tata Motors Ltd (Consumer Cyclical)
Equity, Since 31 Mar 26 | TMCV4% ₹392 Cr 8,314,044
↑ 132,742 Hindustan Aeronautics Ltd Ordinary Shares (Industrials)
Equity, Since 30 Sep 22 | HAL4% ₹363 Cr 755,170
↑ 12,049 Adani Power Ltd (Utilities)
Equity, Since 31 Mar 24 | 5330963% ₹327 Cr 16,517,749
↑ 263,732 Cholamandalam Investment and Finance Co Ltd (Financial Services)
Equity, Since 30 Sep 21 | CHOLAFIN3% ₹320 Cr 1,722,158
↑ 27,490 Samvardhana Motherson International Ltd (Consumer Cyclical)
Equity, Since 30 Sep 22 | MOTHERSON3% ₹300 Cr 17,586,411
↑ 280,796 Torrent Pharmaceuticals Ltd (Healthcare)
Equity, Since 30 Jun 20 | TORNTPHARM3% ₹296 Cr 583,924
↑ 9,314 Cummins India Ltd (Industrials)
Equity, Since 31 Mar 26 | 5004803% ₹275 Cr 537,716
↑ 8,577 Bharat Petroleum Corp Ltd (Energy)
Equity, Since 31 Mar 25 | 5005473% ₹261 Cr 8,067,782
↑ 128,810 8. IDBI Nifty Junior Index Fund
IDBI Nifty Junior Index Fund
Growth Launch Date 20 Sep 10 NAV (23 Oct 26) ₹49.0147 ↓ -1.12 (-2.24 %) Net Assets (Cr) ₹109 on 30 Sep 26 Category Others - Index Fund AMC IDBI Asset Management Limited Rating ☆☆☆☆☆ Risk Moderately High Expense Ratio 0.86 Sharpe Ratio 0 Information Ratio -4.01 Alpha Ratio -0.58 Min Investment 5,000 Min SIP Investment 500 Exit Load NIL Growth of 10,000 investment over the years.
Date Value 30 Sep 21 ₹10,000 30 Sep 22 ₹10,066 30 Sep 23 ₹10,641 30 Sep 24 ₹18,103 30 Sep 25 ₹15,959 30 Sep 26 ₹16,463 Returns for IDBI Nifty Junior Index Fund
absolute basis & more than 1 year are on CAGR (Compound Annual Growth Rate) basis. as on 23 Oct 26 Duration Returns 1 Month -9.2% 3 Month -8.2% 6 Month -6.1% 1 Year -4.8% 3 Year 14.6% 5 Year 9.2% 10 Year 15 Year Since launch 10.4% Historical performance (Yearly) on absolute basis
Year Returns 2025 2% 2024 26.9% 2023 25.7% 2022 0.4% 2021 29.6% 2020 13.7% 2019 0.5% 2018 -9.3% 2017 43.6% 2016 6.9% Fund Manager information for IDBI Nifty Junior Index Fund
Name Since Tenure Nikhil Kapoor 7 Apr 26 0.4 Yr. Sasikant Aravamuthan 1 Jul 26 0.17 Yr. Data below for IDBI Nifty Junior Index Fund as on 30 Sep 26
Asset Allocation
Asset Class Value Equity 101.61% Top Securities Holdings / Portfolio
Name Holding Value Quantity Divi's Laboratories Ltd (Healthcare)
Equity, Since 30 Sep 24 | DIVISLAB5% ₹5 Cr 5,724
↑ 183 TVS Motor Co Ltd (Consumer Cyclical)
Equity, Since 30 Sep 23 | 5323434% ₹5 Cr 10,545
↑ 308 Tata Motors Ltd (Consumer Cyclical)
Equity, Since 31 Mar 26 | TMCV4% ₹4 Cr 94,139
↑ 3,115 Hindustan Aeronautics Ltd Ordinary Shares (Industrials)
Equity, Since 30 Sep 22 | HAL4% ₹4 Cr 8,561
↑ 294 Adani Power Ltd (Utilities)
Equity, Since 31 Mar 24 | 5330963% ₹4 Cr 186,983
↑ 6,112 Cholamandalam Investment and Finance Co Ltd (Financial Services)
Equity, Since 30 Sep 21 | CHOLAFIN3% ₹4 Cr 19,440
↑ 572 Samvardhana Motherson International Ltd (Consumer Cyclical)
Equity, Since 30 Sep 22 | MOTHERSON3% ₹3 Cr 199,116
↑ 6,584 Torrent Pharmaceuticals Ltd (Healthcare)
Equity, Since 30 Jun 20 | TORNTPHARM3% ₹3 Cr 6,591
↑ 179 Cummins India Ltd (Industrials)
Equity, Since 31 Mar 26 | 5004803% ₹3 Cr 6,087
↑ 197 Bharat Petroleum Corp Ltd (Energy)
Equity, Since 31 Mar 25 | 5005473% ₹3 Cr 91,210
↑ 2,835 9. LIC MF Index Fund Nifty
LIC MF Index Fund Nifty
Growth Launch Date 14 Nov 02 NAV (23 Oct 26) ₹124.911 ↓ -0.48 (-0.38 %) Net Assets (Cr) ₹345 on 30 Sep 26 Category Others - Index Fund AMC LIC Mutual Fund Asset Mgmt Co Ltd Rating ☆ Risk Moderately High Expense Ratio 0.97 Sharpe Ratio -0.74 Information Ratio -16.82 Alpha Ratio -1.11 Min Investment 5,000 Min SIP Investment 1,000 Exit Load 0-1 Months (1%),1 Months and above(NIL) Growth of 10,000 investment over the years.
Date Value 30 Sep 21 ₹10,000 30 Sep 22 ₹9,732 30 Sep 23 ₹11,170 30 Sep 24 ₹14,692 30 Sep 25 ₹14,034 30 Sep 26 ₹12,903 Returns for LIC MF Index Fund Nifty
absolute basis & more than 1 year are on CAGR (Compound Annual Growth Rate) basis. as on 23 Oct 26 Duration Returns 1 Month -3.6% 3 Month -5.3% 6 Month -6.2% 1 Year -12.7% 3 Year 5.5% 5 Year 4.6% 10 Year 15 Year Since launch 11.6% Historical performance (Yearly) on absolute basis
Year Returns 2025 10.7% 2024 8.8% 2023 19.8% 2022 4.7% 2021 23.8% 2020 14.7% 2019 12.6% 2018 2.6% 2017 28.6% 2016 2.7% Fund Manager information for LIC MF Index Fund Nifty
Name Since Tenure Nikhil Kapoor 7 Apr 26 0.4 Yr. Sasikant Aravamuthan 1 Jul 26 0.17 Yr. Data below for LIC MF Index Fund Nifty as on 30 Sep 26
Asset Allocation
Asset Class Value Cash 0.1% Equity 99.9% Top Securities Holdings / Portfolio
Name Holding Value Quantity HDFC Bank Ltd (Financial Services)
Equity, Since 30 Apr 09 | HDFCBANK10% ₹36 Cr 508,576
↑ 948 ICICI Bank Ltd (Financial Services)
Equity, Since 30 Apr 09 | ICICIBANK9% ₹35 Cr 238,100
↑ 953 Reliance Industries Ltd (Energy)
Equity, Since 31 Mar 12 | RELIANCE8% ₹29 Cr 224,909
↑ 1,544 Bharti Airtel Ltd (Communication Services)
Equity, Since 30 Apr 09 | BHARTIARTL5% ₹18 Cr 101,336
↑ 405 Larsen & Toubro Ltd (Industrials)
Equity, Since 30 Apr 09 | LT4% ₹16 Cr 38,948
↑ 155 State Bank of India (Financial Services)
Equity, Since 30 Apr 09 | SBIN4% ₹15 Cr 137,415
↑ 550 Infosys Ltd (Technology)
Equity, Since 31 Jan 03 | INFY4% ₹13 Cr 116,789
↑ 1,179 Axis Bank Ltd (Financial Services)
Equity, Since 31 Mar 09 | 5322153% ₹12 Cr 95,269
↑ 381 Kotak Mahindra Bank Ltd (Financial Services)
Equity, Since 30 Apr 10 | KOTAKBANK3% ₹10 Cr 244,809
↑ 1,987 Mahindra & Mahindra Ltd (Consumer Cyclical)
Equity, Since 31 Mar 12 | M&M3% ₹10 Cr 29,703
↑ 327 10. Nippon India Index Fund - Nifty Plan
Nippon India Index Fund - Nifty Plan
Growth Launch Date 28 Sep 10 NAV (23 Oct 26) ₹38.6148 ↓ -0.15 (-0.38 %) Net Assets (Cr) ₹3,461 on 30 Sep 26 Category Others - Index Fund AMC Nippon Life Asset Management Ltd. Rating ☆ Risk Moderately High Expense Ratio 0.41 Sharpe Ratio -0.7 Information Ratio -10.6 Alpha Ratio -0.46 Min Investment 5,000 Min SIP Investment 100 Exit Load 0-7 Days (0.25%),7 Days and above(NIL) Growth of 10,000 investment over the years.
Date Value 30 Sep 21 ₹10,000 30 Sep 22 ₹9,726 30 Sep 23 ₹11,217 30 Sep 24 ₹14,816 30 Sep 25 ₹14,238 30 Sep 26 ₹13,171 Returns for Nippon India Index Fund - Nifty Plan
absolute basis & more than 1 year are on CAGR (Compound Annual Growth Rate) basis. as on 23 Oct 26 Duration Returns 1 Month -3.6% 3 Month -5.2% 6 Month -5.9% 1 Year -12.1% 3 Year 6.1% 5 Year 5.1% 10 Year 15 Year Since launch 8.8% Historical performance (Yearly) on absolute basis
Year Returns 2025 11.4% 2024 9.4% 2023 20.5% 2022 4.6% 2021 24% 2020 14.3% 2019 12.3% 2018 3.5% 2017 29% 2016 2.5% Fund Manager information for Nippon India Index Fund - Nifty Plan
Name Since Tenure Himanshu Mange 23 Dec 23 2.69 Yr. Data below for Nippon India Index Fund - Nifty Plan as on 30 Sep 26
Asset Allocation
Asset Class Value Equity 100.04% Top Securities Holdings / Portfolio
Name Holding Value Quantity HDFC Bank Ltd (Financial Services)
Equity, Since 31 Oct 10 | HDFCBANK10% ₹383 Cr 5,398,985
↑ 52,972 ICICI Bank Ltd (Financial Services)
Equity, Since 31 Oct 10 | ICICIBANK9% ₹367 Cr 2,525,701
↑ 24,781 Reliance Industries Ltd (Energy)
Equity, Since 31 Oct 10 | RELIANCE8% ₹304 Cr 2,381,835
↑ 23,369 Bharti Airtel Ltd (Communication Services)
Equity, Since 31 Oct 10 | BHARTIARTL5% ₹194 Cr 1,072,117
↑ 10,519 Larsen & Toubro Ltd (Industrials)
Equity, Since 29 Feb 12 | LT4% ₹167 Cr 412,661
↑ 4,048 State Bank of India (Financial Services)
Equity, Since 31 Oct 10 | SBIN4% ₹154 Cr 1,457,330
↑ 14,299 Infosys Ltd (Technology)
Equity, Since 31 Oct 10 | INFY4% ₹140 Cr 1,236,640
↑ 12,133 Axis Bank Ltd (Financial Services)
Equity, Since 31 Oct 10 | 5322153% ₹132 Cr 1,012,550
↑ 9,935 Kotak Mahindra Bank Ltd (Financial Services)
Equity, Since 31 Aug 11 | KOTAKBANK3% ₹109 Cr 2,595,803
↑ 25,468 Mahindra & Mahindra Ltd (Consumer Cyclical)
Equity, Since 31 Oct 10 | M&M3% ₹103 Cr 314,767
↑ 3,088
निफ्टी इंडेक्स फंड में ऑनलाइन निवेश कैसे करें?
Fincash.com पर आजीवन मुफ्त निवेश खाता खोलें।
अपना पंजीकरण और केवाईसी प्रक्रिया पूरी करें
Upload Documents (PAN, Aadhaar, etc.). और, आप निवेश करने के लिए तैयार हैं!
यहां प्रदान की गई जानकारी सटीक है, यह सुनिश्चित करने के लिए सभी प्रयास किए गए हैं। हालांकि, डेटा की शुद्धता के संबंध में कोई गारंटी नहीं दी जाती है। कृपया कोई भी निवेश करने से पहले योजना सूचना दस्तावेज के साथ सत्यापित करें।
You Might Also Like
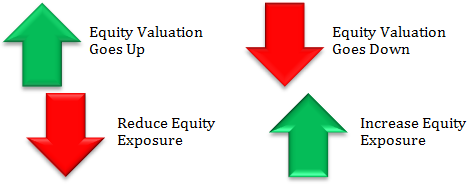
Balanced Funds Vs Balanced Advantage Funds – A Complete Guide For Indian Investors

Can Mutual Funds Create Generational Wealth? A Complete Guide For Indian Investors
Best Liquid Mutual Funds In 2026 - A Complete Investor Guide
Upside And Downside Capture Ratio: A Practical Guide For Indian Mutual Fund Investors

How To Invest In Us Stocks Via Gift City In 2026: A Complete Guide For Indian Investors

Life Cycle Funds In India: Complete Guide To Sebi’s New Goal-based Mutual Fund Category





AMFI Registration No. 112358 | CIN: U74999MH2016PTC282153
Shepard Technologies Pvt. Ltd. (with ARN code 112358) makes no warranties or representations, express or implied, on products offered through the platform. It accepts no liability for any damages or losses, however caused, in connection with the use of, or on the reliance of its product or related services. Terms and conditions of the website are applicable.
©2026 Shepard Technologies Private Limited. All Rights Reserved
Research Highlights for ICICI Prudential Nifty Index Fund