 +91-22-48913909
Table of Contents
- बैलेंस्ड म्यूचुअल फंड में निवेश क्यों करें?
- टॉप बैलेंस्ड फंड के फायदे और नुकसान
- वित्त वर्ष 22 - 23 में निवेश करने के लिए सर्वश्रेष्ठ प्रदर्शन करने वाले बैलेंस्ड फंड या हाइब्रिड फंड
- बैलेंस्ड म्यूचुअल फंड में ऑनलाइन निवेश कैसे करें?
Top 11 Funds
- JM Equity Hybrid Fund
- BOI AXA Mid and Small Cap Equity and Debt Fund
- ICICI Prudential Equity and Debt Fund
- UTI Multi Asset Fund
- ICICI Prudential Multi-Asset Fund
- Edelweiss Multi Asset Allocation Fund
- UTI Hybrid Equity Fund
- DSP BlackRock Equity and Bond Fund
- Nippon India Equity Hybrid Fund
- L&T Hybrid Equity Fund
- Franklin India Equity Hybrid Fund
बेस्ट बैलेंस्ड म्यूचुअल फंड 2022
शीर्षबैलेंस्ड फंड हैंम्यूचुअल फंड्स जो अपनी संपत्ति को इक्विटी और डेट इंस्ट्रूमेंट दोनों में निवेश करते हैं ताकि अच्छा समग्र रिटर्न मिल सके। बैलेंस्ड म्युचुअल फंड उन निवेशकों के लिए फायदेमंद होते हैं जो एक लेने के इच्छुक हैंमंडी कुछ निश्चित रिटर्न की तलाश में भी जोखिम।
इक्विटी और स्टॉक में निवेश की गई संपत्ति बाजार से जुड़े रिटर्न की पेशकश करती है जबकि डेट इंस्ट्रूमेंट में निवेश की गई संपत्ति निश्चित रिटर्न देती है। इक्विटी और डेट दोनों का संयोजन होने के कारण, निवेशकों को बहुत सावधान रहना चाहिए जबनिवेश इन निधियों में। निवेशकों को सलाह दी जाती है कि बैलेंस्ड म्यूचुअल फंड में निवेश करने से पहले शीर्ष बैलेंस्ड फंड देखें। हमने नीचे शीर्ष संतुलित म्यूचुअल फंड सूचीबद्ध किए हैं।
बैलेंस्ड म्यूचुअल फंड में निवेश क्यों करें?
आम तौर पर, निवेशक कम जोखिम वाले कम समय के भीतर अपने निवेश में विविधता लाने के तरीकों की तलाश करते हैं। इक्विटी और डेट इंस्ट्रूमेंट दोनों का संयोजन होने के कारण, बैलेंस्ड म्यूचुअल फंड इन दोनों दुनिया के सर्वश्रेष्ठ ऑफर पेश करते हैं। इसलिए, ये फंड लगातार बदलती बाजार स्थितियों के कारण गिरावट के जोखिम को कम करते हैं, जबकि ऋण जोखिम के कारण कुछ बुनियादी रिटर्न का प्रबंधन करते हैं। यह बैलेंस्ड फंड्स को उन निवेशकों के लिए एक अत्यधिक उपयुक्त निवेश विकल्प बनाता है जो 100% में निवेश करने की तुलना में थोड़ा कम जोखिम के साथ रिटर्न प्राप्त करने के मध्य मार्ग की तलाश में हैं।इक्विटी फ़ंड.
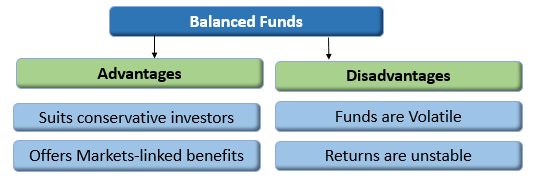
टॉप बैलेंस्ड फंड के फायदे और नुकसान
लाभ
- अचल संपत्ति में 35-40% निवेश करके स्थिर रिटर्न प्रदान करता हैआय विकल्प
- इक्विटी में 60-65% संपत्ति का निवेश करके बाजार से जुड़े रिटर्न को प्रफुल्लित करता है
- मध्यम जोखिम लेने के इच्छुक रूढ़िवादी निवेशकों के लिए उपयुक्त
नुकसान
- इक्विटी में निवेश किया गया फंड अस्थिर होता है और इसमें उच्च जोखिम होता हैफ़ैक्टर
- संयुक्त रिटर्न (डेट और इक्विटी म्यूचुअल फंड दोनों का रिटर्न) लंबे समय में बहुत अच्छा रिटर्न नहीं दे सकता है
Talk to our investment specialist
वित्त वर्ष 22 - 23 में निवेश करने के लिए सर्वश्रेष्ठ प्रदर्शन करने वाले बैलेंस्ड फंड या हाइब्रिड फंड
शीर्ष प्रदर्शन करने वाले आक्रामक हाइब्रिड फंड
यह फंड अपनी कुल संपत्ति का लगभग 65 से 85 प्रतिशत इक्विटी से संबंधित उपकरणों में और अपनी संपत्ति का लगभग 20 से 35 प्रतिशत ऋण उपकरणों में निवेश करेगा।म्यूचुअल फंड हाउस संतुलित हाइब्रिड या आक्रामक हाइब्रिड फंड की पेशकश कर सकते हैं, दोनों नहीं।
Fund NAV Net Assets (Cr) 3 MO (%) 6 MO (%) 1 YR (%) 3 YR (%) 5 YR (%) 2024 (%) JM Equity Hybrid Fund Growth ₹122.877
↓ -0.12 ₹822 9.8 -1 -1 25 27.1 27 BOI AXA Mid and Small Cap Equity and Debt Fund Growth ₹38.73
↓ -0.09 ₹1,198 12.1 -1 2.4 24.6 27.7 25.8 ICICI Prudential Equity and Debt Fund Growth ₹393.98
↓ -0.22 ₹43,159 7.8 8.1 9.6 22.8 26.1 17.2 UTI Hybrid Equity Fund Growth ₹408.672
↓ -1.10 ₹6,254 8.4 3.7 7.1 20.4 22 19.7 DSP BlackRock Equity and Bond Fund Growth ₹360.416
↓ -1.17 ₹11,104 7.2 5.5 9.8 20.3 18.7 17.7 Note: Returns up to 1 year are on absolute basis & more than 1 year are on CAGR basis. as on 2 Jul 25
शीर्ष प्रदर्शन करने वाले कंजर्वेटिव हाइब्रिड फंड
इस योजना का मुख्य रूप से ऋण साधनों में निवेश किया जाएगा। उनकी कुल संपत्ति का लगभग 75 से 90 प्रतिशत ऋण उपकरणों में और लगभग 10 से 25 प्रतिशत इक्विटी से संबंधित उपकरणों में निवेश किया जाएगा। इस योजना को रूढ़िवादी नाम दिया गया है क्योंकि यह जोखिम से बचने वाले लोगों के लिए है। जो निवेशक अपने निवेश में ज्यादा जोखिम नहीं लेना चाहते हैं, वे इस योजना में निवेश करना पसंद कर सकते हैं।
Fund NAV Net Assets (Cr) 3 MO (%) 6 MO (%) 1 YR (%) 3 YR (%) 5 YR (%) 2024 (%) HDFC Hybrid Debt Fund Growth ₹82.432
↑ 0.02 ₹3,383 2.9 4 6.9 12 12.1 10.5 Kotak Debt Hybrid Fund Growth ₹58.6961
↑ 0.06 ₹3,129 3.2 3.5 6.9 12 11.8 11.4 SBI Debt Hybrid Fund Growth ₹72.8763
↑ 0.03 ₹9,643 4.1 4.5 7.2 11.5 11.8 11 Note: Returns up to 1 year are on absolute basis & more than 1 year are on CAGR basis. as on 2 Jul 25
शीर्ष प्रदर्शन करने वाले आर्बिट्राज फंड
यह फंड आर्बिट्रेज रणनीति का पालन करेगा और अपनी संपत्ति का कम से कम 65 प्रतिशत इक्विटी से संबंधित उपकरणों में निवेश करेगा। आर्बिट्रेज फंड म्यूचुअल फंड हैं जो म्यूचुअल फंड रिटर्न उत्पन्न करने के लिए नकद बाजार और डेरिवेटिव बाजार के बीच अंतर मूल्य का लाभ उठाते हैं। आर्बिट्राज फंड द्वारा उत्पन्न रिटर्न शेयर बाजार की अस्थिरता पर निर्भर करता है। आर्बिट्राज म्यूचुअल फंड प्रकृति में हाइब्रिड होते हैं और उच्च या लगातार अस्थिरता के समय में, ये फंड निवेशकों को अपेक्षाकृत जोखिम मुक्त रिटर्न प्रदान करते हैं।
Fund NAV Net Assets (Cr) 3 MO (%) 6 MO (%) 1 YR (%) 3 YR (%) 5 YR (%) 2024 (%) UTI Arbitrage Fund Growth ₹35.0647
↑ 0.01 ₹7,308 1.7 3.5 7.2 6.9 5.6 7.7 ICICI Prudential Equity Arbitrage Fund Growth ₹34.3292
↑ 0.00 ₹28,444 1.7 3.5 7.1 6.9 5.6 7.6 Kotak Equity Arbitrage Fund Growth ₹37.4949
↑ 0.01 ₹67,362 1.7 3.5 7.1 7.1 5.8 7.8 Note: Returns up to 1 year are on absolute basis & more than 1 year are on CAGR basis. as on 2 Jul 25
शीर्ष प्रदर्शन करने वाली गतिशील संपत्ति आवंटन निधि
यह योजना इक्विटी और डेट इंस्ट्रूमेंट्स में उनके निवेश को गतिशील रूप से प्रबंधित करेगी। जब बाजार महंगा हो जाता है तो ये फंड ऋण के आवंटन में वृद्धि करते हैं और इक्विटी को भार कम करते हैं। साथ ही, ये फंड कम जोखिम पर स्थिरता प्रदान करने पर ध्यान केंद्रित करते हैं।Fund NAV Net Assets (Cr) 3 MO (%) 6 MO (%) 1 YR (%) 3 YR (%) 5 YR (%) 2024 (%) Invesco India Dynamic Equity Fund Growth ₹54.3
↓ -0.13 ₹978 8 2 6.9 16.7 14.1 15.9 Axis Dynamic Equity Fund Growth ₹21.09
↓ -0.04 ₹3,161 5.9 4 7.9 16.4 14.1 17.5 Aditya Birla Sun Life Balanced Advantage Fund Growth ₹107.37
↓ -0.18 ₹7,710 8.4 7.5 9.3 15.6 15.2 13 Note: Returns up to 1 year are on absolute basis & more than 1 year are on CAGR basis. as on 2 Jul 25
शीर्ष प्रदर्शन करने वाले इक्विटी सेविंग फंड
यह स्कीम इक्विटी, आर्बिट्राज और डेट में निवेश करेगी। इक्विटी बचत कुल संपत्ति का कम से कम 65 प्रतिशत शेयरों में और न्यूनतम 10 प्रतिशत ऋण में निवेश करेगी। योजना सूचना दस्तावेज में न्यूनतम हेज और अनहेज्ड निवेश बताएगी।Fund NAV Net Assets (Cr) 3 MO (%) 6 MO (%) 1 YR (%) 3 YR (%) 5 YR (%) 2024 (%) L&T Equity Savings Fund Growth ₹33.0275
↑ 0.02 ₹655 6 -3.5 4.4 13.8 14.5 24 SBI Equity Savings Fund Growth ₹24.1386
↑ 0.01 ₹5,431 6.6 3.7 7.2 13.2 13 12 Principal Equity Savings Fund Growth ₹70.7724
↓ -0.05 ₹1,049 5.6 4.3 8 13.2 14.1 12.6 Note: Returns up to 1 year are on absolute basis & more than 1 year are on CAGR basis. as on 2 Jul 25
टॉप परफॉर्मिंग मल्टी एसेट एलोकेशन फंड
यह योजना तीन परिसंपत्ति वर्गों में निवेश कर सकती है, जिसका अर्थ है कि वे इक्विटी और ऋण के अलावा एक अतिरिक्त परिसंपत्ति वर्ग में निवेश कर सकते हैं। फंड को हर एसेट क्लास में कम से कम 10 फीसदी निवेश करना चाहिए। विदेशी प्रतिभूतियों को एक अलग परिसंपत्ति वर्ग के रूप में नहीं माना जाएगा। (Erstwhile JM Balanced Fund) To provide steady current income as well as long term growth of capital. JM Equity Hybrid Fund is a Hybrid - Hybrid Equity fund was launched on 1 Apr 95. It is a fund with Moderately High risk and has given a Below is the key information for JM Equity Hybrid Fund Returns up to 1 year are on (Erstwhile BOI AXA Mid Cap Equity And Debt Fund) The scheme's objective is to provide capital appreciation and income distribution to investors from a portfolio constituting of mid cap equity and equity related securities as well as fixed income securities.However there can be no assurance that the investment objectives of the Scheme will be realized BOI AXA Mid and Small Cap Equity and Debt Fund is a Hybrid - Hybrid Equity fund was launched on 20 Jul 16. It is a fund with Moderately High risk and has given a Below is the key information for BOI AXA Mid and Small Cap Equity and Debt Fund Returns up to 1 year are on (Erstwhile ICICI Prudential Balanced Fund) To generate long term capital appreciation and current income from a portfolio
that is invested in equity and equity related securities as well as in fixed income
securities. ICICI Prudential Equity and Debt Fund is a Hybrid - Hybrid Equity fund was launched on 3 Nov 99. It is a fund with Moderately High risk and has given a Below is the key information for ICICI Prudential Equity and Debt Fund Returns up to 1 year are on (Erstwhile UTI Wealth Builder Fund) The objective of the Scheme is to achieve long term capital appreciation by investing predominantly in a diversified portfolio of equity and equity related instruments along with investments in Gold ETFs and Debt and Money Market Instruments. However, there can be no assurance that the investment objective of the Scheme will be achieved. UTI Multi Asset Fund is a Hybrid - Multi Asset fund was launched on 21 Oct 08. It is a fund with Moderately High risk and has given a Below is the key information for UTI Multi Asset Fund Returns up to 1 year are on (Erstwhile ICICI Prudential Dynamic Plan) To generate capital appreciation by actively investing in equity and equity related securities. For defensive considerations, the Scheme may invest in debt, money market instruments and derivatives. The investment manager will have the discretion to take aggressive asset calls i.e. by staying 100% invested in equity market/equity related instruments at a given point of time and 0% at another, in which case, the fund may be invested in debt related instruments at its discretion. The AMC may choose to churn the portfolio of the Scheme in order to achieve the investment objective. The Scheme is suitable for investors seeking high returns and for those who are willing to take commensurate risks. ICICI Prudential Multi-Asset Fund is a Hybrid - Multi Asset fund was launched on 31 Oct 02. It is a fund with Moderately High risk and has given a Below is the key information for ICICI Prudential Multi-Asset Fund Returns up to 1 year are on (Erstwhile Edelweiss Prudent Advantage Fund) The objective of the Scheme is to generate returns through capital appreciation by investing in diversified portfolio of equity and equity-related securities, fixed income instruments and Gold Exchange Traded Funds.
However, there is no assurance that the investment objective of the Scheme will be realized. Edelweiss Multi Asset Allocation Fund is a Hybrid - Multi Asset fund was launched on 12 Aug 09. It is a fund with Moderately High risk and has given a Below is the key information for Edelweiss Multi Asset Allocation Fund Returns up to 1 year are on (Erstwhile UTI Balanced Fund) The scheme aims to invest in a portfolio of equity/equity related securities and fixed income securities (debt and money market securities) with a view to generating regular income together with capital appreciation. UTI Hybrid Equity Fund is a Hybrid - Hybrid Equity fund was launched on 2 Jan 95. It is a fund with Moderately High risk and has given a Below is the key information for UTI Hybrid Equity Fund Returns up to 1 year are on Seeks to generate long term capital appreciation and current income from a portfolio constituted of equity and equity related securities as well as fixed income securities. DSP BlackRock Equity and Bond Fund is a Hybrid - Hybrid Equity fund was launched on 27 May 99. It is a fund with Moderately High risk and has given a Below is the key information for DSP BlackRock Equity and Bond Fund Returns up to 1 year are on (Erstwhile Reliance Regular Savings Fund - Balanced Plan) The primary investment objective of this option is to generate consistent returns and appreciation of capital by investing in mix of securities comprising of Equity, Equity related instruments & fixed income instruments. Nippon India Equity Hybrid Fund is a Hybrid - Hybrid Equity fund was launched on 8 Jun 05. It is a fund with Moderately High risk and has given a Below is the key information for Nippon India Equity Hybrid Fund Returns up to 1 year are on (Erstwhile L&T India Prudence Fund) To seek to generate long-term capital appreciation from a diversified portfolio of predominantly equity and equity related securities and to generate reasonable returns through a portfolio of debt and money market instruments L&T Hybrid Equity Fund is a Hybrid - Hybrid Equity fund was launched on 7 Feb 11. It is a fund with Moderately High risk and has given a Below is the key information for L&T Hybrid Equity Fund Returns up to 1 year are on (Erstwhile Franklin India Balanced Fund) The fund aims to provide long term capital appreciation and current income by investing in equity and equity related securities and high quality fixed income instruments. Franklin India Equity Hybrid Fund is a Hybrid - Hybrid Equity fund was launched on 10 Dec 99. It is a fund with Moderately High risk and has given a Below is the key information for Franklin India Equity Hybrid Fund Returns up to 1 year are on Fund NAV Net Assets (Cr) 3 MO (%) 6 MO (%) 1 YR (%) 3 YR (%) 5 YR (%) 2024 (%) UTI Multi Asset Fund Growth ₹74.8978
↓ -0.01 ₹5,659 7.7 4.3 8.2 22.5 17.3 20.7 ICICI Prudential Multi-Asset Fund Growth ₹761.267
↑ 0.24 ₹59,452 6.3 9.6 11.6 22.1 24.7 16.1 Edelweiss Multi Asset Allocation Fund Growth ₹64.31
↓ -0.12 ₹2,749 9.1 4.5 8.6 21.5 21.6 20.2 Note: Returns up to 1 year are on absolute basis & more than 1 year are on CAGR basis. as on 2 Jul 25 एयूएम>= 200 करोड़ पर छाँटा गया3 सालसीएजीआर वापसी.1. JM Equity Hybrid Fund
CAGR/Annualized return of 12.6% since its launch. Ranked 35 in Hybrid Equity category. Return for 2024 was 27% , 2023 was 33.8% and 2022 was 8.1% . JM Equity Hybrid Fund
Growth Launch Date 1 Apr 95 NAV (02 Jul 25) ₹122.877 ↓ -0.12 (-0.10 %) Net Assets (Cr) ₹822 on 31 May 25 Category Hybrid - Hybrid Equity AMC JM Financial Asset Management Limited Rating ☆ Risk Moderately High Expense Ratio 2.36 Sharpe Ratio -0.27 Information Ratio 1.06 Alpha Ratio -7.35 Min Investment 5,000 Min SIP Investment 500 Exit Load 0-60 Days (1%),60 Days and above(NIL) Growth of 10,000 investment over the years.
Date Value 30 Jun 20 ₹10,000 30 Jun 21 ₹17,122 30 Jun 22 ₹17,079 30 Jun 23 ₹21,400 30 Jun 24 ₹33,235 30 Jun 25 ₹33,353 Returns for JM Equity Hybrid Fund
absolute basis & more than 1 year are on CAGR (Compound Annual Growth Rate) basis. as on 2 Jul 25 Duration Returns 1 Month 4.6% 3 Month 9.8% 6 Month -1% 1 Year -1% 3 Year 25% 5 Year 27.1% 10 Year 15 Year Since launch 12.6% Historical performance (Yearly) on absolute basis
Year Returns 2024 27% 2023 33.8% 2022 8.1% 2021 22.9% 2020 30.5% 2019 -8.1% 2018 1.7% 2017 18.5% 2016 3% 2015 -0.2% Fund Manager information for JM Equity Hybrid Fund
Name Since Tenure Satish Ramanathan 1 Oct 24 0.67 Yr. Asit Bhandarkar 31 Dec 21 3.42 Yr. Ruchi Fozdar 4 Oct 24 0.66 Yr. Deepak Gupta 11 Apr 25 0.14 Yr. Data below for JM Equity Hybrid Fund as on 31 May 25
Asset Allocation
Asset Class Value Cash 3.78% Equity 76.32% Debt 19.9% Equity Sector Allocation
Sector Value Financial Services 22.98% Technology 14.2% Consumer Cyclical 9.98% Industrials 9.53% Basic Materials 7.09% Communication Services 4.97% Consumer Defensive 3.98% Health Care 3.6% Debt Sector Allocation
Sector Value Government 11.33% Corporate 10.32% Cash Equivalent 2.03% Credit Quality
Rating Value AA 1.13% AAA 98.87% Top Securities Holdings / Portfolio
Name Holding Value Quantity Bharti Airtel Ltd (Communication Services)
Equity, Since 31 Oct 24 | BHARTIARTL5% ₹41 Cr 220,000
↑ 20,000 Larsen & Toubro Ltd (Industrials)
Equity, Since 31 May 21 | LT4% ₹33 Cr 88,520
↑ 20,000 Bajaj Finance Ltd (Financial Services)
Equity, Since 31 Jan 25 | BAJFINANCE4% ₹32 Cr 34,504
↓ -9,000 HDFC Bank Ltd (Financial Services)
Equity, Since 30 Jun 24 | HDFCBANK4% ₹31 Cr 160,000
↓ -32,000 Tech Mahindra Ltd (Technology)
Equity, Since 31 Dec 23 | TECHM4% ₹29 Cr 185,000 ICICI Bank Ltd (Financial Services)
Equity, Since 31 Oct 21 | ICICIBANK4% ₹29 Cr 200,114 Multi Commodity Exchange of India Ltd (Financial Services)
Equity, Since 31 May 25 | MCX3% ₹26 Cr 40,000
↑ 40,000 Ujjivan Small Finance Bank Ltd Ordinary Shares (Financial Services)
Equity, Since 31 Jan 25 | 5429043% ₹25 Cr 5,876,466
↑ 800,000 Waaree Energies Ltd (Technology)
Equity, Since 31 May 25 | 5442773% ₹24 Cr 80,000
↑ 80,000 Hindustan Aeronautics Ltd Ordinary Shares (Industrials)
Equity, Since 31 May 25 | HAL3% ₹21 Cr 42,000
↑ 42,000 2. BOI AXA Mid and Small Cap Equity and Debt Fund
CAGR/Annualized return of 16.4% since its launch. Return for 2024 was 25.8% , 2023 was 33.7% and 2022 was -4.8% . BOI AXA Mid and Small Cap Equity and Debt Fund
Growth Launch Date 20 Jul 16 NAV (02 Jul 25) ₹38.73 ↓ -0.09 (-0.23 %) Net Assets (Cr) ₹1,198 on 31 May 25 Category Hybrid - Hybrid Equity AMC BOI AXA Investment Mngrs Private Ltd Rating Risk Moderately High Expense Ratio 2.68 Sharpe Ratio 0.16 Information Ratio 0 Alpha Ratio 0 Min Investment 5,000 Min SIP Investment 1,000 Exit Load 0-1 Years (1%),1 Years and above(NIL) Growth of 10,000 investment over the years.
Date Value 30 Jun 20 ₹10,000 30 Jun 21 ₹18,065 30 Jun 22 ₹17,599 30 Jun 23 ₹21,759 30 Jun 24 ₹33,061 30 Jun 25 ₹34,169 Returns for BOI AXA Mid and Small Cap Equity and Debt Fund
absolute basis & more than 1 year are on CAGR (Compound Annual Growth Rate) basis. as on 2 Jul 25 Duration Returns 1 Month 2.3% 3 Month 12.1% 6 Month -1% 1 Year 2.4% 3 Year 24.6% 5 Year 27.7% 10 Year 15 Year Since launch 16.4% Historical performance (Yearly) on absolute basis
Year Returns 2024 25.8% 2023 33.7% 2022 -4.8% 2021 54.5% 2020 31.1% 2019 -4.7% 2018 -14.2% 2017 47.1% 2016 2015 Fund Manager information for BOI AXA Mid and Small Cap Equity and Debt Fund
Name Since Tenure Alok Singh 16 Feb 17 8.29 Yr. Data below for BOI AXA Mid and Small Cap Equity and Debt Fund as on 31 May 25
Asset Allocation
Asset Class Value Cash 15.46% Equity 71.52% Debt 13.02% Equity Sector Allocation
Sector Value Basic Materials 16.59% Financial Services 13.27% Industrials 12.91% Technology 8.31% Consumer Cyclical 7.66% Health Care 6.71% Consumer Defensive 3.47% Energy 1.56% Utility 1.03% Debt Sector Allocation
Sector Value Cash Equivalent 9.61% Government 9.48% Corporate 9.4% Credit Quality
Rating Value AAA 100% Top Securities Holdings / Portfolio
Name Holding Value Quantity Coforge Ltd (Technology)
Equity, Since 31 May 20 | COFORGE4% ₹45 Cr 52,800 Housing & Urban Development Corp Ltd (Financial Services)
Equity, Since 31 May 24 | HUDCO3% ₹38 Cr 1,580,000 Jindal Stainless Ltd (Basic Materials)
Equity, Since 30 Sep 21 | JSL3% ₹36 Cr 566,000
↑ 24,000 Bharat Dynamics Ltd Ordinary Shares (Industrials)
Equity, Since 31 Jul 24 | BDL3% ₹32 Cr 159,000 Lloyds Metals & Energy Ltd (Basic Materials)
Equity, Since 28 Feb 25 | 5124553% ₹31 Cr 222,000
↑ 43,858 Hindustan Copper Ltd (Basic Materials)
Equity, Since 31 Oct 24 | HINDCOPPER2% ₹26 Cr 1,050,000
↑ 250,000 PB Fintech Ltd (Financial Services)
Equity, Since 29 Feb 24 | 5433902% ₹26 Cr 145,000 Nippon Life India Asset Management Ltd Ordinary Shares (Financial Services)
Equity, Since 31 Jan 24 | NAM-INDIA2% ₹23 Cr 315,000 UNO Minda Ltd (Consumer Cyclical)
Equity, Since 31 Jul 19 | UNOMINDA2% ₹23 Cr 225,000
↑ 25,000 Eris Lifesciences Ltd Registered Shs (Healthcare)
Equity, Since 31 Jul 23 | ERIS2% ₹22 Cr 138,000 3. ICICI Prudential Equity and Debt Fund
CAGR/Annualized return of 15.4% since its launch. Ranked 7 in Hybrid Equity category. Return for 2024 was 17.2% , 2023 was 28.2% and 2022 was 11.7% . ICICI Prudential Equity and Debt Fund
Growth Launch Date 3 Nov 99 NAV (02 Jul 25) ₹393.98 ↓ -0.22 (-0.06 %) Net Assets (Cr) ₹43,159 on 31 May 25 Category Hybrid - Hybrid Equity AMC ICICI Prudential Asset Management Company Limited Rating ☆☆☆☆ Risk Moderately High Expense Ratio 1.78 Sharpe Ratio 0.48 Information Ratio 1.63 Alpha Ratio 2.14 Min Investment 5,000 Min SIP Investment 100 Exit Load 0-1 Years (1%),1 Years and above(NIL) Growth of 10,000 investment over the years.
Date Value 30 Jun 20 ₹10,000 30 Jun 21 ₹15,117 30 Jun 22 ₹17,416 30 Jun 23 ₹21,118 30 Jun 24 ₹29,104 30 Jun 25 ₹32,018 Returns for ICICI Prudential Equity and Debt Fund
absolute basis & more than 1 year are on CAGR (Compound Annual Growth Rate) basis. as on 2 Jul 25 Duration Returns 1 Month 2.2% 3 Month 7.8% 6 Month 8.1% 1 Year 9.6% 3 Year 22.8% 5 Year 26.1% 10 Year 15 Year Since launch 15.4% Historical performance (Yearly) on absolute basis
Year Returns 2024 17.2% 2023 28.2% 2022 11.7% 2021 41.7% 2020 9% 2019 9.3% 2018 -1.9% 2017 24.8% 2016 13.7% 2015 2.1% Fund Manager information for ICICI Prudential Equity and Debt Fund
Name Since Tenure Sankaran Naren 7 Dec 15 9.49 Yr. Manish Banthia 19 Sep 13 11.71 Yr. Mittul Kalawadia 29 Dec 20 4.42 Yr. Akhil Kakkar 22 Jan 24 1.36 Yr. Sri Sharma 30 Apr 21 4.09 Yr. Sharmila D’mello 31 Jul 22 2.84 Yr. Nitya Mishra 4 Nov 24 0.57 Yr. Data below for ICICI Prudential Equity and Debt Fund as on 31 May 25
Asset Allocation
Asset Class Value Cash 9.94% Equity 74.3% Debt 15.59% Other 0.17% Equity Sector Allocation
Sector Value Financial Services 21.2% Consumer Cyclical 13% Energy 6.35% Industrials 6.21% Health Care 5.72% Utility 5.3% Consumer Defensive 4.61% Technology 3.31% Communication Services 3.28% Basic Materials 3.05% Real Estate 2.31% Debt Sector Allocation
Sector Value Corporate 11.67% Government 8.16% Cash Equivalent 5.7% Credit Quality
Rating Value A 3.23% AA 25.25% AAA 71.52% Top Securities Holdings / Portfolio
Name Holding Value Quantity ICICI Bank Ltd (Financial Services)
Equity, Since 31 Jul 12 | ICICIBANK7% ₹2,990 Cr 20,680,765
↑ 371,000 NTPC Ltd (Utilities)
Equity, Since 28 Feb 17 | NTPC5% ₹2,277 Cr 68,189,261
↑ 3,268,087 HDFC Bank Ltd (Financial Services)
Equity, Since 30 Apr 21 | HDFCBANK5% ₹2,137 Cr 10,987,602 Maruti Suzuki India Ltd (Consumer Cyclical)
Equity, Since 31 Jul 21 | MARUTI5% ₹2,113 Cr 1,715,417 Sun Pharmaceuticals Industries Ltd (Healthcare)
Equity, Since 31 May 16 | SUNPHARMA4% ₹1,789 Cr 10,666,631
↑ 2,134,300 Axis Bank Ltd (Financial Services)
Equity, Since 31 Mar 21 | AXISBANK4% ₹1,633 Cr 13,696,775
↑ 3,747,435 Reliance Industries Ltd (Energy)
Equity, Since 30 Jun 22 | RELIANCE3% ₹1,475 Cr 10,378,392
↑ 177,026 Bharti Airtel Ltd (Communication Services)
Equity, Since 31 May 16 | BHARTIARTL3% ₹1,334 Cr 7,187,284
↑ 779,104 Avenue Supermarts Ltd (Consumer Defensive)
Equity, Since 31 Jan 23 | DMART3% ₹1,291 Cr 3,225,630
↑ 66,981 TVS Motor Co Ltd (Consumer Cyclical)
Equity, Since 28 Feb 18 | TVSMOTOR3% ₹1,183 Cr 4,255,345 4. UTI Multi Asset Fund
CAGR/Annualized return of 12.8% since its launch. Ranked 34 in Multi Asset category. Return for 2024 was 20.7% , 2023 was 29.1% and 2022 was 4.4% . UTI Multi Asset Fund
Growth Launch Date 21 Oct 08 NAV (02 Jul 25) ₹74.8978 ↓ -0.01 (-0.01 %) Net Assets (Cr) ₹5,659 on 31 May 25 Category Hybrid - Multi Asset AMC UTI Asset Management Company Ltd Rating ☆ Risk Moderately High Expense Ratio 1.62 Sharpe Ratio 0.27 Information Ratio 0 Alpha Ratio 0 Min Investment 5,000 Min SIP Investment 500 Exit Load 0-12 Months (1%),12 Months and above(NIL) Growth of 10,000 investment over the years.
Date Value 30 Jun 20 ₹10,000 30 Jun 21 ₹12,466 30 Jun 22 ₹12,171 30 Jun 23 ₹15,046 30 Jun 24 ₹20,612 30 Jun 25 ₹22,367 Returns for UTI Multi Asset Fund
absolute basis & more than 1 year are on CAGR (Compound Annual Growth Rate) basis. as on 2 Jul 25 Duration Returns 1 Month 2.7% 3 Month 7.7% 6 Month 4.3% 1 Year 8.2% 3 Year 22.5% 5 Year 17.3% 10 Year 15 Year Since launch 12.8% Historical performance (Yearly) on absolute basis
Year Returns 2024 20.7% 2023 29.1% 2022 4.4% 2021 11.8% 2020 13.1% 2019 3.9% 2018 -0.5% 2017 17.1% 2016 7.3% 2015 -3.7% Fund Manager information for UTI Multi Asset Fund
Name Since Tenure Sharwan Kumar Goyal 12 Nov 21 3.55 Yr. Jaydeep Bhowal 1 Oct 24 0.67 Yr. Data below for UTI Multi Asset Fund as on 31 May 25
Asset Allocation
Asset Class Value Cash 15.07% Equity 57.64% Debt 16.57% Other 10.73% Equity Sector Allocation
Sector Value Financial Services 15.81% Technology 13.18% Consumer Defensive 8.4% Basic Materials 6.46% Consumer Cyclical 6.17% Health Care 5.45% Industrials 4.24% Energy 3.21% Communication Services 2.91% Real Estate 0.62% Utility 0.31% Debt Sector Allocation
Sector Value Cash Equivalent 15.07% Government 11.1% Corporate 5.46% Credit Quality
Rating Value AAA 100% Top Securities Holdings / Portfolio
Name Holding Value Quantity UTI Gold ETF
- | -11% ₹613 Cr 75,977,316 ICICI Bank Ltd (Financial Services)
Equity, Since 29 Feb 24 | ICICIBANK4% ₹228 Cr 1,575,020
↑ 54,600 Bharti Airtel Ltd (Communication Services)
Equity, Since 30 Apr 24 | BHARTIARTL3% ₹160 Cr 863,456 7.1% Govt Stock 2034
Sovereign Bonds | -3% ₹158 Cr 1,500,000,000 HDFC Bank Ltd (Financial Services)
Equity, Since 30 Apr 25 | HDFCBANK3% ₹151 Cr 774,832
↑ 44,550 Infosys Ltd (Technology)
Equity, Since 31 Mar 24 | INFY3% ₹148 Cr 947,578 ITC Ltd (Consumer Defensive)
Equity, Since 31 Oct 22 | ITC2% ₹134 Cr 3,198,354 Tata Consultancy Services Ltd (Technology)
Equity, Since 29 Feb 24 | TCS2% ₹133 Cr 384,931 HCL Technologies Ltd (Technology)
Equity, Since 31 Oct 24 | HCLTECH2% ₹133 Cr 811,653
↑ 1,400 Bajaj Finserv Ltd (Financial Services)
Equity, Since 29 Feb 24 | BAJAJFINSV2% ₹118 Cr 587,213
↑ 14,000 5. ICICI Prudential Multi-Asset Fund
CAGR/Annualized return of 21.1% since its launch. Ranked 53 in Multi Asset category. Return for 2024 was 16.1% , 2023 was 24.1% and 2022 was 16.8% . ICICI Prudential Multi-Asset Fund
Growth Launch Date 31 Oct 02 NAV (01 Jul 25) ₹761.267 ↑ 0.24 (0.03 %) Net Assets (Cr) ₹59,452 on 31 May 25 Category Hybrid - Multi Asset AMC ICICI Prudential Asset Management Company Limited Rating ☆☆ Risk Moderately High Expense Ratio 1.83 Sharpe Ratio 0.79 Information Ratio 0 Alpha Ratio 0 Min Investment 5,000 Min SIP Investment 100 Exit Load 0-1 Years (1%),1 Years and above(NIL) Growth of 10,000 investment over the years.
Date Value 30 Jun 20 ₹10,000 30 Jun 21 ₹14,344 30 Jun 22 ₹16,696 30 Jun 23 ₹20,396 30 Jun 24 ₹26,999 30 Jun 25 ₹30,213 Returns for ICICI Prudential Multi-Asset Fund
absolute basis & more than 1 year are on CAGR (Compound Annual Growth Rate) basis. as on 2 Jul 25 Duration Returns 1 Month 2.1% 3 Month 6.3% 6 Month 9.6% 1 Year 11.6% 3 Year 22.1% 5 Year 24.7% 10 Year 15 Year Since launch 21.1% Historical performance (Yearly) on absolute basis
Year Returns 2024 16.1% 2023 24.1% 2022 16.8% 2021 34.7% 2020 9.9% 2019 7.7% 2018 -2.2% 2017 28.2% 2016 12.5% 2015 -1.4% Fund Manager information for ICICI Prudential Multi-Asset Fund
Name Since Tenure Sankaran Naren 1 Feb 12 13.34 Yr. Manish Banthia 22 Jan 24 1.36 Yr. Ihab Dalwai 3 Jun 17 8 Yr. Akhil Kakkar 22 Jan 24 1.36 Yr. Sri Sharma 30 Apr 21 4.09 Yr. Gaurav Chikane 2 Aug 21 3.83 Yr. Sharmila D’mello 31 Jul 22 2.84 Yr. Masoomi Jhurmarvala 4 Nov 24 0.57 Yr. Data below for ICICI Prudential Multi-Asset Fund as on 31 May 25
Asset Allocation
Asset Class Value Cash 27.25% Equity 53.85% Debt 7.78% Other 11.13% Equity Sector Allocation
Sector Value Financial Services 18.99% Consumer Cyclical 8.82% Basic Materials 6.87% Industrials 6.31% Energy 6.23% Technology 5.69% Consumer Defensive 4.74% Health Care 4.62% Utility 2.73% Communication Services 2.03% Real Estate 1.27% Debt Sector Allocation
Sector Value Cash Equivalent 23.34% Corporate 6.5% Government 5.18% Credit Quality
Rating Value A 3.01% AA 21.25% AAA 75.74% Top Securities Holdings / Portfolio
Name Holding Value Quantity ICICI Bank Ltd (Financial Services)
Equity, Since 31 May 06 | ICICIBANK4% ₹2,444 Cr 16,906,800 Reliance Industries Ltd (Energy)
Equity, Since 31 Dec 20 | RELIANCE4% ₹2,173 Cr 15,290,305
↓ -322,000 ICICI Prudential Silver ETF
- | -3% ₹2,065 Cr 209,985,419
↑ 14,730,000 Maruti Suzuki India Ltd (Consumer Cyclical)
Equity, Since 31 Aug 21 | MARUTI3% ₹1,990 Cr 1,615,399
↓ -72,800 ICICI Pru Gold ETF
- | -3% ₹1,847 Cr 224,590,882 Larsen & Toubro Ltd (Industrials)
Equity, Since 30 Nov 19 | LT3% ₹1,627 Cr 4,428,318
↓ -365,950 SBI Cards and Payment Services Ltd Ordinary Shares (Financial Services)
Equity, Since 30 Nov 22 | SBICARD3% ₹1,561 Cr 16,942,626 HDFC Bank Ltd (Financial Services)
Equity, Since 31 Jan 22 | HDFCBANK3% ₹1,526 Cr 7,846,299 Gold (1 Kg-1000 Gms) Commodity Aug 2025 Future
Others | -2% ₹1,390 Cr 1,450
↑ 1,450 Axis Bank Ltd (Financial Services)
Equity, Since 31 Dec 20 | AXISBANK2% ₹1,303 Cr 10,927,458
↑ 1,148,199 6. Edelweiss Multi Asset Allocation Fund
CAGR/Annualized return of since its launch. Ranked 71 in Multi Asset category. Return for 2024 was 20.2% , 2023 was 25.4% and 2022 was 5.3% . Edelweiss Multi Asset Allocation Fund
Growth Launch Date 12 Aug 09 NAV (02 Jul 25) ₹64.31 ↓ -0.12 (-0.19 %) Net Assets (Cr) ₹2,749 on 31 May 25 Category Hybrid - Multi Asset AMC Edelweiss Asset Management Limited Rating ☆ Risk Moderately High Expense Ratio 2.18 Sharpe Ratio 0.43 Information Ratio 1.52 Alpha Ratio 1.91 Min Investment 5,000 Min SIP Investment 500 Exit Load NIL Growth of 10,000 investment over the years.
Date Value 30 Jun 20 ₹10,000 30 Jun 21 ₹14,460 30 Jun 22 ₹14,954 30 Jun 23 ₹18,408 30 Jun 24 ₹24,505 30 Jun 25 ₹26,820 Returns for Edelweiss Multi Asset Allocation Fund
absolute basis & more than 1 year are on CAGR (Compound Annual Growth Rate) basis. as on 2 Jul 25 Duration Returns 1 Month 3.1% 3 Month 9.1% 6 Month 4.5% 1 Year 8.6% 3 Year 21.5% 5 Year 21.6% 10 Year 15 Year Since launch Historical performance (Yearly) on absolute basis
Year Returns 2024 20.2% 2023 25.4% 2022 5.3% 2021 27.1% 2020 12.7% 2019 10.4% 2018 -0.1% 2017 26.1% 2016 0.2% 2015 2.2% Fund Manager information for Edelweiss Multi Asset Allocation Fund
Name Since Tenure Bhavesh Jain 14 Oct 15 9.64 Yr. Bharat Lahoti 1 Oct 21 3.67 Yr. Rahul Dedhia 1 Jul 24 0.92 Yr. Pranavi Kulkarni 1 Aug 24 0.83 Yr. Data below for Edelweiss Multi Asset Allocation Fund as on 31 May 25
Asset Allocation
Asset Class Value Cash 7.23% Equity 75.84% Debt 16.92% Other 0.01% Equity Sector Allocation
Sector Value Financial Services 23.39% Industrials 9.07% Health Care 8.39% Technology 7.84% Consumer Cyclical 7.8% Basic Materials 5.02% Consumer Defensive 4.08% Utility 3.17% Communication Services 3.05% Energy 2.77% Real Estate 0.34% Debt Sector Allocation
Sector Value Government 11.37% Cash Equivalent 6.55% Corporate 6.24% Credit Quality
Rating Value AAA 100% Top Securities Holdings / Portfolio
Name Holding Value Quantity National Bank For Agriculture And Rural Development
Debentures | -7% ₹191 Cr 19,000,000 ICICI Bank Ltd (Financial Services)
Equity, Since 31 Mar 15 | ICICIBANK6% ₹176 Cr 1,218,819 HDFC Bank Ltd (Financial Services)
Equity, Since 31 Oct 15 | HDFCBANK5% ₹136 Cr 699,107 Edelweiss Liquid Dir Gr
Investment Fund | -4% ₹101 Cr 298,946 6.54% Govt Stock 2032
Sovereign Bonds | -3% ₹77 Cr 7,500,000 Hdb Financial Services Limited
Debentures | -3% ₹75 Cr 7,500,000 State Bank of India (Financial Services)
Equity, Since 30 Jun 15 | SBIN2% ₹67 Cr 828,301 Bharti Airtel Ltd (Communication Services)
Equity, Since 31 Oct 19 | BHARTIARTL2% ₹62 Cr 333,781 Reliance Industries Ltd (Energy)
Equity, Since 31 Aug 20 | RELIANCE2% ₹59 Cr 416,887 Infosys Ltd (Technology)
Equity, Since 31 May 15 | INFY2% ₹58 Cr 373,077 7. UTI Hybrid Equity Fund
CAGR/Annualized return of 15.2% since its launch. Ranked 12 in Hybrid Equity category. Return for 2024 was 19.7% , 2023 was 25.5% and 2022 was 5.6% . UTI Hybrid Equity Fund
Growth Launch Date 2 Jan 95 NAV (02 Jul 25) ₹408.672 ↓ -1.10 (-0.27 %) Net Assets (Cr) ₹6,254 on 31 May 25 Category Hybrid - Hybrid Equity AMC UTI Asset Management Company Ltd Rating ☆☆☆ Risk Moderately High Expense Ratio 1.91 Sharpe Ratio 0.42 Information Ratio 1.58 Alpha Ratio 1.6 Min Investment 1,000 Min SIP Investment 500 Exit Load 0-12 Months (1%),12 Months and above(NIL) Growth of 10,000 investment over the years.
Date Value 30 Jun 20 ₹10,000 30 Jun 21 ₹15,095 30 Jun 22 ₹15,568 30 Jun 23 ₹19,031 30 Jun 24 ₹25,297 30 Jun 25 ₹27,280 Returns for UTI Hybrid Equity Fund
absolute basis & more than 1 year are on CAGR (Compound Annual Growth Rate) basis. as on 2 Jul 25 Duration Returns 1 Month 2.6% 3 Month 8.4% 6 Month 3.7% 1 Year 7.1% 3 Year 20.4% 5 Year 22% 10 Year 15 Year Since launch 15.2% Historical performance (Yearly) on absolute basis
Year Returns 2024 19.7% 2023 25.5% 2022 5.6% 2021 30.5% 2020 13.2% 2019 2.5% 2018 -5.6% 2017 25.7% 2016 8.8% 2015 2.4% Fund Manager information for UTI Hybrid Equity Fund
Name Since Tenure V Srivatsa 24 Sep 09 15.7 Yr. Sunil Patil 5 Feb 18 7.32 Yr. Data below for UTI Hybrid Equity Fund as on 31 May 25
Asset Allocation
Asset Class Value Cash 2.22% Equity 68.45% Debt 29.33% Equity Sector Allocation
Sector Value Financial Services 22.79% Consumer Cyclical 7.34% Technology 6.34% Energy 5.45% Basic Materials 5.36% Industrials 5.04% Communication Services 4.93% Consumer Defensive 4.57% Health Care 4.26% Utility 1.59% Real Estate 0.78% Debt Sector Allocation
Sector Value Government 21.67% Corporate 7.66% Cash Equivalent 2.22% Credit Quality
Rating Value AA 1% AAA 99% Top Securities Holdings / Portfolio
Name Holding Value Quantity HDFC Bank Ltd (Financial Services)
Equity, Since 29 Feb 20 | HDFCBANK7% ₹432 Cr 2,223,431 ICICI Bank Ltd (Financial Services)
Equity, Since 31 Mar 10 | ICICIBANK6% ₹350 Cr 2,418,644 6.92% Govt Stock 2039
Sovereign Bonds | -5% ₹283 Cr 2,700,000,000
↑ 200,000,000 7.23% Govt Stock 2039
Sovereign Bonds | -4% ₹247 Cr 2,300,000,000 Infosys Ltd (Technology)
Equity, Since 31 Mar 06 | INFY3% ₹191 Cr 1,225,427
↑ 50,443 ITC Ltd (Consumer Defensive)
Equity, Since 31 Aug 06 | ITC3% ₹174 Cr 4,164,106
↓ -179,213 Reliance Industries Ltd (Energy)
Equity, Since 31 Dec 19 | RELIANCE2% ₹154 Cr 1,085,588
↑ 72,263 7.18% Govt Stock 2037
Sovereign Bonds | -2% ₹152 Cr 1,425,000,000 7.32% Govt Stock 2030
Sovereign Bonds | -2% ₹128 Cr 1,200,000,000 6.33% Government Of India
Sovereign Bonds | -2% ₹126 Cr 1,250,000,000
↑ 1,250,000,000 8. DSP BlackRock Equity and Bond Fund
CAGR/Annualized return of 14.7% since its launch. Ranked 9 in Hybrid Equity category. Return for 2024 was 17.7% , 2023 was 25.3% and 2022 was -2.7% . DSP BlackRock Equity and Bond Fund
Growth Launch Date 27 May 99 NAV (02 Jul 25) ₹360.416 ↓ -1.17 (-0.32 %) Net Assets (Cr) ₹11,104 on 31 May 25 Category Hybrid - Hybrid Equity AMC DSP BlackRock Invmt Managers Pvt. Ltd. Rating ☆☆☆☆ Risk Moderately High Expense Ratio 1.79 Sharpe Ratio 0.84 Information Ratio 0.88 Alpha Ratio 6.46 Min Investment 1,000 Min SIP Investment 500 Exit Load 0-12 Months (1%),12 Months and above(NIL) Growth of 10,000 investment over the years.
Date Value 30 Jun 20 ₹10,000 30 Jun 21 ₹14,377 30 Jun 22 ₹13,539 30 Jun 23 ₹16,572 30 Jun 24 ₹21,356 30 Jun 25 ₹23,717 Returns for DSP BlackRock Equity and Bond Fund
absolute basis & more than 1 year are on CAGR (Compound Annual Growth Rate) basis. as on 2 Jul 25 Duration Returns 1 Month 1.3% 3 Month 7.2% 6 Month 5.5% 1 Year 9.8% 3 Year 20.3% 5 Year 18.7% 10 Year 15 Year Since launch 14.7% Historical performance (Yearly) on absolute basis
Year Returns 2024 17.7% 2023 25.3% 2022 -2.7% 2021 24.2% 2020 17% 2019 14.2% 2018 -5.1% 2017 27.6% 2016 8.3% 2015 4.8% Fund Manager information for DSP BlackRock Equity and Bond Fund
Name Since Tenure Abhishek Singh 1 Mar 24 1.25 Yr. Shantanu Godambe 1 Aug 24 0.83 Yr. Data below for DSP BlackRock Equity and Bond Fund as on 31 May 25
Asset Allocation
Asset Class Value Cash 5.62% Equity 65.38% Debt 28.99% Other 0.01% Equity Sector Allocation
Sector Value Financial Services 29.77% Consumer Cyclical 10.11% Health Care 7.4% Consumer Defensive 5.78% Technology 4.66% Basic Materials 3.1% Utility 1.44% Communication Services 1.13% Industrials 1.01% Energy 0.98% Debt Sector Allocation
Sector Value Government 21.91% Corporate 7.1% Cash Equivalent 5.6% Credit Quality
Rating Value AA 7.33% AAA 92.67% Top Securities Holdings / Portfolio
Name Holding Value Quantity HDFC Bank Ltd (Financial Services)
Equity, Since 31 Jan 14 | HDFCBANK7% ₹831 Cr 4,270,582 8.17% Govt Stock 2044
Sovereign Bonds | -5% ₹603 Cr 50,000,000
↑ 2,000,000 ICICI Bank Ltd (Financial Services)
Equity, Since 30 Nov 15 | ICICIBANK5% ₹561 Cr 3,882,861 7.81% Govt Stock 2033
Sovereign Bonds | -4% ₹448 Cr 42,500,000
↑ 5,000,000 Mahindra & Mahindra Ltd (Consumer Cyclical)
Equity, Since 31 Mar 24 | M&M4% ₹392 Cr 1,317,286 SBI Life Insurance Co Ltd (Financial Services)
Equity, Since 30 Apr 24 | SBILIFE4% ₹390 Cr 2,154,505 Axis Bank Ltd (Financial Services)
Equity, Since 30 Sep 18 | AXISBANK3% ₹330 Cr 2,769,013
↓ -458,507 Cipla Ltd (Healthcare)
Equity, Since 31 May 24 | CIPLA3% ₹316 Cr 2,156,479 ITC Ltd (Consumer Defensive)
Equity, Since 31 Mar 24 | ITC3% ₹301 Cr 7,193,074 7.09% Govt Stock 2054
Sovereign Bonds | -3% ₹290 Cr 27,500,000
↑ 2,500,000 9. Nippon India Equity Hybrid Fund
CAGR/Annualized return of 12.4% since its launch. Ranked 8 in Hybrid Equity category. Return for 2024 was 16.1% , 2023 was 24.1% and 2022 was 6.6% . Nippon India Equity Hybrid Fund
Growth Launch Date 8 Jun 05 NAV (02 Jul 25) ₹105.031 ↓ -0.25 (-0.24 %) Net Assets (Cr) ₹3,897 on 31 May 25 Category Hybrid - Hybrid Equity AMC Nippon Life Asset Management Ltd. Rating ☆☆☆☆ Risk Moderately High Expense Ratio 2.02 Sharpe Ratio 0.29 Information Ratio 1.1 Alpha Ratio -0.04 Min Investment 500 Min SIP Investment 100 Exit Load 0-12 Months (1%),12 Months and above(NIL) Growth of 10,000 investment over the years.
Date Value 30 Jun 20 ₹10,000 30 Jun 21 ₹15,037 30 Jun 22 ₹14,977 30 Jun 23 ₹18,446 30 Jun 24 ₹23,936 30 Jun 25 ₹25,523 Returns for Nippon India Equity Hybrid Fund
absolute basis & more than 1 year are on CAGR (Compound Annual Growth Rate) basis. as on 2 Jul 25 Duration Returns 1 Month 2.2% 3 Month 9% 6 Month 3.6% 1 Year 6.1% 3 Year 19.4% 5 Year 20.4% 10 Year 15 Year Since launch 12.4% Historical performance (Yearly) on absolute basis
Year Returns 2024 16.1% 2023 24.1% 2022 6.6% 2021 27.8% 2020 -5.3% 2019 3% 2018 -4.9% 2017 29.5% 2016 4.2% 2015 8.7% Fund Manager information for Nippon India Equity Hybrid Fund
Name Since Tenure Meenakshi Dawar 10 Sep 21 3.81 Yr. Kinjal Desai 25 May 18 7.1 Yr. Sushil Budhia 1 Feb 20 5.41 Yr. Data below for Nippon India Equity Hybrid Fund as on 31 May 25
Asset Allocation
Asset Class Value Cash 5.23% Equity 76.89% Debt 17.88% Equity Sector Allocation
Sector Value Financial Services 25.74% Industrials 10.04% Consumer Cyclical 7.39% Technology 7.18% Health Care 5.04% Energy 3.9% Real Estate 3.73% Communication Services 3.69% Utility 3.55% Consumer Defensive 3.53% Basic Materials 2.82% Debt Sector Allocation
Sector Value Corporate 12.16% Government 5.72% Cash Equivalent 5.23% Credit Quality
Rating Value A 3.26% AA 47.26% AAA 49.48% Top Securities Holdings / Portfolio
Name Holding Value Quantity HDFC Bank Ltd (Financial Services)
Equity, Since 31 Jul 10 | HDFCBANK6% ₹230 Cr 1,182,356 ICICI Bank Ltd (Financial Services)
Equity, Since 30 Apr 12 | ICICIBANK6% ₹227 Cr 1,570,000 Larsen & Toubro Ltd (Industrials)
Equity, Since 28 Feb 13 | LT3% ₹130 Cr 354,838 Bharti Airtel Ltd (Communication Services)
Equity, Since 31 Dec 19 | BHARTIARTL3% ₹123 Cr 665,000 Reliance Industries Ltd (Energy)
Equity, Since 31 Jul 14 | RELIANCE3% ₹115 Cr 806,000 Infosys Ltd (Technology)
Equity, Since 28 Feb 11 | INFY3% ₹114 Cr 730,000 Axis Bank Ltd (Financial Services)
Equity, Since 30 Sep 18 | AXISBANK3% ₹111 Cr 933,200 NTPC Ltd (Utilities)
Equity, Since 31 Aug 20 | NTPC2% ₹94 Cr 2,800,620 State Bank of India (Financial Services)
Equity, Since 31 Jul 16 | SBIN2% ₹82 Cr 1,010,000 Mahindra & Mahindra Ltd (Consumer Cyclical)
Equity, Since 31 Aug 20 | M&M2% ₹70 Cr 235,000 10. L&T Hybrid Equity Fund
CAGR/Annualized return of 12.7% since its launch. Ranked 5 in Hybrid Equity category. Return for 2024 was 22.7% , 2023 was 24.3% and 2022 was -3.7% . L&T Hybrid Equity Fund
Growth Launch Date 7 Feb 11 NAV (02 Jul 25) ₹55.5921 ↓ -0.13 (-0.24 %) Net Assets (Cr) ₹5,396 on 31 May 25 Category Hybrid - Hybrid Equity AMC L&T Investment Management Ltd Rating ☆☆☆☆ Risk Moderately High Expense Ratio 1.88 Sharpe Ratio 0.04 Information Ratio 0 Alpha Ratio 0 Min Investment 5,000 Min SIP Investment 500 Exit Load 0-1 Years (1%),1 Years and above(NIL) Growth of 10,000 investment over the years.
Date Value 30 Jun 20 ₹10,000 30 Jun 21 ₹13,921 30 Jun 22 ₹13,351 30 Jun 23 ₹16,329 30 Jun 24 ₹21,806 30 Jun 25 ₹22,630 Returns for L&T Hybrid Equity Fund
absolute basis & more than 1 year are on CAGR (Compound Annual Growth Rate) basis. as on 2 Jul 25 Duration Returns 1 Month 3.6% 3 Month 13.8% 6 Month -0.5% 1 Year 3.2% 3 Year 19.2% 5 Year 17.7% 10 Year 15 Year Since launch 12.7% Historical performance (Yearly) on absolute basis
Year Returns 2024 22.7% 2023 24.3% 2022 -3.7% 2021 23.1% 2020 13.6% 2019 6.5% 2018 -3.8% 2017 27.8% 2016 4.3% 2015 9.9% Fund Manager information for L&T Hybrid Equity Fund
Name Since Tenure Shriram Ramanathan 30 May 16 9.09 Yr. Gautam Bhupal 1 Oct 23 1.75 Yr. Sonal Gupta 1 Oct 23 1.75 Yr. Mohd Asif Rizwi 1 May 24 1.16 Yr. Data below for L&T Hybrid Equity Fund as on 31 May 25
Asset Allocation
Asset Class Value Cash 3.85% Equity 75.15% Debt 20.99% Equity Sector Allocation
Sector Value Industrials 20.28% Financial Services 20.12% Consumer Cyclical 17.4% Technology 6.35% Health Care 3.78% Consumer Defensive 3.25% Utility 2.31% Communication Services 1.08% Real Estate 0.23% Basic Materials 0.19% Energy 0.15% Debt Sector Allocation
Sector Value Corporate 13.92% Government 7.96% Cash Equivalent 2.97% Credit Quality
Rating Value AAA 100% Top Securities Holdings / Portfolio
Name Holding Value Quantity Eternal Ltd (Consumer Cyclical)
Equity, Since 29 Feb 24 | 5433205% ₹244 Cr 10,254,500 Bharat Electronics Ltd (Industrials)
Equity, Since 31 Aug 22 | BEL4% ₹232 Cr 6,030,700 BSE Ltd (Financial Services)
Equity, Since 31 Jan 24 | BSE4% ₹227 Cr 849,000 Mahindra & Mahindra Ltd (Consumer Cyclical)
Equity, Since 30 Jun 24 | M&M4% ₹216 Cr 724,900 GE Vernova T&D India Ltd (Industrials)
Equity, Since 31 Jan 24 | 5222754% ₹211 Cr 939,900 ICICI Bank Ltd (Financial Services)
Equity, Since 30 Apr 11 | ICICIBANK4% ₹199 Cr 1,374,100 HDFC Bank Ltd (Financial Services)
Equity, Since 28 Feb 11 | HDFCBANK4% ₹196 Cr 1,008,000 Trent Ltd (Consumer Cyclical)
Equity, Since 31 Jan 24 | TRENT3% ₹170 Cr 301,344 CG Power & Industrial Solutions Ltd (Industrials)
Equity, Since 31 Jul 22 | CGPOWER3% ₹156 Cr 2,278,900 Persistent Systems Ltd (Technology)
Equity, Since 30 Sep 21 | PERSISTENT2% ₹127 Cr 225,611 11. Franklin India Equity Hybrid Fund
CAGR/Annualized return of 13.8% since its launch. Ranked 16 in Hybrid Equity category. Return for 2024 was 17.7% , 2023 was 22.5% and 2022 was 4.7% . Franklin India Equity Hybrid Fund
Growth Launch Date 10 Dec 99 NAV (02 Jul 25) ₹273.03 ↓ -0.88 (-0.32 %) Net Assets (Cr) ₹2,187 on 31 May 25 Category Hybrid - Hybrid Equity AMC Franklin Templeton Asst Mgmt(IND)Pvt Ltd Rating ☆☆☆ Risk Moderately High Expense Ratio 2.15 Sharpe Ratio 0.32 Information Ratio 0.92 Alpha Ratio 0.38 Min Investment 5,000 Min SIP Investment 500 Exit Load 0-1 Years (1%),1 Years and above(NIL) Growth of 10,000 investment over the years.
Date Value 30 Jun 20 ₹10,000 30 Jun 21 ₹14,967 30 Jun 22 ₹14,647 30 Jun 23 ₹17,580 30 Jun 24 ₹23,144 30 Jun 25 ₹24,787 Returns for Franklin India Equity Hybrid Fund
absolute basis & more than 1 year are on CAGR (Compound Annual Growth Rate) basis. as on 2 Jul 25 Duration Returns 1 Month 1.9% 3 Month 8.1% 6 Month 3.2% 1 Year 6.5% 3 Year 19.1% 5 Year 19.8% 10 Year 15 Year Since launch 13.8% Historical performance (Yearly) on absolute basis
Year Returns 2024 17.7% 2023 22.5% 2022 4.7% 2021 23.8% 2020 13.7% 2019 7.9% 2018 -1.6% 2017 21% 2016 7.6% 2015 4.8% Fund Manager information for Franklin India Equity Hybrid Fund
Name Since Tenure Ajay Argal 4 Oct 24 0.66 Yr. Anuj Tagra 7 Mar 24 1.24 Yr. Chandni Gupta 7 Mar 24 1.24 Yr. Sandeep Manam 18 Oct 21 3.62 Yr. Rajasa Kakulavarapu 6 Sep 21 3.74 Yr. Data below for Franklin India Equity Hybrid Fund as on 31 May 25
Asset Allocation
Asset Class Value Cash 3.68% Equity 67.38% Debt 28.94% Equity Sector Allocation
Sector Value Financial Services 21.53% Consumer Cyclical 10.61% Industrials 7.58% Technology 6.79% Health Care 4.63% Communication Services 3.72% Consumer Defensive 3.37% Utility 3.06% Energy 2.79% Basic Materials 2.56% Real Estate 0.74% Debt Sector Allocation
Sector Value Corporate 26.59% Cash Equivalent 3.68% Government 2.35% Credit Quality
Rating Value AA 24.78% AAA 75.22% Top Securities Holdings / Portfolio
Name Holding Value Quantity HDFC Bank Ltd (Financial Services)
Equity, Since 31 Mar 07 | HDFCBANK7% ₹161 Cr 827,500 ICICI Bank Ltd (Financial Services)
Equity, Since 31 Oct 18 | ICICIBANK6% ₹130 Cr 900,000 Larsen & Toubro Ltd (Industrials)
Equity, Since 31 Dec 19 | LT3% ₹76 Cr 206,500
↓ -3,500 Axis Bank Ltd (Financial Services)
Equity, Since 30 Jun 14 | AXISBANK3% ₹66 Cr 550,000 Bharti Airtel Ltd (Communication Services)
Equity, Since 31 Oct 05 | BHARTIARTL3% ₹66 Cr 353,000 Infosys Ltd (Technology)
Equity, Since 29 Feb 12 | INFY3% ₹64 Cr 410,000
↓ -12,900 Reliance Industries Ltd (Energy)
Equity, Since 31 May 22 | RELIANCE3% ₹61 Cr 430,000
↑ 30,000 Bharti Telecom Limited
Debentures | -2% ₹54 Cr 5,000 Bajaj Finance Limited
Debentures | -2% ₹53 Cr 5,000 ICICI Home Finance Company Limited
Debentures | -2% ₹52 Cr 5,000
बैलेंस्ड म्यूचुअल फंड में ऑनलाइन निवेश कैसे करें?
Fincash.com पर आजीवन मुफ्त निवेश खाता खोलें।
अपना पंजीकरण और केवाईसी प्रक्रिया पूरी करें
Upload Documents (PAN, Aadhaar, etc.). और, आप निवेश करने के लिए तैयार हैं!
यहां प्रदान की गई जानकारी सटीक है, यह सुनिश्चित करने के लिए सभी प्रयास किए गए हैं। हालांकि, डेटा की शुद्धता के संबंध में कोई गारंटी नहीं दी जाती है। कृपया कोई भी निवेश करने से पहले योजना सूचना दस्तावेज के साथ सत्यापित करें।


AMFI Registration No. 112358 | CIN: U74999MH2016PTC282153
Shepard Technologies Pvt. Ltd. (with ARN code 112358) makes no warranties or representations, express or implied, on products offered through the platform. It accepts no liability for any damages or losses, however caused, in connection with the use of, or on the reliance of its product or related services. Terms and conditions of the website are applicable.
©2025 Shepard Technologies Private Limited. All Rights Reserved