भारत में म्यूचुअल फंड
म्यूचुअल फंड एक सामूहिक पूल है (इसलिए शब्द म्यूचुअल) निवेशकों द्वारा प्रतिभूतियों की खरीद (फंड के माध्यम से) के लिए एक सामान्य उद्देश्य के साथ दिया गया है। म्यूचुअल फंड में निवेशकों द्वारा सामूहिक पूल का निर्माण किया जाता है, उन्हें भारत में भारतीय प्रतिभूति और विनिमय बोर्ड द्वारा विनियमित किया जाता है (सेबी)।
वित्त, योजना और निवेश के लिए नए लोग अक्सर "म्यूचुअल फंड" शब्द सुनते हैं और पूछते हैं कि "म्यूचुअल फंड क्या है?", "जो सबसे अच्छा म्यूचुअल फंड हैं?", "क्या हैंम्यूचुअल फंड के प्रकार"," कंपनियां क्या हैं? ","म्यूचुअल फंड में निवेश कैसे करें? "आदि म्युचुअल फंड आज निवेशकों के साथ आम हो रहे हैं और हाल के वर्षों में एक एवेन्यू बन गए हैं जिसके द्वारा निवेशक ऋण और इक्विटी बाजारों में भाग ले सकते हैं।
हम यहां म्यूचुअल फंड से संबंधित अधिकांश प्रश्नों के उत्तर देने का प्रयास करेंगे।
अवलोकन
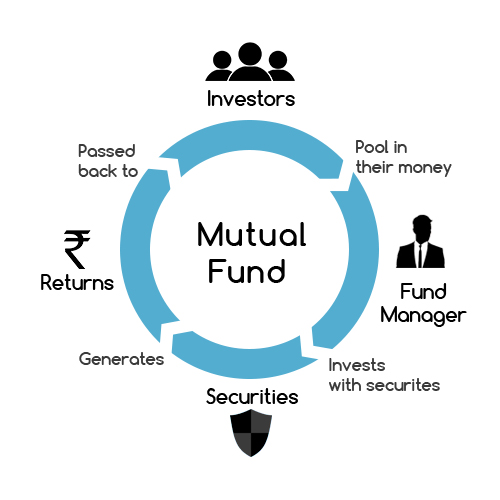
म्यूचुअल फंड एक ऐसा वाहन है, जो सिक्योरिटीज खरीदने के लिए निवेशकों से पैसा इकट्ठा करता है। इन निवेशकों के पास एक सामान्य उद्देश्य है, और धन के इस पूल को फंड मैनेजर द्वारा सलाह दी जाती है जो यह तय करता है कि पैसे का निवेश कैसे किया जाए। अच्छे फंड प्रबंधन के साथ, म्यूचुअल फंड मैनेजर (या पोर्टफोलियो मैनेजर) निवेशकों के लिए रिटर्न उत्पन्न करता है, जो निवेशकों को वापस कर दिया जाता है। म्यूचुअल फंड एक विनियमित उद्योग हैं, म्यूचुअल फंड कंपनियों के लिए विभिन्न नियम, दिशानिर्देश और नीतियां हैं, फंड मैनेजर और विशेष रूप से प्रबंधित फंड भी हैं। ये विनियम भारतीय प्रतिभूति और विनिमय बोर्ड (SEBI) द्वारा बनाए गए हैं जो म्यूचुअल फंड्स के लिए नियामक हैं।
म्यूचुअल फंड्स अर्थ
दो शब्दों के रूप में, म्यूचुअल कॉनोट्स को एक साथ मिल रहा है और फंड पैसा कमाता है। इसलिए परिभाषा के अनुसार, एक म्यूचुअल फंड निवेशकों के लिए एक सामान्य उद्देश्य के साथ पैसा निवेश करने के लिए एक वाहन है। भारत में, म्यूचुअल फंड एक लंबा इतिहास के साथ एक विनियमित उद्योग है।
म्यूचुअल फंड्स मूल बातें
म्यूच्यूअल फण्ड की मूल बातें म्युचुअल फ़ंड की मूल समझ, म्युचुअल फ़ंड के फ़ायदे और म्युचुअल फ़ंड के फ़ायदे-फ़ायदे के रूप में मिलती हैं। ज्ञान प्राप्त करने के लिए व्यक्ति विभिन्न स्रोतों का उपयोग कर सकता है। इस लेख में, हमने म्यूचुअल फंड बेसिक्स के अधिकांश पहलुओं को कवर करने की कोशिश की है।
म्यूचुअल फंड्स हिस्ट्री
भारत में म्युचुअल फंड 1963 में संसद के एक अधिनियम द्वारा अस्तित्व में आया था। यह भारत सरकार द्वारा भारतीय रिज़र्व बैंक (RBI) की सहायता से किया गया था। 1987 तक, भारत में कोई अन्य खिलाड़ी नहीं था और यह एकाधिकार था। उस समय सार्वजनिक क्षेत्र के लिए यह उद्योग खुल गया और एक अन्य खिलाड़ी की प्रविष्टि देखी गईएसबीआई म्यूचुअल फंड। इसके तुरंत बाद अन्य खिलाड़ी भी आ गए। 1993 में, सरकार ने संपत्ति प्रबंधन कंपनियों को खोलने के लिए निजी क्षेत्र को अनुमति दी। अगले 2 वर्षों में, 11 और निजीसेक्टर फंड 1996 में आया और सेबी के साथ एक और युग चिह्नित किया गयाएम्फी आ रा हूँ।

भारत में म्यूचुअल फंड्स एसोसिएशन का गठन उद्योग को विकसित करने और न्यूनतम मानकों को स्थापित करने के लिए किया गया था।
Mutual Funds Sahi Hai
mutual fund sahi hai एएमएफआई (एसोसिएशन ऑफ म्युचुअल फंड्स इन इंडिया) द्वारा हाल ही में शुरू किया गया अभियान म्यूचुअल फंड्स के बारे में निवेशक जागरूकता पैदा करने के लिए है। यह अभियान विभिन्न मीडिया जैसे टीवी, अखबार, रेडियो और पूरे वेब पर भी है। अभियान केवल अंग्रेजी में ही नहीं, बल्कि विभिन्न स्थानीय भाषाओं में भी है। म्यूचुअल फंड्स साही है अभियान का उद्देश्य उद्योग के विभिन्न पहलुओं पर लोगों को शिक्षित करना और म्यूचुअल फंडों की पैठ बढ़ाना है।
म्युचुअल फंड निवेश
म्यूचुअल फंड निवेशकों को पैसे बचाने और समय के साथ रिटर्न कमाने का मार्ग प्रदान करते हैं। एक एकमुश्त या एक निश्चित राशि मासिक में निवेश कर सकते हैं, जिसे आमतौर पर एक व्यवस्थित निवेश योजना के रूप में जाना जाता है (सिप)। एकमुश्त या एसआईपी का उपयोग करते हुए, वे बचत की आदत को बढ़ाते हैं। निवेशक म्यूच्यूअल फण्ड निवेशों को INR 5000 से कम और SIP के मामले में INR 500 जितना कम कर सकते हैं। विभिन्न म्यूचुअल फंड कैलकुलेटर उपलब्ध हैं, जो पहली बार निवेशकों को यह तय करने में मदद करते हैं कि किस राशि को शुरू करना है। ये म्यूचुअल फंड कैलकुलेटर निवेशकों को निवेश शुरू करने में मदद करते हैं।
सिस्टमैटिक इन्वेस्टमेंट प्लान्स: म्युचुअल फंड्स में एसआईपी
म्यूचुअल फ़ंड "सिस्टेमेटिक इन्वेस्टमेंट प्लान" या SIP नामक एक मार्ग प्रदान करता है जहाँ निवेशक म्यूचुअल फंड की स्कीम में हर महीने एक निश्चित धनराशि डाल सकते हैं। एसआईपी निवेशकों के लिए निवेश का एक बहुत ही सुविधाजनक तरीका है क्योंकि पहले निवेश के बाद, बाद में निवेश स्वचालित होता है और निवेशक वापस बैठ सकता है और आराम कर सकता है। सिस्टमैटिक इन्वेस्टमेंट प्लान (SIP) भी रुपए की औसत लागत की पेशकश करते हैं और SIP के कई लाभ हैं।
म्यूचुअल फंड रिटर्न
5 साल के रिटर्न भर में श्रेणियाँ
| श्रेणी: इक्विटी | औसत। 5Y रिट। | श्रेणी: संतुलित | औसत। 5Y रिट। | श्रेणी: निश्चित आय | औसत। 5Y रिट | श्रेणी: मनी मार्केट | औसत। ५ य रिट। |
|---|---|---|---|---|---|---|---|
| ईएलएसएस (टैक्स सेविंग) | 18.88 | रूढ़िवादी आवंटन | 10.56 | कॉर्पोरेट क्रेडिट | 9.54 | तरल | 8.3 |
| समानता - अन्य | 18.72 | हाइब्रिड आवंटन | 11.15 | डायनेमिक बॉन्ड | 9.43 | अल्ट्राशोर्ट बॉन्ड | 8.64 |
| फ्लेक्सी कैप | 18.89 | मध्यम आबंटन | 15. 62 | इंटरमीडिएट बॉन्ड | 8.93 | - | |
| बड़ी टोपी | 15.33 | - | इंटरमीडिएट सरकारी बॉन्ड | 9.91 | - | ||
| - | - | लॉन्ग टर्म गवर्नमेंट बॉन्ड | 9.87 | - | |||
| - | - | शॉर्ट टर्म बॉन्ड | 8.72 | - | |||
| - | - | शॉर्ट टर्म गवर्नमेंट बॉन्ड | 8.63 |
(* 10 जून 2017 तक वापसी)
पिछले कुछ दशकों में म्यूचुअल फंड खुदरा निवेशकों के लिए रिटर्न उत्पन्न करने के लिए एक अभूतपूर्व वाहन रहे हैं। पिछले वर्षों में रिटर्न का विचार देने के लिए, उपरोक्त तालिका म्युचुअल फंड की विभिन्न श्रेणियों में रिटर्न का विचार देती है।
Talk to our investment specialist
म्यूचुअल फंड के प्रकार
6 अक्टूबर 2017 को, भारतीय प्रतिभूति विनिमय बोर्ड (SEBI) ने विभिन्न म्यूचुअल फ़ंड द्वारा शुरू की गई समान योजनाओं में एकरूपता लाने के लिए Mutual Funds में नई और व्यापक श्रेणियां पेश कीं। यह उद्देश्य और यह सुनिश्चित करना है कि निवेशक किसी योजना में निवेश करने से पहले उत्पादों की तुलना करना और उपलब्ध विभिन्न विकल्पों का मूल्यांकन करना आसान बना सकते हैं।
सेबी का इरादा निवेशकों के लिए म्यूचुअल फंड निवेश को आसान बनाना है। निवेशक अपनी जरूरतों, वित्तीय लक्ष्यों और जोखिम क्षमता के अनुसार निवेश कर सकते हैं। यह अनिवार्य हैम्यूचुअल फंड हाउस उनकी सभी योजनाओं (मौजूदा और भविष्य की योजना) को 5 व्यापक श्रेणियों और 36 उप-श्रेणियों में वर्गीकृत करना। आइए सेबी द्वारा शुरू की गई नई विशिष्ट श्रेणियों को देखेंइक्विटी फंड, डेट फंड, हाइब्रिड फंड, सॉल्यूशन ओरिएंटेड फंड और अन्य योजनाएं
1 इक्विटी फंड
इक्विटी म्यूचुअल फंड हो सकते हैंलार्ज कैप फंड,मिड कैप फंड, छोटे कैप फंड या मल्टी-कैप, ये उन निवेशकों के लिए हैं जो इक्विटी बाजारों में निवेश करना चाहते हैं। जैसा कि नाम से पता चलता है, इक्विटी फंड इक्विटी मार्केट में निवेश करते हैं। विशेषज्ञ निधि प्रबंधक हैं जो स्टॉक चयन में विशेषज्ञ हैं। उन्होंने म्यूचुअल फंड निवेश जनादेश को देखते हुए अपने फंड के लिए सर्वश्रेष्ठ शेयरों का प्रयास किया। सेबी ने इक्विटी फंड के लिए 1- अलग श्रेणी निर्धारित की है।
1.1। लार्ज कैप इक्विटी फंड
लार्ज-कैप फंड्स लार्ज-कैप कंपनियों में निवेश करते हैं जो कि बड़ी बैलेंस शीट, बड़ी टीमों और जगह में एक स्पष्ट संगठन संरचना वाली बड़ी आकार की कंपनियां हैं। लार्ज-कैप शेयरों में निवेश योजना की कुल संपत्ति का न्यूनतम 80 प्रतिशत होना चाहिए।
1.2। मिड कैप फंड
दूसरी ओर, मिड-कैप फंड, छोटे आकार की कंपनियों में निवेश करते हैं, ये अपने क्षेत्र में उभरते हुए सितारे हैं और इनमें वृद्धि की संभावना है। आकार में छोटे होने के कारण, ये मिड-कैप कंपनियां बहुत फुर्तीली हैं और उत्पाद और रणनीति में बहुत तेज़ी से बदलाव कर सकती हैं। इसे देखते हुए, मिड-कैप निवेश एक बड़ा जोखिम भी लाता है। यह स्कीम अपनी कुल संपत्ति का 65 प्रतिशत मिडकैप शेयरों में निवेश करेगी।
1.3। लार्ज और मिड कैप फंड
ये ऐसी योजनाएं हैं जो बड़े और मिड कैप शेयरों में निवेश करती हैं। ये फंड मिड और लार्ज कैप शेयरों में न्यूनतम 35 प्रतिशत का निवेश करेंगे।
SEBI ने स्पष्ट वर्गीकरण निर्धारित किया है कि लार्ज कैप, मिड कैप और स्माल कैप क्या है:
| बाजार पूंजीकरण | विवरण |
|---|---|
| लार्ज कैप कंपनी | पूर्ण बाजार पूंजीकरण के संदर्भ में पहली से 100 वीं कंपनी |
| मिड कैप कंपनी | पूर्ण बाजार पूंजीकरण के संदर्भ में 101 वीं से 250 वीं कंपनी |
| छोटी टोपी कंपनी | पूर्ण बाजार पूंजीकरण के संदर्भ में 251 वीं कंपनी आगे |
1.4। मल्टी कैप इक्विटी फंड
मल्टी-कैप फंडों में, फंड मैनेजर बिना किसी प्रतिबंध (केवल एकमात्र प्रतिबंध होने के कारण फंड कैपेट होता है) में लार्ज-कैप और मिड-कैप में निवेश करता है। अपनी कुल संपत्ति का न्यूनतम 65 प्रतिशत इक्विटी के लिए आवंटित किया जाना चाहिए।
1.5। इक्विटी लिंक्ड सेविंग स्कीम
इक्विटी लिंक्ड सेविंग स्कीम्स (ईएलएसएस) एक टैक्स सेविंग फंड है जो तीन साल की लॉक-इन अवधि के साथ आता है। अपनी कुल संपत्ति का न्यूनतम 80 प्रतिशत इक्विटी में निवेश करना होता है।
1.6। डिविडेंड यील्ड फंड
यह फंड मुख्य रूप से लाभांश देने वाले शेयरों में निवेश करेगा। यह योजना अपनी कुल संपत्ति का न्यूनतम 65 प्रतिशत इक्विटी में निवेश करेगी, लेकिन लाभांश देने वाले शेयरों में।
1.7। मूल्य निधि
यह एक इक्विटी फंड है जो मूल्य निवेश रणनीति का पालन करेगा।
1.8। कॉन्ट्रा फंड
यह इक्विटी स्कीम कॉन्ट्रेरियन इनवेस्टमेंट स्ट्रैटेजी को फॉलो करेगी। मूल्य / कंट्रा अपनी कुल संपत्ति का कम से कम 65 प्रतिशत इक्विटी में निवेश करेगा, लेकिन एक म्यूचुअल फंड हाउस या तो एक की पेशकश कर सकता हैमूल्य निधि या एफंड के खिलाफ, लेकिन दोनों नहीं।
1.9। फोकस्ड फंड
यह फंड बड़े, मिड, स्मॉल या मल्टी-कैप शेयरों पर केंद्रित होगा, लेकिन इसमें अधिकतम 30 स्टॉक हो सकते हैं।फ़ोकस फ़ंड अपनी कुल संपत्ति का कम से कम 65 प्रतिशत इक्विटी में निवेश कर सकता है।
1.10। सेक्टर / थीमेटिक फंड
ये वे फंड हैं जो किसी विशेष क्षेत्र या थीम में निवेश करते हैं। इन योजनाओं की कुल संपत्ति का कम से कम 80 प्रतिशत किसी विशेष क्षेत्र या विषय में निवेश किया जाएगा।
2 डेट फंड
फिर डेट फंड होते हैं, जो डेट इंस्ट्रूमेंट में निवेश करते हैं। भारतीय बाजारों में विभिन्न प्रकार के डेट फंड मौजूद हैं। ये फंड विभिन्न डेट और मनी मार्केट इंस्ट्रूमेंट्स जैसे सरकारी सिक्योरिटीज (जी-सेक), कमर्शियल पेपर (सीपी), डिपॉजिट सर्टिफिकेट (सीडी) और अन्य इंस्ट्रूमेंट्स में निवेश करते हैं। सेबी के नए वर्गीकरण के अनुसार,ऋण निधि योजनाओं की 16 श्रेणियां होंगी। यहाँ सूची है:
2.1। ओवरनाइट फंड
यह ऋण योजना एक दिन की परिपक्वता वाली रातोंरात प्रतिभूतियों में निवेश करेगी।
2.2। लिक्विड फंड
जैसा कि नाम से पता चलता है ये बहुत "तरल" हैं। ये ऐसे फंड हैं जो ज्यादातर मामलों में निवेशकों के लिए रिटर्न जेनरेट करने की कोशिश करेंगे, यहां तक कि वह एक दिन के लिए निवेश करेंगे! नियमों के अनुसार,तरल धन 91 दिनों से कम की परिपक्वता के साथ डेट / मनी मार्केट सिक्योरिटीज में निवेश करें। ये उन निवेशकों के लिए उपयुक्त हैं जो कुछ दिनों के लिए अपना पैसा पार्क करना चाहते हैं। इन निधियों में आमतौर पर कोई निकास भार नहीं होता है।
2.3। अल्ट्रा शॉर्ट ड्यूरेशन फंड
जोखिम पैमाने पर, इन फंडों में एक जोखिम होता है जो कि तरल फंडों से थोड़ा ऊपर होता है। अल्ट्रा शॉर्ट टर्म फंड लिक्विड फंडों की तुलना में थोड़ी अधिक परिपक्वता के साथ डेट सिक्योरिटीज में निवेश करते हैं। इस प्रकार के म्यूचुअल फंड एक दिन में मामूली नुकसान दे सकते हैं यदि ब्याज दरों में बहुत तेज वृद्धि हो। हालांकि, ये तीन महीने से छह महीने के बीच पैसा लगाने वाले निवेशकों के लिए बहुत अच्छा है। अधिकांश अल्ट्रा शॉर्ट टर्म फंडों में कोई एग्जिट लोड नहीं होता है, भले ही वे ऐसा करते हों, यह एक सप्ताह के लिए सबसे अच्छे पखवाड़े तक है।
2.4। कम अवधि की निधि
कम अवधि की ऋण प्रतिभूतियां अल्ट्रा शॉर्ट फंड की तुलना में थोड़ी अधिक परिपक्वता के साथ आती हैं। यह योजना छह से 12 महीनों के बीच मैकाले अवधि के साथ ऋण और मुद्रा बाजार की प्रतिभूतियों में निवेश करेगी।
2.5। मुद्रा बाज़ार निधि
यह योजना एक साल तक की परिपक्वता वाले सीडी, सीपी, टी-बिल जैसे मुद्रा बाजार के उपकरणों में निवेश करेगी।
2.6। शॉर्ट टर्म फंड
एक साल या उससे अधिक समय के लिए निवेश करने के इच्छुक निवेशकों के लिए शॉर्ट टर्म म्यूचुअल फंड बहुत अच्छा है। ये ऋण प्रतिभूतियों में भी निवेश करते हैं और ब्याज दर के जोखिम को थोड़ा कम करते हैं। यदि ब्याज दरें नीचे की ओर बढ़ती हैं तो ब्याज के कारण अर्जित रिटर्न के साथ-साथ पोर्टफोलियो पर पूंजीगत प्रशंसा भी होगी। ये फंड एक से तीन साल की अवधि के मैकॉले के साथ डेट और मनी मार्केट इंस्ट्रूमेंट्स में निवेश करते हैं।
2.7। मध्यम अवधि निधि
यह योजना तीन से चार साल की अवधि के मैकॉले के साथ ऋण और मुद्रा बाजार में निवेश करेगी।
2.8। मीडियम से लॉन्ग ड्यूरेशन फंड
यह योजना चार से सात साल की अवधि के मैकॉले के साथ ऋण और मुद्रा बाजार के साधनों में निवेश करेगी।
2.9। लॉन्ग ड्यूरेशन फंड
यह योजना ऋण और मुद्रा बाजार के साधनों में सात साल से अधिक की मैकाले अवधि के साथ निवेश करेगी।
2.10। डायनेमिक बॉन्ड फंड
डायनेमिक बॉन्ड फंड एक म्यूचुअल फंड स्कीम है जो अलग-अलग मैच्योरिटी पीरियड से जुड़ी फिक्स्ड इनकम सिक्योरिटीज में अपने फंड्स को निवेश करती है, जिसका मतलब है कि वे सभी अवधि के दौरान निवेश करते हैं। यहां, फंड मैनेजर यह तय करता है कि ब्याज दर परिदृश्य और भविष्य के ब्याज दर के आंदोलनों की उनकी धारणा के आधार पर उन्हें किन फंडों में निवेश करने की आवश्यकता है। इस निर्णय के आधार पर, वे डेट इंस्ट्रूमेंट के विभिन्न परिपक्वता अवधि के फंड में निवेश करते हैं। यह म्यूचुअल फंड स्कीम उन लोगों के लिए उपयुक्त है जो ब्याज दर परिदृश्य के बारे में हैरान हैं। ऐसे व्यक्ति डायनेमिक बॉन्ड फंड्स के जरिए पैसा कमाने के लिए फंड मैनेजरों के दृष्टिकोण पर भरोसा कर सकते हैं।
2.11। कॉर्पोरेट बॉन्ड फंड
कॉर्पोरेट बॉन्ड फंड अनिवार्य रूप से प्रमुख कंपनियों द्वारा जारी किए गए ऋण का प्रमाण पत्र है। ये व्यवसायों के लिए धन जुटाने के एक तरीके के रूप में जारी किए जाते हैं। अच्छा रिटर्न और कम जोखिम वाले प्रकार के निवेश की बात आने पर कॉर्पोरेट बॉन्ड फंड एक बढ़िया विकल्प है। यह ऋण योजना मुख्य रूप से उच्चतम रेटेड कॉर्पोरेट बॉन्ड में निवेश करती है। फंड अपनी कुल संपत्ति का न्यूनतम 80 प्रतिशत उच्चतम रेटेड कॉर्पोरेट बॉन्ड में निवेश कर सकता है।
2.12। क्रेडिट रिस्क फंड
यह योजना उच्च श्रेणी के कॉर्पोरेट बॉन्ड के नीचे निवेश करेगी। क्रेडिट रिस्क फंड को उच्चतम रेटेड उपकरणों के नीचे अपनी संपत्ति का कम से कम 65 प्रतिशत निवेश करना चाहिए।
2.13। बैंकिंग और पीयूएस फंड
यह योजना मुख्य रूप से बैंकों, सार्वजनिक वित्तीय संस्थागत, सार्वजनिक क्षेत्र के उपक्रमों के ऋण साधनों में निवेश करती है।
2.14। निधि पर लागू होता है
यह फंड सरकारी प्रतिभूतियों में निवेश करता है। फंड के जनादेश के अनुसार विभिन्न फंडों की परिपक्वता। और इसलिए फंड में जोखिम है। गिल्ट फंड का उपयोग आम तौर पर अनुभवी निवेशकों द्वारा निवेश करने के लिए किया जाता है, जो जानते हैं कि वे क्या कर रहे हैं और ब्याज दर की गतिविधियों पर स्पष्ट हैं। गिल्ट फंड की अवधि या परिपक्वता जितनी अधिक होगी, जोखिम उतना अधिक होगा। यह फंड अपनी कुल संपत्ति का न्यूनतम 80 प्रतिशत सरकारी प्रतिभूतियों में निवेश करेगा।
2.15। 10 साल के लगातार अवधि के साथ गिल्ट फंड
यह योजना 10 साल की परिपक्वता के साथ सरकारी प्रतिभूतियों में निवेश करेगी। 10-वर्षीय कॉन्स्टेंट अवधि के साथ गिल्ट फंड सरकारी प्रतिभूतियों में न्यूनतम 80 प्रतिशत का निवेश करेगा।
2.16। फ्लोटर फंड
यह ऋण योजना मुख्य रूप से फ्लोटिंग रेट इंस्ट्रूमेंट्स में निवेश करती है। फ्लोटर फंड अपनी कुल संपत्ति का 65 प्रतिशत फ्लोटिंग रेट इंस्ट्रूमेंट्स में निवेश करेगा।
3. हाइब्रिड फंड
बीच में जो निवेशक बाड़ पर रहना चाहते हैं, उनके लिए संतुलित फंड या हाइब्रिड फंड हैं। सेबी के नए विनियमन के अनुसार, हाइब्रिड फंड की छह श्रेणियां होंगी:
3.1। कंजर्वेटिव हाइब्रिड फंड
हाइब्रिड फंड भी आमतौर पर के रूप में जाना जाता हैबैलेंस्ड फंड। हाइब्रिड फंड एक प्रकार के म्यूचुअल फंड हैं जो इक्विटी और डेट म्यूचुअल फंड दोनों में निवेश करते हैं। दूसरे शब्दों में, यह फंड ऋण और इक्विटी दोनों के संयोजन के रूप में कार्य करता है। रूढ़िवादी संकर धन प्रमुख रूप से ऋण उपकरणों में निवेश किया जाएगा। उनकी कुल संपत्ति का लगभग 75 से 90 प्रतिशत ऋण उपकरणों में और लगभग 10 से 25 प्रतिशत इक्विटी से संबंधित उपकरणों में निवेश किया जाएगा। जिन निवेशकों को इक्विटी फंड में निवेश करने का डर है, उनके लिए हाइब्रिड फंड एक बढ़िया विकल्प है। यह फंड जोखिम वाले हिस्से को कम करेगा और समय के साथ इष्टतम रिटर्न हासिल करने में भी मदद करेगा।
3.2। बैलेंस्ड हाइब्रिड फंड
यह फंड अपनी कुल संपत्ति का लगभग 40-60 प्रतिशत ऋण और इक्विटी दोनों साधनों में निवेश करेगा।
3.3। आक्रामक हाइब्रिड फंड
यह फंड इक्विटी से संबंधित इंस्ट्रूमेंट्स में अपनी कुल संपत्ति का लगभग 65 से 85 प्रतिशत और डेट इंस्ट्रूमेंट्स में अपनी संपत्ति का लगभग 20 से 35 प्रतिशत निवेश करेगा। म्यूचुअल फंड हाउस संतुलित हाइब्रिड या आक्रामक हाइब्रिड फंड की पेशकश कर सकते हैं, दोनों नहीं।
3.4। डायनेमिक एसेट एलोकेशन या बैलेंस्ड एडवांटेज फंड
यह योजना इक्विटी और डेट इंस्ट्रूमेंट्स में अपने निवेश को गतिशील रूप से प्रबंधित करेगी।
3.5। मल्टी एसेट एलोकेशन
यह योजना तीन परिसंपत्ति वर्गों में निवेश कर सकती है, जिसका अर्थ है कि वे इक्विटी और ऋण के अलावा एक अतिरिक्त परिसंपत्ति वर्ग में निवेश कर सकते हैं। प्रत्येक परिसंपत्ति वर्ग में फंड को कम से कम 10 प्रतिशत निवेश करना चाहिए। विदेशी प्रतिभूतियों को एक अलग परिसंपत्ति वर्ग के रूप में नहीं माना जाएगा।
3.6। आर्बिट्राज फंड
एक आर्बिट्राज फंड भारत में एक लोकप्रिय अल्पकालिक वित्तीय निवेश है। आर्बिट्रेज फंड्स म्यूचुअल फंड्स हैं जो म्यूचुअल फंड रिटर्न जेनरेट करने के लिए कैश मार्केट और डेरिवेटिव मार्केट के बीच डिफरेंशियल प्राइस का फायदा उठाते हैं। आर्बिट्राज फंडों द्वारा उत्पन्न रिटर्न शेयर बाजार की अस्थिरता पर निर्भर करता है। आर्बिट्रेज म्यूचुअल फंड प्रकृति में हाइब्रिड हैं और उच्च या लगातार अस्थिरता के समय में, ये फंड निवेशकों को अपेक्षाकृत जोखिम मुक्त रिटर्न देते हैं। यह फंड इक्विटी से संबंधित उपकरणों में अपनी संपत्ति का कम से कम 65 प्रतिशत निवेश करता है।
3.7। इक्विटी बचत
यह योजना इक्विटी, आर्बिट्राज और डेट में निवेश करेगी। इक्विटी बचत शेयरों में कुल संपत्ति का कम से कम 65 प्रतिशत और ऋण में न्यूनतम 10 प्रतिशत का निवेश करेगी। यह योजना स्कीम सूचना दस्तावेज में न्यूनतम हेज और अनहेल्डेड निवेश बताएगी।
4. समाधान उन्मुख योजनाएं
4.1। सेवानिवृत्ति कोष
यह एक रिटायरमेंट सॉल्यूशन ओरिएंटेड स्कीम है जिसमें पांच साल की लॉक-इन या रिटायरमेंट की उम्र तक होगी।
4.2। बच्चों का कोष
यह बच्चों को पांच साल के लिए लॉक-ऑन रखने या जब तक बच्चा बहुमत की आयु प्राप्त नहीं करता है, जो भी पहले हो।
5. अन्य योजनाएँ
5.1। इंडेक्स फंड / ईटीएफ
इंडेक्स फंड्स म्यूचुअल फंड योजनाओं को संदर्भित करते हैं, जिनके पोर्टफोलियो को आधार के रूप में बाजार सूचकांक का उपयोग करके बनाया गया है। दूसरे शब्दों में, एक इंडेक्स फंड का प्रदर्शन किसी विशेष इंडेक्स के प्रदर्शन पर निर्भर है। इन योजनाओं को निष्क्रिय रूप से प्रबंधित किया जाता है। इन फंडों में उसी अनुपात में शेयर होते हैं जैसे वे किसी विशेष सूचकांक में होते हैं। भारत में, कई योजनाएं निफ्टी या सेंसेक्स को अपने पोर्टफोलियो के निर्माण के लिए आधार के रूप में उपयोग करती हैं। उदाहरण के लिए, यदि निफ्टी पोर्टफोलियो में एसबीआई के शेयर हैं, जिनका अनुपात 12% है; निफ्टी इंडेक्स फंड में भी 12% इक्विटी शेयर होंगे। यह फंड अपनी कुल संपत्ति का कम से कम 95 प्रतिशत किसी विशेष सूचकांक की प्रतिभूतियों में निवेश कर सकता है।
5.2। FoFs (प्रवासी घरेलू)
फंड ऑफ फंड्स उन लोगों के लिए एक विकल्प है जिनकी निवेश राशि बहुत बड़ी नहीं है और म्यूचुअल फंडों की संख्या के बजाय एक फंड (फंडों का एक फंड) का प्रबंधन करना आसान है। म्यूचुअल फंड निवेश रणनीति के इस रूप में, निवेशकों को एक ही फंड की छतरी के नीचे कई फंड रखने होते हैं, इसलिए फंड का नाम। बहु-प्रबंधक निवेश के नाम से अक्सर जाना जाता है; इसे म्यूचुअल फंड श्रेणियों में से एक माना जाता है। मल्टी-मैनेजर इन्वेस्टमेंट के प्रमुख लाभों में से एक यह है कि कम टिकट के आकार पर, निवेशक म्यूचुअल फंड योजनाओं के सरगम में विविधता ला सकता है। यह फंड अंतर्निहित परिसंपत्ति में अपनी कुल संपत्ति का न्यूनतम 95 प्रतिशत निवेश कर सकता है।
कुछ अन्य म्युचुअल फंड पर विचार करने के लिए:
5.3। इंटरनेशनल फंड
अंतर्राष्ट्रीय फंड अंतरराष्ट्रीय प्रतिभूतियों में या मास्टर फंड में निवेश करते हैं जो भारत से बाहर अधिवासित हैं। इनमें से अधिकांश फंड एक परिसंपत्ति वर्ग के रूप में इक्विटी में निवेश करते हैं। ये विभिन्न प्रकार के हो सकते हैं जैसे उभरते बाजार फंड, विकसित बाजार फंड, कमोडिटी से संबंधित अंतर्राष्ट्रीय फंड आदि। डीएसपी ब्लैकरॉक वर्ल्ड गोल्ड फंड एक ऐसे फंड का उदाहरण है जो भारत से बाहर स्थित मास्टर फंड में निवेश करता है। यह फंड मुख्य रूप से सोने और अन्य कीमती धातुओं में निवेश करता है। आज, भारत में कई अंतर्राष्ट्रीय म्यूचुअल फंड निवेशक को उपलब्ध हैं।
5.4। गोल्ड फंड
गोल्ड फंड्स फंडों का एक नया वर्ग है। ये गोल्ड ईटीएफ में निवेश करते हैं। जबकि गोल्ड ईटीएफ खुदरा निवेशक के लिए उपलब्ध है, ईटीएफ खरीदने के इच्छुक किसी भी व्यक्ति को स्टॉक एक्सचेंज के माध्यम से करना होगा, जिसके लिए ब्रोकिंग अकाउंट होना आवश्यक है। म्यूचुअल फंड में, ऐसी कोई आवश्यकता नहीं है, एक निवेशक केवल एक आवेदन पत्र भर सकता है और भुगतान करने के बाद आवंटित इकाइयों को प्राप्त कर सकता है।
सर्वश्रेष्ठ म्युचुअल फंड
निवेशक हमेशा निवेश करने के लिए शीर्ष म्यूचुअल फंड या सर्वश्रेष्ठ म्यूचुअल फंड की खोज में रहते हैं। कैसे सबसे अच्छा म्यूचुअल फंड का चयन करना अपने आप में एक और अभ्यास है। निवेश के लिए लक्ष्य, फंड हाउस, म्यूचुअल फंड की रेटिंग और इस पर अनुशासित दृष्टिकोण का पालन करने जैसी विभिन्न चीजों पर ध्यान देने की जरूरत है। इसके बाद ही कोई भी व्यक्ति म्यूचुअल फंड को चुन सकता है।
शीर्ष 10 म्युचुअल फंड: इक्विटी
निवेश करने के लिए शीर्ष 10 इक्विटी म्यूचुअल फंड हमेशा कुछ ऐसे निवेशक होते हैं जो निवेश की कोशिश करते हैं। एक श्रेणी में उपलब्ध निधियों की पूरी सूची सेशीर्ष 10 म्युचुअल फंड सूची को फ़िल्टर करने और शीर्ष पाने के लिए कई गतिविधियाँ करना शामिल हैबेस्ट परफॉर्मिंग म्युचुअल फंड। निवेश करने के लिए शीर्ष 10 इक्विटी म्यूचुअल फंड हैं:
Fund NAV Net Assets (Cr) 3 MO (%) 6 MO (%) 1 YR (%) 3 YR (%) 5 YR (%) 2025 (%) DSP US Flexible Equity Fund Growth ₹93.0913
↑ 0.35 ₹1,291 8.6 18.1 45 26 18.3 33.8 Franklin Asian Equity Fund Growth ₹43.9225
↓ -0.21 ₹979 9.1 16.8 39.7 19.4 6.9 23.7 DSP Natural Resources and New Energy Fund Growth ₹106.786
↑ 0.17 ₹2,401 -3 6.1 17.9 19.6 16.4 17.5 Aditya Birla Sun Life Small Cap Fund Growth ₹95.5729
↓ -1.00 ₹5,731 8.7 18.9 8.1 15.5 12.5 -3.7 Invesco India Growth Opportunities Fund Growth ₹108.78
↓ -1.53 ₹11,164 8.3 14 5.4 22.9 17.1 4.7 Tata India Tax Savings Fund Growth ₹46.3023
↓ -0.39 ₹4,597 1.6 4 4.3 12.5 12.9 4.9 Kotak Equity Opportunities Fund Growth ₹353.002
↓ -3.56 ₹31,263 0.9 2.2 2.7 14.5 14.2 5.6 Aditya Birla Sun Life Banking And Financial Services Fund Growth ₹62.92
↓ -0.93 ₹3,676 -0.4 -0.4 1.8 10.4 11.6 17.5 SBI Small Cap Fund Growth ₹179.993
↓ -2.10 ₹40,157 6.7 13.2 1.3 12.3 13.7 -4.9 Bandhan Tax Advantage (ELSS) Fund Growth ₹153.225
↓ -0.60 ₹6,911 0.8 0.3 0.6 9.8 11.8 8 Note: Returns up to 1 year are on absolute basis & more than 1 year are on CAGR basis. as on 21 Jul 26 Research Highlights & Commentary of 10 Funds showcased
Commentary DSP US Flexible Equity Fund Franklin Asian Equity Fund DSP Natural Resources and New Energy Fund Aditya Birla Sun Life Small Cap Fund Invesco India Growth Opportunities Fund Tata India Tax Savings Fund Kotak Equity Opportunities Fund Aditya Birla Sun Life Banking And Financial Services Fund SBI Small Cap Fund Bandhan Tax Advantage (ELSS) Fund Point 1 Bottom quartile AUM (₹1,291 Cr). Bottom quartile AUM (₹979 Cr). Bottom quartile AUM (₹2,401 Cr). Upper mid AUM (₹5,731 Cr). Upper mid AUM (₹11,164 Cr). Lower mid AUM (₹4,597 Cr). Top quartile AUM (₹31,263 Cr). Lower mid AUM (₹3,676 Cr). Highest AUM (₹40,157 Cr). Upper mid AUM (₹6,911 Cr). Point 2 Established history (13+ yrs). Established history (18+ yrs). Established history (18+ yrs). Established history (19+ yrs). Established history (18+ yrs). Established history (11+ yrs). Oldest track record among peers (21 yrs). Established history (12+ yrs). Established history (16+ yrs). Established history (17+ yrs). Point 3 Top rated. Rating: 5★ (top quartile). Rating: 5★ (upper mid). Rating: 5★ (upper mid). Rating: 5★ (upper mid). Rating: 5★ (lower mid). Rating: 5★ (lower mid). Rating: 5★ (bottom quartile). Rating: 5★ (bottom quartile). Rating: 5★ (bottom quartile). Point 4 Risk profile: High. Risk profile: High. Risk profile: High. Risk profile: Moderately High. Risk profile: Moderately High. Risk profile: Moderately High. Risk profile: Moderately High. Risk profile: High. Risk profile: Moderately High. Risk profile: Moderately High. Point 5 5Y return: 18.35% (top quartile). 5Y return: 6.92% (bottom quartile). 5Y return: 16.36% (upper mid). 5Y return: 12.46% (lower mid). 5Y return: 17.06% (top quartile). 5Y return: 12.95% (lower mid). 5Y return: 14.21% (upper mid). 5Y return: 11.56% (bottom quartile). 5Y return: 13.72% (upper mid). 5Y return: 11.85% (bottom quartile). Point 6 3Y return: 26.00% (top quartile). 3Y return: 19.37% (upper mid). 3Y return: 19.63% (upper mid). 3Y return: 15.48% (upper mid). 3Y return: 22.95% (top quartile). 3Y return: 12.45% (lower mid). 3Y return: 14.49% (lower mid). 3Y return: 10.41% (bottom quartile). 3Y return: 12.30% (bottom quartile). 3Y return: 9.84% (bottom quartile). Point 7 1Y return: 44.99% (top quartile). 1Y return: 39.68% (top quartile). 1Y return: 17.90% (upper mid). 1Y return: 8.08% (upper mid). 1Y return: 5.38% (upper mid). 1Y return: 4.30% (lower mid). 1Y return: 2.75% (lower mid). 1Y return: 1.83% (bottom quartile). 1Y return: 1.29% (bottom quartile). 1Y return: 0.64% (bottom quartile). Point 8 Alpha: -4.10 (bottom quartile). Alpha: 0.00 (lower mid). Alpha: 0.00 (lower mid). Alpha: 0.00 (bottom quartile). Alpha: 6.78 (top quartile). Alpha: 4.23 (top quartile). Alpha: 0.20 (upper mid). Alpha: 3.47 (upper mid). Alpha: 0.00 (bottom quartile). Alpha: 0.89 (upper mid). Point 9 Sharpe: 1.93 (top quartile). Sharpe: 1.54 (top quartile). Sharpe: 0.72 (upper mid). Sharpe: 0.22 (upper mid). Sharpe: 0.12 (upper mid). Sharpe: -0.09 (bottom quartile). Sharpe: -0.19 (bottom quartile). Sharpe: -0.06 (lower mid). Sharpe: -0.07 (lower mid). Sharpe: -0.29 (bottom quartile). Point 10 Information ratio: 0.15 (upper mid). Information ratio: 0.00 (upper mid). Information ratio: 0.00 (lower mid). Information ratio: 0.00 (lower mid). Information ratio: 1.15 (top quartile). Information ratio: 0.22 (upper mid). Information ratio: -0.05 (bottom quartile). Information ratio: 0.24 (top quartile). Information ratio: 0.00 (bottom quartile). Information ratio: -0.51 (bottom quartile). DSP US Flexible Equity Fund
Franklin Asian Equity Fund
DSP Natural Resources and New Energy Fund
Aditya Birla Sun Life Small Cap Fund
Invesco India Growth Opportunities Fund
Tata India Tax Savings Fund
Kotak Equity Opportunities Fund
Aditya Birla Sun Life Banking And Financial Services Fund
SBI Small Cap Fund
Bandhan Tax Advantage (ELSS) Fund
शीर्ष 10 म्युचुअल फंड: ऋण
निवेश करने के लिए शीर्ष 10 ऋण म्युचुअल फंड हमेशा कुछ निवेशकों को तलाशने की कोशिश करते हैं। शीर्ष 10 म्यूचुअल फंडों को मिलने वाली श्रेणी में उपलब्ध धन की पूरी सूची से सूची को फ़िल्टर करने और शीर्ष और सर्वश्रेष्ठ प्रदर्शन करने वाले म्युचुअल फंड प्राप्त करने के लिए कई गतिविधियां शामिल हैं। निवेश करने के लिए शीर्ष 10 ऋण म्यूचुअल फंड हैं:
Fund NAV Net Assets (Cr) 3 MO (%) 6 MO (%) 1 YR (%) 3 YR (%) 2025 (%) Debt Yield (YTM) Mod. Duration Eff. Maturity Aditya Birla Sun Life Savings Fund Growth ₹585.816
↑ 0.06 ₹17,816 1.6 3.3 6.2 7.3 7.4 7.45% 5M 26D 6M 18D JM Liquid Fund Growth ₹75.8952
↑ 0.01 ₹1,759 1.6 3.3 6.2 6.8 6.4 6.43% 26D 27D Aditya Birla Sun Life Money Manager Fund Growth ₹395.356
↑ 0.02 ₹27,383 1.5 3.3 6.1 7.3 7.4 6.95% 6M 25D 6M 29D UTI Banking & PSU Debt Fund Growth ₹23.3107
↓ 0.00 ₹1,101 1.5 3.1 5.4 7 7.8 7.69% 9M 14D 10M 2D HDFC Banking and PSU Debt Fund Growth ₹24.3143
↓ -0.01 ₹5,255 1.8 3 4.7 6.9 7.5 7.78% 3Y 7D 4Y 1M 2D Aditya Birla Sun Life Corporate Bond Fund Growth ₹119.201
↓ -0.08 ₹23,841 1.9 3.1 4.6 7.2 7.4 7.34% 4Y 1M 6D 6Y 7M 28D ICICI Prudential Long Term Plan Growth ₹39.0103
↓ -0.03 ₹13,518 2 3 4.6 7.1 7.2 8.22% 5Y 11M 16D 13Y 7M 28D HDFC Corporate Bond Fund Growth ₹34.3275
↓ -0.02 ₹30,721 2 3 4.5 7.1 7.3 7.79% 4Y 18D 6Y 11M 12D Aditya Birla Sun Life Medium Term Plan Growth ₹43.5514
↓ -0.01 ₹3,213 2.2 3.9 8.3 9.8 10.9 8.05% 3Y 1M 20D 4Y 7M 24D SBI Credit Risk Fund Growth ₹49.214
↑ 0.00 ₹2,175 2.3 4.5 7 7.8 7.9 8.7% 2Y 22D 2Y 8M 23D Note: Returns up to 1 year are on absolute basis & more than 1 year are on CAGR basis. as on 22 Jul 26 Research Highlights & Commentary of 10 Funds showcased
Commentary Aditya Birla Sun Life Savings Fund JM Liquid Fund Aditya Birla Sun Life Money Manager Fund UTI Banking & PSU Debt Fund HDFC Banking and PSU Debt Fund Aditya Birla Sun Life Corporate Bond Fund ICICI Prudential Long Term Plan HDFC Corporate Bond Fund Aditya Birla Sun Life Medium Term Plan SBI Credit Risk Fund Point 1 Upper mid AUM (₹17,816 Cr). Bottom quartile AUM (₹1,759 Cr). Top quartile AUM (₹27,383 Cr). Bottom quartile AUM (₹1,101 Cr). Lower mid AUM (₹5,255 Cr). Upper mid AUM (₹23,841 Cr). Upper mid AUM (₹13,518 Cr). Highest AUM (₹30,721 Cr). Lower mid AUM (₹3,213 Cr). Bottom quartile AUM (₹2,175 Cr). Point 2 Established history (23+ yrs). Established history (28+ yrs). Established history (20+ yrs). Established history (12+ yrs). Established history (12+ yrs). Oldest track record among peers (29 yrs). Established history (16+ yrs). Established history (16+ yrs). Established history (17+ yrs). Established history (22+ yrs). Point 3 Top rated. Rating: 5★ (top quartile). Rating: 5★ (upper mid). Rating: 5★ (upper mid). Rating: 5★ (upper mid). Rating: 5★ (lower mid). Rating: 5★ (lower mid). Rating: 5★ (bottom quartile). Rating: 4★ (bottom quartile). Rating: 4★ (bottom quartile). Point 4 Risk profile: Moderately Low. Risk profile: Low. Risk profile: Low. Risk profile: Moderate. Risk profile: Moderately Low. Risk profile: Moderately Low. Risk profile: Moderate. Risk profile: Moderately Low. Risk profile: Moderate. Risk profile: Moderate. Point 5 1Y return: 6.22% (upper mid). 1Y return: 6.15% (upper mid). 1Y return: 6.13% (upper mid). 1Y return: 5.38% (lower mid). 1Y return: 4.74% (lower mid). 1Y return: 4.60% (bottom quartile). 1Y return: 4.57% (bottom quartile). 1Y return: 4.48% (bottom quartile). 1Y return: 8.29% (top quartile). 1Y return: 6.97% (top quartile). Point 6 1M return: 0.65% (lower mid). 1M return: 0.52% (bottom quartile). 1M return: 0.64% (lower mid). 1M return: 0.59% (bottom quartile). 1M return: 0.57% (bottom quartile). 1M return: 0.72% (upper mid). 1M return: 0.74% (upper mid). 1M return: 0.69% (upper mid). 1M return: 0.83% (top quartile). 1M return: 0.89% (top quartile). Point 7 Sharpe: 0.91 (upper mid). Sharpe: 1.90 (top quartile). Sharpe: 0.69 (upper mid). Sharpe: 0.07 (lower mid). Sharpe: -0.11 (bottom quartile). Sharpe: -0.10 (bottom quartile). Sharpe: -0.02 (lower mid). Sharpe: -0.14 (bottom quartile). Sharpe: 1.29 (top quartile). Sharpe: 1.03 (upper mid). Point 8 Information ratio: 0.00 (top quartile). Information ratio: 0.02 (top quartile). Information ratio: 0.00 (upper mid). Information ratio: 0.00 (upper mid). Information ratio: 0.00 (upper mid). Information ratio: 0.00 (lower mid). Information ratio: 0.00 (lower mid). Information ratio: 0.00 (bottom quartile). Information ratio: 0.00 (bottom quartile). Information ratio: 0.00 (bottom quartile). Point 9 Yield to maturity (debt): 7.45% (lower mid). Yield to maturity (debt): 6.43% (bottom quartile). Yield to maturity (debt): 6.95% (bottom quartile). Yield to maturity (debt): 7.69% (lower mid). Yield to maturity (debt): 7.78% (upper mid). Yield to maturity (debt): 7.34% (bottom quartile). Yield to maturity (debt): 8.22% (top quartile). Yield to maturity (debt): 7.79% (upper mid). Yield to maturity (debt): 8.05% (upper mid). Yield to maturity (debt): 8.70% (top quartile). Point 10 Modified duration: 0.49 yrs (top quartile). Modified duration: 0.07 yrs (top quartile). Modified duration: 0.57 yrs (upper mid). Modified duration: 0.79 yrs (upper mid). Modified duration: 3.02 yrs (lower mid). Modified duration: 4.10 yrs (bottom quartile). Modified duration: 5.96 yrs (bottom quartile). Modified duration: 4.05 yrs (bottom quartile). Modified duration: 3.14 yrs (lower mid). Modified duration: 2.06 yrs (upper mid). Aditya Birla Sun Life Savings Fund
JM Liquid Fund
Aditya Birla Sun Life Money Manager Fund
UTI Banking & PSU Debt Fund
HDFC Banking and PSU Debt Fund
Aditya Birla Sun Life Corporate Bond Fund
ICICI Prudential Long Term Plan
HDFC Corporate Bond Fund
Aditya Birla Sun Life Medium Term Plan
SBI Credit Risk Fund
The primary investment objective of the Scheme is to seek to provide long term capital growth by investing predominantly in the JPMorgan Funds - Emerging Markets Opportunities Fund, an equity fund which invests primarily in an aggressively managed portfolio of emerging market companies Research Highlights for Edelweiss Emerging Markets Opportunities Equity Off-shore Fund Below is the key information for Edelweiss Emerging Markets Opportunities Equity Off-shore Fund Returns up to 1 year are on "The primary investment objective of the Scheme is to seek capital appreciation by investing predominantly in units of MLIIF - WGF. The Scheme may, at the discretion of the Investment Manager, also invest in the units of other similar overseas mutual fund schemes, which may constitute a significant part of its corpus. The Scheme may also invest a certain portion of its corpus in money market securities and/or units of money market/liquid schemes of DSP Merrill Lynch Mutual Fund, in order to meet liquidity requirements from time to time. However, there is no assurance that the investment objective of the Scheme will be realized." Research Highlights for DSP World Gold Fund Below is the key information for DSP World Gold Fund Returns up to 1 year are on The investment objective of the scheme is to provide long-term capital appreciation by investing in an overseas mutual fund scheme that invests in a diversified portfolio of securities as prescribed by SEBI from time to time in global emerging markets. Research Highlights for Kotak Global Emerging Market Fund Below is the key information for Kotak Global Emerging Market Fund Returns up to 1 year are on The primary investment objective of the Scheme is to seek capital appreciation by investing predominantly in units of BGF – USFEF. The Scheme may, at the discretion of the Investment Manager also invest in the units of other similar overseas mutual fund schemes, which may constitute a significant part of its corpus. The Scheme may also invest a certain portion of its corpus in money market securities and/or money market/liquid schemes of DSP BlackRock Mutual Fund, in order to meet liquidity requirements from time to time. However, there is no assurance that the investment objective of the Scheme will be realized. It shall be noted ‘similar overseas mutual fund schemes’ shall have investment objective, investment strategy and risk profile/consideration similar to those of BGF – USFEF. Research Highlights for DSP US Flexible Equity Fund Below is the key information for DSP US Flexible Equity Fund Returns up to 1 year are on The investment objective of the scheme is to generate returns by investing in units of Kotak Gold Exchange Traded Fund. Research Highlights for Kotak Gold Fund Below is the key information for Kotak Gold Fund Returns up to 1 year are on ICICI Prudential Regular Gold Savings Fund (the Scheme) is a fund of funds scheme with the primary objective to generate returns by investing in units of ICICI Prudential Gold Exchange Traded Fund (IPru Gold ETF).
However, there can be no assurance that the investment objectives of the Scheme will be realized. Research Highlights for ICICI Prudential Regular Gold Savings Fund Below is the key information for ICICI Prudential Regular Gold Savings Fund Returns up to 1 year are on The investment objective of the Scheme will be to generate returns that correspond closely to the returns generated by IDBI Gold Exchange Traded Fund (IDBI GOLD ETF). Research Highlights for IDBI Gold Fund Below is the key information for IDBI Gold Fund Returns up to 1 year are on To generate returns that closely correspond to returns generated by Axis Gold ETF. Research Highlights for Axis Gold Fund Below is the key information for Axis Gold Fund Returns up to 1 year are on The investment objective of the Scheme is to seek to provide returns that closely correspond to returns provided by Reliance ETF Gold BeES. Research Highlights for Nippon India Gold Savings Fund Below is the key information for Nippon India Gold Savings Fund Returns up to 1 year are on An Open ended Fund of Funds Scheme with the investment objective to provide returns that tracks returns provided by Birla Sun Life Gold ETF (BSL Gold ETF). Research Highlights for Aditya Birla Sun Life Gold Fund Below is the key information for Aditya Birla Sun Life Gold Fund Returns up to 1 year are on 1. Edelweiss Emerging Markets Opportunities Equity Off-shore Fund
Edelweiss Emerging Markets Opportunities Equity Off-shore Fund
Growth Launch Date 7 Jul 14 NAV (21 Jul 26) ₹28.0113 ↑ 0.50 (1.81 %) Net Assets (Cr) ₹259 on 30 Jun 26 Category Equity - Global AMC Edelweiss Asset Management Limited Rating ☆☆☆ Risk High Expense Ratio 1.04 Sharpe Ratio 2.2 Information Ratio -0.41 Alpha Ratio 6.3 Min Investment 5,000 Min SIP Investment 1,000 Exit Load 0-1 Years (1%),1 Years and above(NIL) Growth of 10,000 investment over the years.
Date Value Returns for Edelweiss Emerging Markets Opportunities Equity Off-shore Fund
absolute basis & more than 1 year are on CAGR (Compound Annual Growth Rate) basis. as on 21 Jul 26 Duration Returns 1 Month -4.8% 3 Month 6.5% 6 Month 22.9% 1 Year 59.9% 3 Year 25.8% 5 Year 10% 10 Year 15 Year Since launch 8.9% Historical performance (Yearly) on absolute basis
Year Returns 2025 41.1% 2024 5.9% 2023 5.5% 2022 -16.8% 2021 -5.9% 2020 21.7% 2019 25.1% 2018 -7.2% 2017 30% 2016 9.8% Fund Manager information for Edelweiss Emerging Markets Opportunities Equity Off-shore Fund
Name Since Tenure Data below for Edelweiss Emerging Markets Opportunities Equity Off-shore Fund as on 30 Jun 26
Equity Sector Allocation
Sector Value Asset Allocation
Asset Class Value Top Securities Holdings / Portfolio
Name Holding Value Quantity 2. DSP World Gold Fund
DSP World Gold Fund
Growth Launch Date 14 Sep 07 NAV (21 Jul 26) ₹48.8587 ↑ 1.27 (2.67 %) Net Assets (Cr) ₹1,433 on 30 Jun 26 Category Equity - Global AMC DSP BlackRock Invmt Managers Pvt. Ltd. Rating ☆☆☆ Risk High Expense Ratio 1.41 Sharpe Ratio 1.22 Information Ratio -0.5 Alpha Ratio 2.12 Min Investment 1,000 Min SIP Investment 500 Exit Load 0-12 Months (1%),12 Months and above(NIL) Growth of 10,000 investment over the years.
Date Value Returns for DSP World Gold Fund
absolute basis & more than 1 year are on CAGR (Compound Annual Growth Rate) basis. as on 21 Jul 26 Duration Returns 1 Month -13.5% 3 Month -25.1% 6 Month -23.7% 1 Year 58.4% 3 Year 38.9% 5 Year 21.6% 10 Year 15 Year Since launch 8.6% Historical performance (Yearly) on absolute basis
Year Returns 2025 167.1% 2024 15.9% 2023 7% 2022 -7.7% 2021 -9% 2020 31.4% 2019 35.1% 2018 -10.7% 2017 -4% 2016 52.7% Fund Manager information for DSP World Gold Fund
Name Since Tenure Data below for DSP World Gold Fund as on 30 Jun 26
Equity Sector Allocation
Sector Value Asset Allocation
Asset Class Value Top Securities Holdings / Portfolio
Name Holding Value Quantity 3. Kotak Global Emerging Market Fund
Kotak Global Emerging Market Fund
Growth Launch Date 26 Sep 07 NAV (21 Jul 26) ₹38.625 ↑ 0.91 (2.42 %) Net Assets (Cr) ₹1,767 on 30 Jun 26 Category Equity - Global AMC Kotak Mahindra Asset Management Co Ltd Rating ☆☆☆ Risk High Expense Ratio 1.64 Sharpe Ratio 1.88 Information Ratio -0.25 Alpha Ratio -1.76 Min Investment 5,000 Min SIP Investment 1,000 Exit Load 0-1 Years (1%),1 Years and above(NIL) Growth of 10,000 investment over the years.
Date Value Returns for Kotak Global Emerging Market Fund
absolute basis & more than 1 year are on CAGR (Compound Annual Growth Rate) basis. as on 21 Jul 26 Duration Returns 1 Month -10.4% 3 Month 3.8% 6 Month 14.1% 1 Year 45.9% 3 Year 23.3% 5 Year 10.3% 10 Year 15 Year Since launch 7.3% Historical performance (Yearly) on absolute basis
Year Returns 2025 39.1% 2024 5.9% 2023 10.8% 2022 -15% 2021 -0.5% 2020 29.1% 2019 21.4% 2018 -14.4% 2017 30.4% 2016 -1.2% Fund Manager information for Kotak Global Emerging Market Fund
Name Since Tenure Data below for Kotak Global Emerging Market Fund as on 30 Jun 26
Equity Sector Allocation
Sector Value Asset Allocation
Asset Class Value Top Securities Holdings / Portfolio
Name Holding Value Quantity 4. DSP US Flexible Equity Fund
DSP US Flexible Equity Fund
Growth Launch Date 3 Aug 12 NAV (21 Jul 26) ₹93.0913 ↑ 0.35 (0.37 %) Net Assets (Cr) ₹1,291 on 30 Jun 26 Category Equity - Global AMC DSP BlackRock Invmt Managers Pvt. Ltd. Rating ☆☆☆☆☆ Risk High Expense Ratio 1.55 Sharpe Ratio 1.93 Information Ratio 0.15 Alpha Ratio -4.1 Min Investment 1,000 Min SIP Investment 500 Exit Load 0-12 Months (1%),12 Months and above(NIL) Growth of 10,000 investment over the years.
Date Value Returns for DSP US Flexible Equity Fund
absolute basis & more than 1 year are on CAGR (Compound Annual Growth Rate) basis. as on 21 Jul 26 Duration Returns 1 Month -0.4% 3 Month 8.6% 6 Month 18.1% 1 Year 45% 3 Year 26% 5 Year 18.3% 10 Year 15 Year Since launch 17.3% Historical performance (Yearly) on absolute basis
Year Returns 2025 33.8% 2024 17.8% 2023 22% 2022 -5.9% 2021 24.2% 2020 22.6% 2019 27.5% 2018 -1.1% 2017 15.5% 2016 9.8% Fund Manager information for DSP US Flexible Equity Fund
Name Since Tenure Data below for DSP US Flexible Equity Fund as on 30 Jun 26
Equity Sector Allocation
Sector Value Asset Allocation
Asset Class Value Top Securities Holdings / Portfolio
Name Holding Value Quantity 5. Kotak Gold Fund
Kotak Gold Fund
Growth Launch Date 25 Mar 11 NAV (22 Jul 26) ₹55.1189 ↑ 0.72 (1.33 %) Net Assets (Cr) ₹6,422 on 30 Jun 26 Category Gold - Gold AMC Kotak Mahindra Asset Management Co Ltd Rating ☆ Risk Moderately High Expense Ratio 0.5 Sharpe Ratio 1.38 Information Ratio 0 Alpha Ratio 0 Min Investment 5,000 Min SIP Investment 1,000 Exit Load 0-6 Months (2%),6-12 Months (1%),12 Months and above(NIL) Growth of 10,000 investment over the years.
Date Value Returns for Kotak Gold Fund
absolute basis & more than 1 year are on CAGR (Compound Annual Growth Rate) basis. as on 21 Jul 26 Duration Returns 1 Month -1.5% 3 Month -4.5% 6 Month -4.5% 1 Year 43.6% 3 Year 32.6% 5 Year 22.9% 10 Year 15 Year Since launch 11.8% Historical performance (Yearly) on absolute basis
Year Returns 2025 70.4% 2024 18.9% 2023 13.9% 2022 11.7% 2021 -4.7% 2020 26.6% 2019 24.1% 2018 7.3% 2017 2.5% 2016 10.2% Fund Manager information for Kotak Gold Fund
Name Since Tenure Data below for Kotak Gold Fund as on 30 Jun 26
Asset Allocation
Asset Class Value Top Securities Holdings / Portfolio
Name Holding Value Quantity 6. ICICI Prudential Regular Gold Savings Fund
ICICI Prudential Regular Gold Savings Fund
Growth Launch Date 11 Oct 11 NAV (22 Jul 26) ₹44.4117 ↑ 0.53 (1.20 %) Net Assets (Cr) ₹6,265 on 30 Jun 26 Category Gold - Gold AMC ICICI Prudential Asset Management Company Limited Rating ☆ Risk Moderately High Expense Ratio 0.38 Sharpe Ratio 1.22 Information Ratio 0 Alpha Ratio 0 Min Investment 5,000 Min SIP Investment 100 Exit Load 0-15 Months (2%),15 Months and above(NIL) Growth of 10,000 investment over the years.
Date Value Returns for ICICI Prudential Regular Gold Savings Fund
absolute basis & more than 1 year are on CAGR (Compound Annual Growth Rate) basis. as on 21 Jul 26 Duration Returns 1 Month -1.5% 3 Month -4.8% 6 Month -4.2% 1 Year 43.6% 3 Year 32.8% 5 Year 23.3% 10 Year 15 Year Since launch 10.6% Historical performance (Yearly) on absolute basis
Year Returns 2025 72% 2024 19.5% 2023 13.5% 2022 12.7% 2021 -5.4% 2020 26.6% 2019 22.7% 2018 7.4% 2017 0.8% 2016 8.9% Fund Manager information for ICICI Prudential Regular Gold Savings Fund
Name Since Tenure Data below for ICICI Prudential Regular Gold Savings Fund as on 30 Jun 26
Asset Allocation
Asset Class Value Top Securities Holdings / Portfolio
Name Holding Value Quantity 7. IDBI Gold Fund
IDBI Gold Fund
Growth Launch Date 14 Aug 12 NAV (22 Jul 26) ₹37.1714 ↑ 0.43 (1.16 %) Net Assets (Cr) ₹757 on 30 Jun 26 Category Gold - Gold AMC IDBI Asset Management Limited Rating Risk Moderately High Expense Ratio 0.64 Sharpe Ratio 1.22 Information Ratio 0 Alpha Ratio 0 Min Investment 5,000 Min SIP Investment 500 Exit Load 0-12 Months (1%),12 Months and above(NIL) Growth of 10,000 investment over the years.
Date Value Returns for IDBI Gold Fund
absolute basis & more than 1 year are on CAGR (Compound Annual Growth Rate) basis. as on 21 Jul 26 Duration Returns 1 Month -1.5% 3 Month -4.7% 6 Month -5.3% 1 Year 43.4% 3 Year 32.5% 5 Year 23.3% 10 Year 15 Year Since launch 9.9% Historical performance (Yearly) on absolute basis
Year Returns 2025 79% 2024 18.7% 2023 14.8% 2022 12% 2021 -4% 2020 24.2% 2019 21.6% 2018 5.8% 2017 1.4% 2016 8.3% Fund Manager information for IDBI Gold Fund
Name Since Tenure Data below for IDBI Gold Fund as on 30 Jun 26
Asset Allocation
Asset Class Value Top Securities Holdings / Portfolio
Name Holding Value Quantity 8. Axis Gold Fund
Axis Gold Fund
Growth Launch Date 20 Oct 11 NAV (22 Jul 26) ₹41.7559 ↑ 0.51 (1.24 %) Net Assets (Cr) ₹2,828 on 30 Jun 26 Category Gold - Gold AMC Axis Asset Management Company Limited Rating ☆ Risk Moderately High Expense Ratio 0.5 Sharpe Ratio 1.35 Information Ratio 0 Alpha Ratio 0 Min Investment 5,000 Min SIP Investment 1,000 Exit Load 0-1 Years (1%),1 Years and above(NIL) Growth of 10,000 investment over the years.
Date Value Returns for Axis Gold Fund
absolute basis & more than 1 year are on CAGR (Compound Annual Growth Rate) basis. as on 21 Jul 26 Duration Returns 1 Month -1.4% 3 Month -4.5% 6 Month -4% 1 Year 43.4% 3 Year 32.5% 5 Year 23.3% 10 Year 15 Year Since launch 10.2% Historical performance (Yearly) on absolute basis
Year Returns 2025 69.8% 2024 19.2% 2023 14.7% 2022 12.5% 2021 -4.7% 2020 26.9% 2019 23.1% 2018 8.3% 2017 0.7% 2016 10.7% Fund Manager information for Axis Gold Fund
Name Since Tenure Data below for Axis Gold Fund as on 30 Jun 26
Asset Allocation
Asset Class Value Top Securities Holdings / Portfolio
Name Holding Value Quantity 9. Nippon India Gold Savings Fund
Nippon India Gold Savings Fund
Growth Launch Date 7 Mar 11 NAV (22 Jul 26) ₹54.7994 ↑ 0.65 (1.20 %) Net Assets (Cr) ₹6,854 on 30 Jun 26 Category Gold - Gold AMC Nippon Life Asset Management Ltd. Rating ☆☆ Risk Moderately High Expense Ratio 0.35 Sharpe Ratio 1.19 Information Ratio 0 Alpha Ratio 0 Min Investment 5,000 Min SIP Investment 100 Exit Load 0-1 Years (2%),1 Years and above(NIL) Growth of 10,000 investment over the years.
Date Value Returns for Nippon India Gold Savings Fund
absolute basis & more than 1 year are on CAGR (Compound Annual Growth Rate) basis. as on 21 Jul 26 Duration Returns 1 Month -1.7% 3 Month -4.7% 6 Month -4.3% 1 Year 43.4% 3 Year 32.5% 5 Year 23.1% 10 Year 15 Year Since launch 11.7% Historical performance (Yearly) on absolute basis
Year Returns 2025 71.2% 2024 19% 2023 14.3% 2022 12.3% 2021 -5.5% 2020 26.6% 2019 22.5% 2018 6% 2017 1.7% 2016 11.6% Fund Manager information for Nippon India Gold Savings Fund
Name Since Tenure Data below for Nippon India Gold Savings Fund as on 30 Jun 26
Asset Allocation
Asset Class Value Top Securities Holdings / Portfolio
Name Holding Value Quantity 10. Aditya Birla Sun Life Gold Fund
Aditya Birla Sun Life Gold Fund
Growth Launch Date 20 Mar 12 NAV (22 Jul 26) ₹41.5961 ↑ 0.50 (1.21 %) Net Assets (Cr) ₹1,648 on 30 Jun 26 Category Gold - Gold AMC Birla Sun Life Asset Management Co Ltd Rating ☆☆☆ Risk Moderately High Expense Ratio 0.51 Sharpe Ratio 1.2 Information Ratio 0 Alpha Ratio 0 Min Investment 100 Min SIP Investment 100 Exit Load 0-365 Days (1%),365 Days and above(NIL) Growth of 10,000 investment over the years.
Date Value Returns for Aditya Birla Sun Life Gold Fund
absolute basis & more than 1 year are on CAGR (Compound Annual Growth Rate) basis. as on 21 Jul 26 Duration Returns 1 Month -1.8% 3 Month -4.7% 6 Month -5% 1 Year 43.1% 3 Year 32.5% 5 Year 23.2% 10 Year 15 Year Since launch 10.5% Historical performance (Yearly) on absolute basis
Year Returns 2025 72% 2024 18.7% 2023 14.5% 2022 12.3% 2021 -5% 2020 26% 2019 21.3% 2018 6.8% 2017 1.6% 2016 11.5% Fund Manager information for Aditya Birla Sun Life Gold Fund
Name Since Tenure Data below for Aditya Birla Sun Life Gold Fund as on 30 Jun 26
Asset Allocation
Asset Class Value Top Securities Holdings / Portfolio
Name Holding Value Quantity
म्यूचुअल फंड कंपनी
भारत में 42 म्यूचुअल फंड कंपनियां हैं (जिन्हें एसेट मैनेजमेंट कंपनी "एएमसी" कहा जाता है) जो म्यूचुअल फंड स्कीम प्रदान करती हैं, जिसमें निवेशक निवेश कर सकते हैं। इन म्यूचुअल फंड कंपनियों को सेबी द्वारा विनियमित किया जाता है। ध्यान देने योग्य म्यूचुअल फंड कंपनियों में से कुछ हैं:
1. एसबीआई म्यूचुअल फंड
भारतीय स्टेट बैंक द्वारा 1987 में SBI म्यूचुअल फंड की स्थापना की गई थी। आज SBI MF संपत्ति के 1,57,025 करोड़ (Mar-31-2017) का प्रबंधन करता है। यह भारत में सबसे बड़ी संपत्ति प्रबंधन कंपनियों में से एक है और इक्विटी, ऋण और संतुलित की श्रेणियों में 70 से अधिक फंड प्रदान करता है।
2. एचडीएफसी म्यूचुअल फंड
वर्ष 2000 में सेटअप, एचडीएफसी परिसंपत्ति प्रबंधन कंपनी एचडीएफसी इक्विटी फंड और एचडीएफसी शीर्ष 200 फंड जैसे कुछ प्रसिद्ध नामों की देखभाल करने वाले प्रमुख संपत्ति प्रबंधकों में से एक है। आज, यह संपत्ति के 2,37,177 करोड़ (Mar-31-2017) का प्रबंधन करता है। इसमें परिसंपत्ति वर्गों में योजनाएं हैं और 63 से अधिक योजनाओं का दावा है कि यह प्रबंधन करती है। यह आवास विकास वित्त निगम (एचडीएफसी) नामक बहुत बड़े बैंकिंग संस्थान के माता-पिता द्वारा समर्थित है।
3. रिलायंस म्यूचुअल फंड
1995 में सेटअप,रिलायंस म्यूचुअल फंड भारत की सबसे पुरानी म्यूचुअल फंड कंपनियों में से एक है। पिछले 2 दशकों में विस्फोटक वृद्धि के साथ, आज इसके पास प्रबंधन के तहत 210890 करोड़ (Mar-31-2017) की संपत्ति है। यह उद्योग के कुछ सबसे पुराने फंडों का प्रबंधन करता है जैसे कि रिलायंस विजन फंड, रिलायंस ग्रोथ फंड, रिलायंस बैंकिंग फंड और रिलायंस लिक्विड फंड।
4. यूटीआई म्यूचुअल फंड
यूटीआई म्यूचुअल फंड भारत में सबसे पुरानी संपत्ति प्रबंधन कंपनी है। भारत में म्युचुअल फंड 1963 में यूनिट ट्रस्ट ऑफ इंडिया (यूटीआई) के गठन के साथ शुरू हुआ था, तब से यूटीआई वर्षों में विकसित हुआ है। आज, यूटीआई एएमसी 1,36,810 करोड़ (Mar-31-2017) की संपत्ति के साथ एक बहुत बड़ा संपत्ति प्रबंधक है। इसके कुछ प्रमुख फंड यूटीआई इक्विटी फंड और यूटीआई एमएनसी फंड हैं। यह सम्पत्ति वर्गों में निधि प्रदान करता है।
5. फ्रैंकलिन टेम्पलटन म्यूचुअल फंड
फ्रैंकलिन म्यूचुअल फंड 1995 में स्थापित किया गया था। यह 81,615 करोड़ (Mar-31-2014) की संपत्ति के साथ एक बड़ा फंड हाउस भी है।फ्रैंकलिन टेम्पलटन म्यूचुअल फंड अमेरिकी मूल के टेम्पलटन इंटरनेशनल इंक द्वारा समर्थित है। फ्रैंकलिन टेम्पलटन म्यूचुअल फंड एक बहुत ही प्रक्रिया संचालित फंड हाउस है
6. एलआईसी म्यूचुअल फंड
भारतीय जीवन बीमा निगम (LIC) द्वारा समर्थित, इस म्यूचुअल फंड कंपनी ने 1994 में परिचालन शुरू किया था। आज यह संपत्ति के INR 21,475 करोड़ (Mar-31-2017) का प्रबंधन करता है।
7. ब्लैकरॉक म्यूचुअल फंड
डीएसपी ब्लैकरॉक म्यूचुअल फंड 1996 में डीएसपी ग्रुप और ब्लैकरॉक इंक। सेटअप का एक संयुक्त उद्यम है जो फंड हाउस सम्पत्ति वर्गों में प्रबंधन करता है। यह डीएसपी ब्लैकरॉक माइक्रोकैप फंड और डीएसपी ब्लैकरॉक जैसे नामों का प्रबंधन करता हैटैक्स सेवर निधि।
म्यूचुअल फंड में निवेश कैसे करें
म्यूचुअल फंड में निवेश कैसे करें? निवेश करने के लिए कई रास्ते हैं, कोई भी सीधे फंड हाउस जा सकता है, एक ब्रोकर की सेवाओं का भी उपयोग कर सकता है।वितरक या एक भी वित्तीय सलाहकार का उपयोग कर सकते हैं। डिस्ट्रीब्यूटर की सेवाओं का उपयोग करने के कई फायदे हैं, अलग-अलग एएमसी में जाने के बजाय, प्रक्रिया को बोझिल बनाकर एक डिस्ट्रीब्यूटर का उपयोग किया जा सकता है, जो उन सभी के साथ खरीदारी और मोचन के लिए बातचीत और मदद कर सकता है और निवेशक के लिए प्रक्रिया को आसान बना सकता है। । आज, निवेशक म्यूचुअल फंड की खरीद को ऑनलाइन कर सकते हैं और पूरी प्रक्रिया को पूरा करने के लिए घर बैठे हो सकते हैं।
म्युचुअल फंड निवेश योजना
निवेशक के जोखिम प्रोफाइल को देखते हुए विभिन्न म्यूचुअल फंड निवेश योजनाएं बना सकते हैं। जो लोग अधिक जोखिम उठा सकते हैं, उनके लिए इक्विटी फंड हैं और कम जोखिम वाले लोगों के लिए डेट / मनी मार्केट फंड हैं। कोई लक्ष्य प्राप्त करने के लिए विभिन्न कैलकुलेटरों के साथ लक्ष्य नियोजन कर सकता है जैसे घर, कार या अन्य संपत्ति खरीदना। एक एसआईपी का उपयोग करके समय-समय पर इन लक्ष्यों को प्राप्त करने की कोशिश की जा सकती है। इसके अलावा, एसेट एलोकेशन का उपयोग कर कोई भी एसेट्स के मिश्रण का चयन कर सकता है जिसे जोखिम का स्तर सहन कर सकता है।
म्यूचुअल फंड एनएवी
उद्योग बहुत पारदर्शी है; धनराशि को प्रतिदिन अपनी कीमतें प्रकाशित करना आवश्यक है। मूल्य को नेट एसेट वैल्यू के रूप में जाना जाता है (नहीं हैं)। सेबी द्वारा अपने म्यूचुअल फंड को दैनिक रूप से प्रकाशित करने के लिए सभी म्यूचुअल फंड की आवश्यकता होती है। NAV को अधिकांश AMCs की वेबसाइटों के साथ-साथ AMFI की वेबसाइट पर पारदर्शिता सुनिश्चित करने के लिए प्रकाशित किया जाता है।
म्यूचुअल फंड कैलकुलेटर
म्यूचुअल फंड कैलकुलेटर एसआईपी का उपयोग करते हुए लक्ष्यों की योजना बनाने के लिए एक बहुत ही महत्वपूर्ण उपकरण है और यह भी देखना है कि व्यवस्थित निवेश योजना का उपयोग करके कोई कैसे विकसित हो सकता है। अपेक्षित विकास दर और मुद्रास्फीति जैसे बुनियादी इनपुट लेना यह सभी प्रकार की गणना कर सकता है। यहां कैलकुलेटर पर पहुंचें:
Know Your Monthly SIP Amount
म्यूचुअल फंड्स: इंडेक्स फंड्स
आज, म्यूचुअल फंड प्लेटफॉर्म पर कई इंडेक्स फंड भी उपलब्ध हैं। ये विभिन्न म्यूचुअल फंड कंपनियों द्वारा पेश किए जाते हैं। इंडेक्स फंड के अलावा, विभिन्न हैंविनिमय व्यापार फंड (ईटीएफ) म्यूचुअल फंड प्लेटफॉर्म पर भी उपलब्ध हैं। निफ्टी ईटीएफ, गोल्ड ईटीएफ आदि कुछ का नाम फंड के फॉर्म में उपलब्ध हैं।
म्यूचुअल फंड रेटिंग
आज म्यूचुअल फंड रेटिंग कई खिलाड़ियों जैसे CRISIL, ICRA, मॉर्निंगस्टार आदि द्वारा प्रदान की जाती है।म्यूचुअल फंड रेटिंग आमतौर पर अंतिम रेटिंग पर पहुंचने के लिए कई मात्रात्मक और साथ ही गुणात्मक कारक लेते हैं। म्यूचुअल फंड रेटिंग स्कीम का चयन करने वाले निवेशक के लिए एक अच्छा शुरुआती बिंदु है।
आज, म्यूचुअल फंड खुदरा निवेशकों के लिए एक महत्वपूर्ण मार्ग बन गया है, और निवेशकों के लिए सबसे अच्छा फंड चुनना बहुत महत्वपूर्ण है। निवेशकों को हमेशा यह समझने में अपना शोध करना चाहिए कि इस यात्रा में उनकी मदद करने के लिए सही वितरक / सलाहकार चुनने के लिए कौन से फंड का निवेश करना है।
यह सुनिश्चित करने के लिए सभी प्रयास किए गए हैं कि यहां दी गई जानकारी सटीक है। हालांकि, डेटा की शुद्धता के बारे में कोई गारंटी नहीं दी जाती है। कोई भी निवेश करने से पहले योजना की जानकारी दस्तावेज़ से सत्यापित करें।
")
 Mutual Fund in India")


AMFI Registration No. 112358 | CIN: U74999MH2016PTC282153
Shepard Technologies Pvt. Ltd. (with ARN code 112358) makes no warranties or representations, express or implied, on products offered through the platform. It accepts no liability for any damages or losses, however caused, in connection with the use of, or on the reliance of its product or related services. Terms and conditions of the website are applicable.
©2026 Shepard Technologies Private Limited. All Rights Reserved
Thanks A Lot for more valuable information. Please provide such information on insurance life and health
Best mutual fund for 2 to 5 year investment in single schemes
Educative and very Useful information. Thank you.
Great Read. Informative Page about all types of mutual funds.