इंडसइंड बैंक में एसआईपी लेनदेन के लिए बिलर कैसे जोड़ें?
सिप या व्यवस्थितनिवेश योजना में एक निवेश मोड हैम्यूचुअल फंड जिसके माध्यम से व्यक्ति नियमित अंतराल पर छोटी राशि जमा करते हैं। एक महत्वपूर्ण बिंदु जो व्यक्तियों को यहां समझना चाहिए, वह यह है कि राशि नियमित अंतराल पर काटी जाती है। परिणामस्वरूप, यह सुनिश्चित करने के लिए कि संपूर्णएसआईपी निवेश प्रक्रिया सुचारू रूप से होती है; व्यक्ति अपने में बिलर जोड़ सकते हैंबैंक हिसाब किताब। बैंक खातों में बिलर जोड़ने के लिए, व्यक्तियों को विशिष्ट पंजीकरण संख्या या एसआईपी के यूआरएन की आवश्यकता होती है जिसे नेट बैंकिंग या मोबाइल बैंकिंग प्रक्रिया के माध्यम से बैंक खाते में जोड़ा जाना चाहिए। प्रत्येक बैंक के लिए बिलर जोड़ने की प्रक्रिया अलग है। तो, आइए इंडसइंड बैंक में एसआईपी लेनदेन के लिए बिलर जोड़ने की प्रक्रिया की जांच करें।
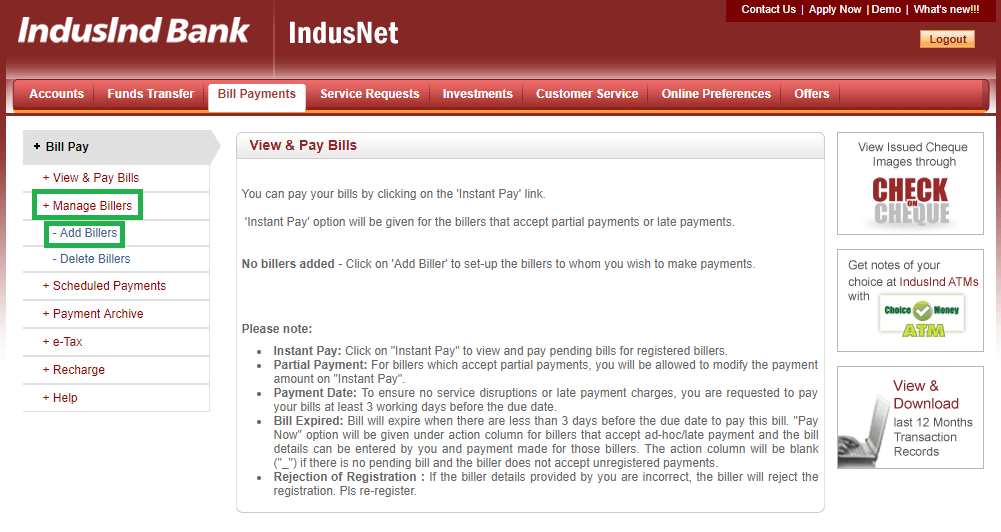
अपने इंडसइंड बैंक खाते में लॉगिन करें और बिल भुगतान विकल्प पर क्लिक करें
अधिकांश बैंकों में पहला कदम लगभग समान है जिसमें व्यक्तियों को अपने बैंक खातों में लॉग इन करने की आवश्यकता होती है। इस मामले में भी, आपको सबसे पहले अपने लॉगिन क्रेडेंशियल का उपयोग करके अपने खाते में लॉग इन करना होगा। लॉग इन करने के बाद होम स्क्रीन पर पहुंचने के बाद आपको पर क्लिक करना होगाबिल भुगतान टैब जो स्क्रीन के शीर्ष पर है। इस चरण के लिए चित्र नीचे दिया गया है जहाँबिल भुगतान टैब हरे रंग में हाइलाइट किया गया है।

मैनेज बिलर टैब पर क्लिक करें और एड बिलर विकल्प चुनें
जैसे ही आप बिल भुगतान पर क्लिक करते हैं, एक नई स्क्रीन खुलती है। इस स्क्रीन में, आपको पर क्लिक करना होगाबिलर्स प्रबंधित करें टैब जो स्क्रीन के बाईं ओर है। एक बार, आप मैनेज बिलर विकल्प पर क्लिक करते हैं, टैब का विस्तार होता है और उस टैब में, आपको पर क्लिक करने की आवश्यकता होती हैबिलर्स जोड़ें विकल्प। इस चरण की छवि नीचे दी गई है जहां हरे रंग में बिलर्स प्रबंधित करें और बिलर्स जोड़ें विकल्प हाइलाइट किया गया है।
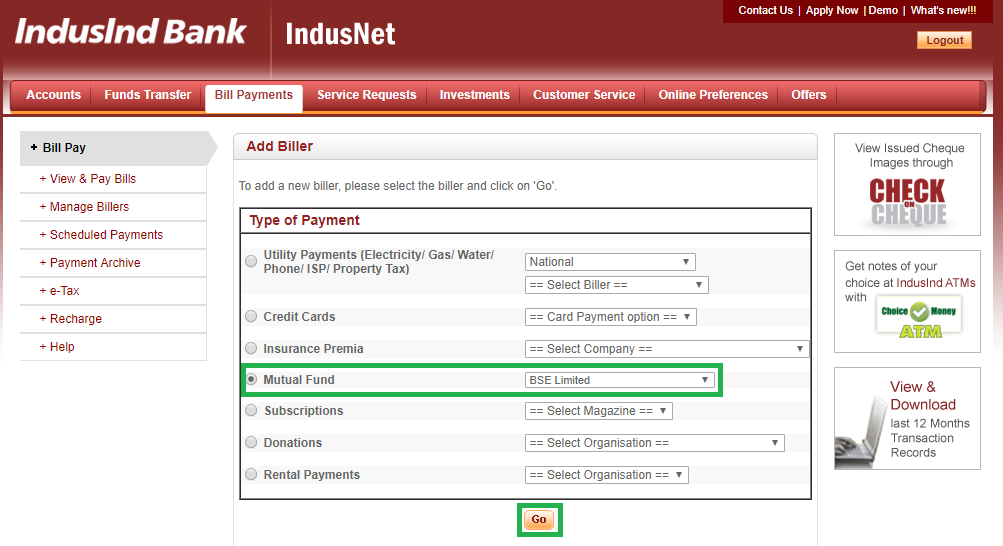
म्यूचुअल फंड विकल्प पर क्लिक करें और बीएसई लिमिटेड का चयन करें
एक बार जब आप पर क्लिक करेंबिलर जोड़ें पिछले चरण में, आपको एक नई स्क्रीन पर पुनर्निर्देशित किया जाएगा जो भुगतान के प्रकार के रूप में दिखाई देगी। इस खंड में, उपयोगिता भुगतान जैसे विभिन्न विकल्प हैं,क्रेडिट कार्ड,बीमा प्रेमिया, और भी बहुत कुछ। इस सेक्शन में आपको पर क्लिक करना होगाम्यूचुअल फंड विकल्प और चुनेंBSE Limited इसके बगल में ड्रॉप डाउन में। चयन करने के बादBSE Limited जिस विकल्प पर आपको क्लिक करना हैजाओ विकल्प। इस चरण के लिए छवि नीचे दी गई है जहां हरे रंग में म्यूचुअल फंड, बीएसई लिमिटेड और गो बटन को हाइलाइट किया गया है।
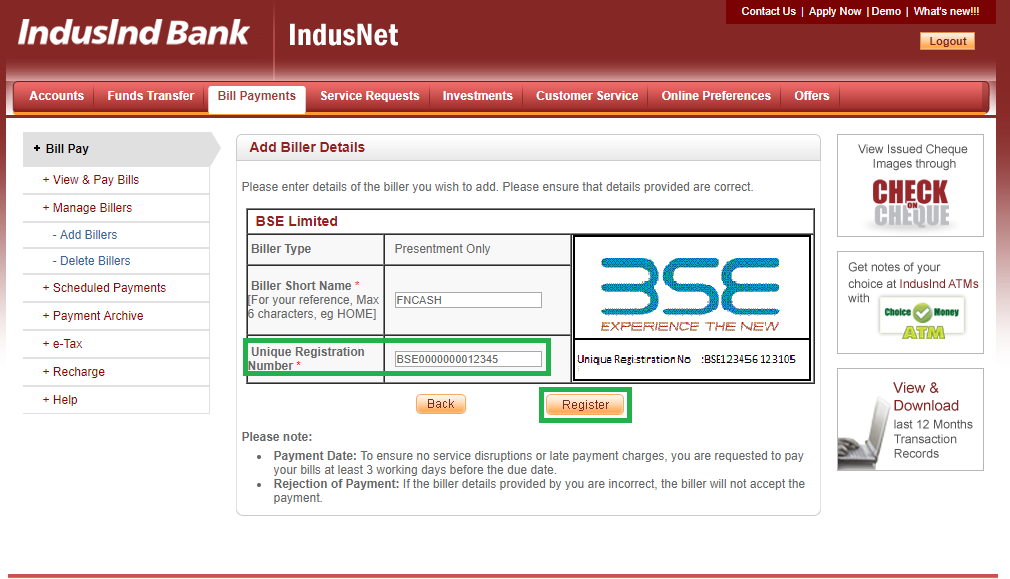
यूआरएन विवरण दर्ज करें
बिलर जोड़ने की प्रक्रिया में यह महत्वपूर्ण कदम है। एक बार जब आप गो पर क्लिक करते हैं, तो इस चरण में, आपको एक नई स्क्रीन पर भेज दिया जाता है, जिसमें आपको अपना यूआरएन और अन्य विवरण दर्ज करने की आवश्यकता होती है। एक बार प्रारंभिक भुगतान करने के बाद आपको फिनकैश से ईमेल के माध्यम से अपने एसआईपी के लिए यह यूआरएन नंबर प्राप्त होगा। यदि आप इसे प्राप्त नहीं करते हैं तो आप इसे से पा सकते हैंमेरे एसआईपी section of your Fincash Account. यूआरएन प्राप्त करने के बाद, आपको इसे यहां दर्ज करना होगा और अन्य विवरण जोड़ना होगा। विवरण दर्ज करने के बाद, आपको पर क्लिक करना होगारजिस्टर करें विकल्प। इस चरण की छवि नीचे दी गई है जहां यूआरएन विवरण और रजिस्टर बटन दोनों को हरे रंग में हाइलाइट किया गया है।
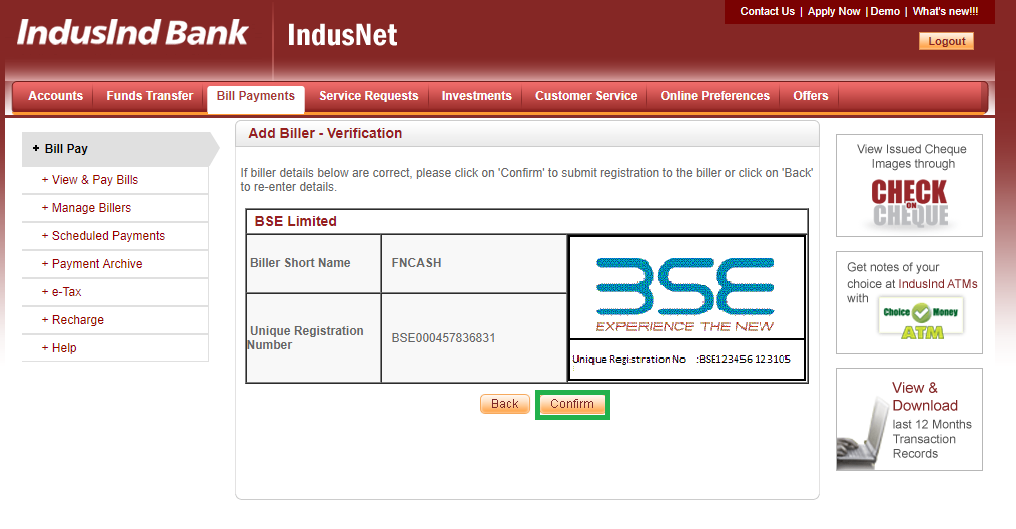
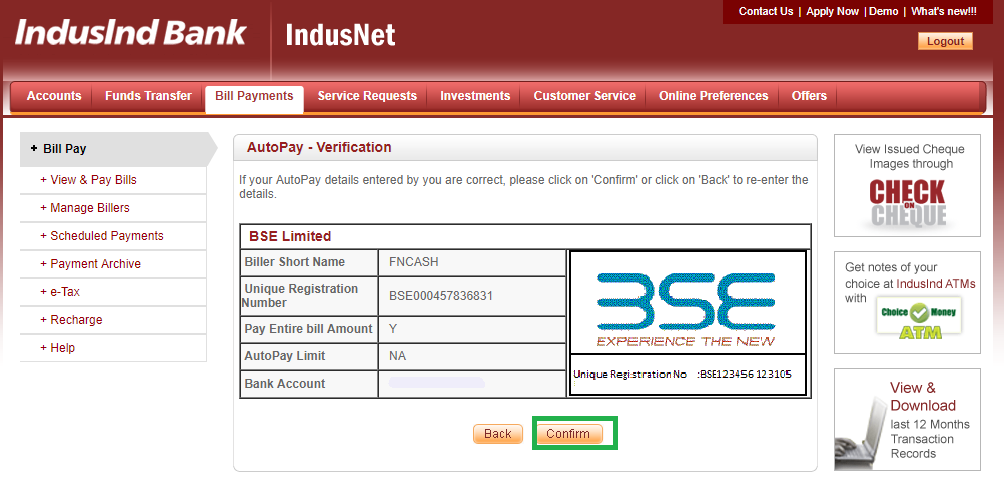
सारांश पुष्टि
एक बार जब आप पर क्लिक करेंरजिस्टर करें पिछले चरण में, एक नई स्क्रीन खुलती है जिसमें आप दर्ज किए गए अपने विवरण का सारांश देख सकते हैं। इस चरण में, आपको यह सत्यापित करना होगा कि दर्ज की गई जानकारी सही है या नहीं। एक बार जब आप विवरण के साथ सत्यापित कर लेते हैं, तो आपको पर क्लिक करना होगापुष्टि करना. इस चरण के लिए चित्र नीचे दिया गया है जहाँपुष्टि करना बटन हरे रंग में हाइलाइट किया गया है।
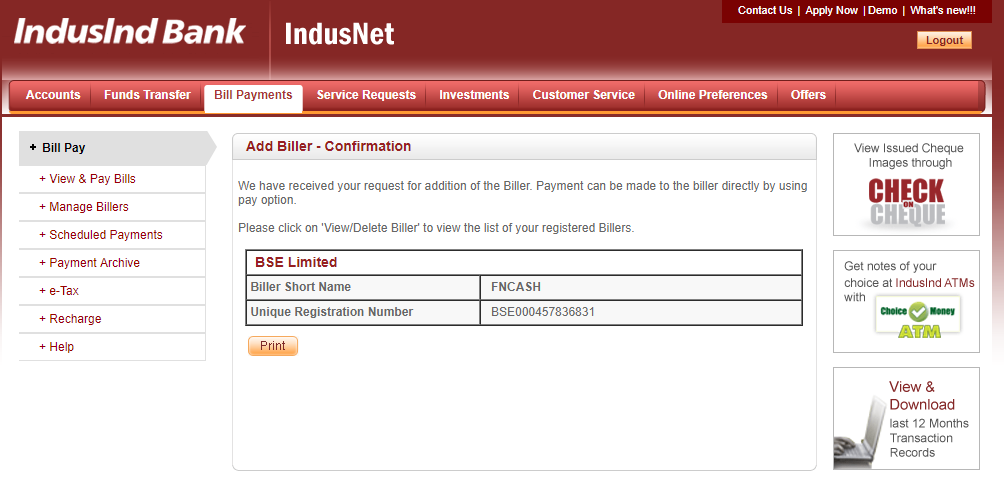
बिलर पुष्टि
इस चरण में, आपको यह बताते हुए बिलर पुष्टिकरण प्राप्त होता है कि आपका बिलर सफलतापूर्वक जोड़ दिया गया है। इस चरण के लिए चित्र नीचे दिया गया है।
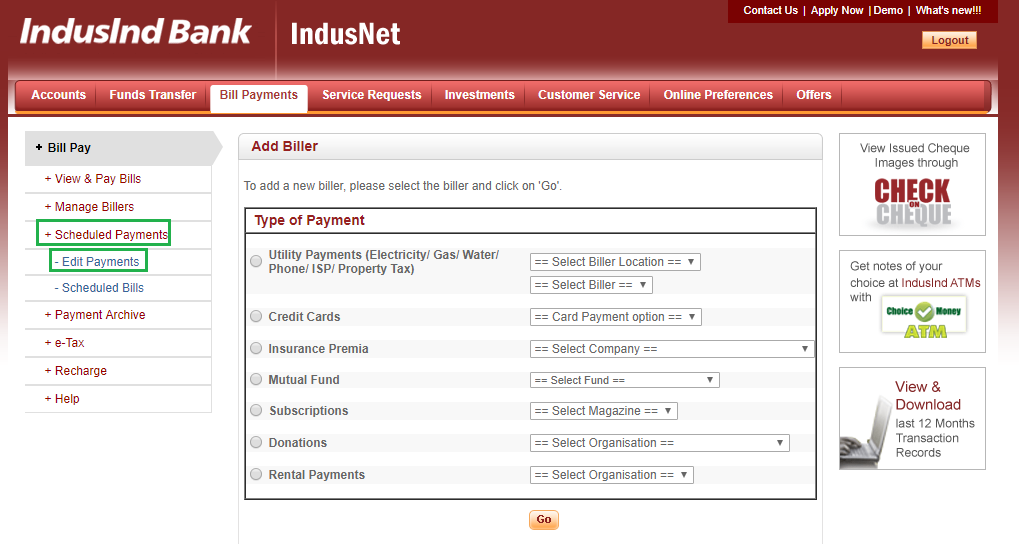
शेड्यूल भुगतान पर क्लिक करें और भुगतान संपादित करें चुनें
आपके बिलर को जोड़ने की प्रक्रिया सिर्फ बिलर जोड़ने से नहीं रुकती. एक बार जब आप सफलतापूर्वक बिलर जोड़ लेते हैं, तो आपको पर क्लिक करना होगाशेड्यूल भुगतान टैब जो स्क्रीन के बाईं ओर है। एक बार जब आप क्लिक करते हैं, तो उस पर टैब फैलता है और इसके तहत कई विकल्प दिखाता है। यहां, आपको पर क्लिक करना होगाभुगतान संपादित करें विकल्प। इस चरण की छवि नीचे दी गई है जहां शेड्यूल भुगतान टैब और भुगतान संपादित करें विकल्प दोनों को हरे रंग में हाइलाइट किया गया है।
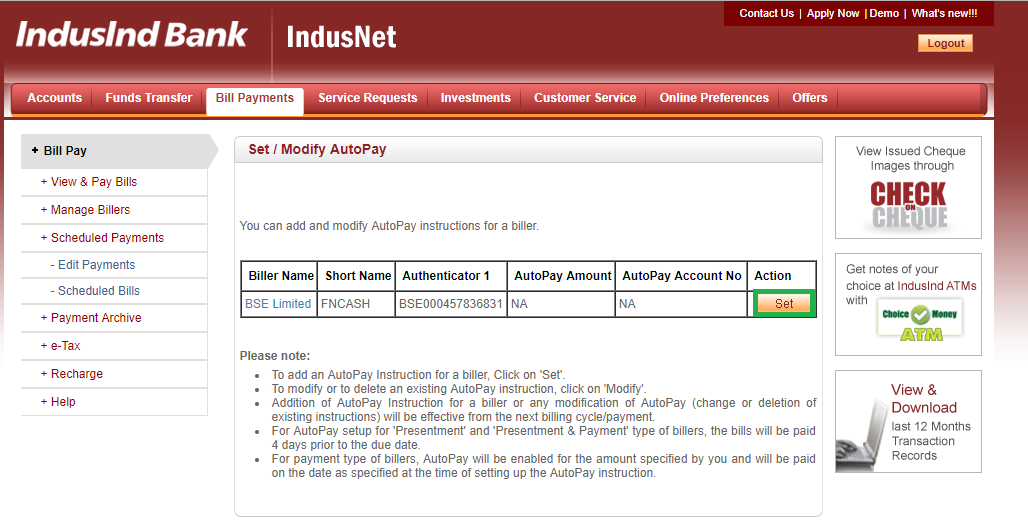
ऑटोपे स्क्रीन को संशोधित करने में सेट विकल्प पर क्लिक करें
एक बार जब आप पर क्लिक करेंभुगतान संपादित करें, एक नई स्क्रीन खुलती है जिसमें आप म्यूचुअल फंड बिलर को जोड़ा हुआ देख सकते हैं। आप बिलर के खिलाफ एसआईपी का यूआरएन भी देख सकते हैं। यहां, आपको पर क्लिक करना होगासेट म्यूचुअल फंड बिलर के खिलाफ विकल्प। इस चरण के लिए छवि नीचे दी गई है जहां हरे रंग में सेट विकल्प को हाइलाइट किया गया है।
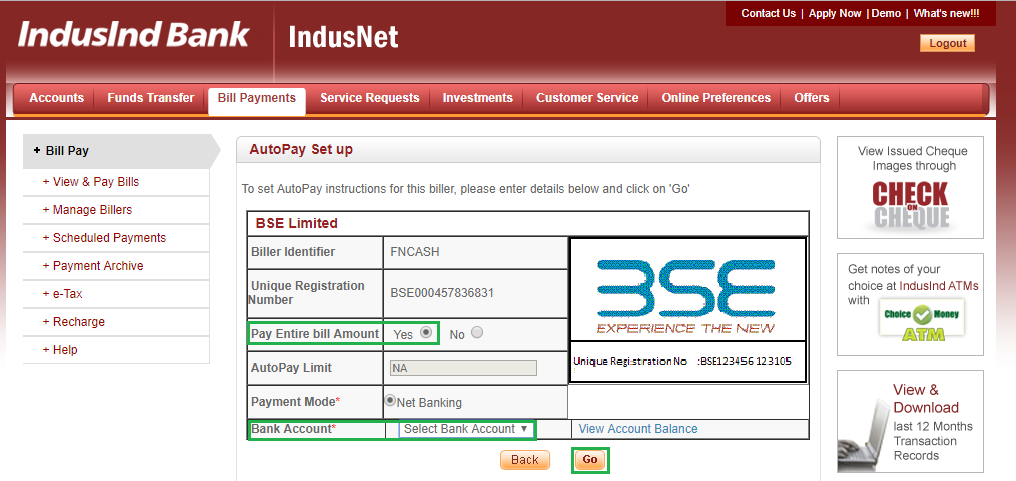
भुगतान विवरण दर्ज करें और Go . पर क्लिक करें
इस चरण में, आपको भुगतान विवरण दर्ज करना होगा। एक बार जब आप पर क्लिक करेंसेट पिछले चरण में, एक नई स्क्रीन खुलती है जिसमें आपको भुगतान विवरण दर्ज करना होता है। इधर, के खिलाफपूरी बिल राशि का भुगतान करें विकल्प, आपको चयन करने की आवश्यकता हैहां विकल्प। फिर आपको नेट बैंकिंग के रूप में भुगतान मोड का चयन करना होगा। इसके अलावा, आपको उस बैंक खाता संख्या का चयन करना होगा जिससे आप भुगतान करना चाहते हैं। सभी विवरण दर्ज करने के बाद, आपको पर क्लिक करना होगाजाओ बटन जो स्क्रीन के नीचे है। इस स्टेप के लिए इमेज नीचे दी गई है जहां पे एंटेयर बिल अमाउंट ऑप्शन, बैंक अकाउंट टैब और गो बटन को हरे रंग में हाइलाइट किया गया है।
भुगतान विवरण का सत्यापन
एक बार जब आप भुगतान विवरण दर्ज कर लें और पर क्लिक करेंजाओ, आपको एक नई स्क्रीन पर पुनर्निर्देशित किया जाता है जिसमें आप अपने द्वारा दर्ज किए गए सभी विवरणों को सत्यापित कर सकते हैं। यदि आप पाते हैं कि सभी विवरण सही ढंग से दर्ज किए गए हैं, तो आप पर क्लिक कर सकते हैंपुष्टि करना. यदि नहीं, तो बैक पर क्लिक करें ताकि आप प्रासंगिक विवरण संपादित कर सकें। इस चरण के लिए छवि नीचे दी गई है जहां हरे रंग में कन्फर्म बटन को हाइलाइट किया गया है।
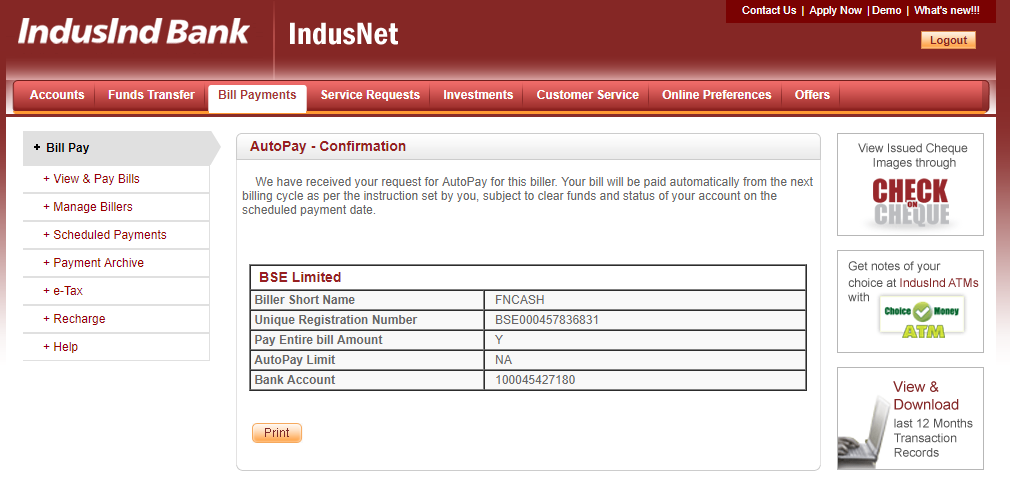
ऑटोपे विवरण की पुष्टि
इस चरण में, आपको ऑटोपे स्थिति के बारे में एक पुष्टिकरण मिलता है। इस चरण के लिए चित्र नीचे दिया गया है।
इस प्रकार, उपरोक्त चरणों से, यह कहा जा सकता है कि इंडसइंड बैंक में एसआईपी लेनदेन के लिए बिलर जोड़ने की प्रक्रिया कठिन नहीं है। इसे जोड़कर, व्यक्ति यह सुनिश्चित कर सकते हैं कि उनकी एसआईपी कटौती समय पर हो। उन्हें बस यह सुनिश्चित करने की आवश्यकता है कि उनके बैंक खाते में पर्याप्त राशि हो।
बेहतर रिटर्न अर्जित करने के लिए निवेश करने के लिए सर्वश्रेष्ठ एसआईपी
यहाँ कुछ अनुशंसित SIP हैं:5 वर्ष से अधिक का रिटर्न और एयूएमINR 500 करोड़
Fund NAV Net Assets (Cr) Min SIP Investment 3 MO (%) 6 MO (%) 1 YR (%) 3 YR (%) 5 YR (%) 2025 (%) SBI Gold Fund Growth ₹42.011
↑ 0.54 ₹15,294 500 -4.6 -4.4 43.9 32.8 23.4 71.5 Axis Gold Fund Growth ₹41.7559
↑ 0.51 ₹2,828 1,000 -4.5 -4 43.4 32.5 23.3 69.8 IDBI Gold Fund Growth ₹37.1714
↑ 0.43 ₹757 500 -4.7 -5.3 43.4 32.5 23.3 79 ICICI Prudential Regular Gold Savings Fund Growth ₹44.4117
↑ 0.53 ₹6,265 100 -4.8 -4.2 43.6 32.8 23.3 72 HDFC Gold Fund Growth ₹42.7629
↑ 0.46 ₹11,019 300 -4.8 -4.8 43.3 32.5 23.2 71.3 Note: Returns up to 1 year are on absolute basis & more than 1 year are on CAGR basis. as on 22 Jul 26 Research Highlights & Commentary of 5 Funds showcased
Commentary SBI Gold Fund Axis Gold Fund IDBI Gold Fund ICICI Prudential Regular Gold Savings Fund HDFC Gold Fund Point 1 Highest AUM (₹15,294 Cr). Bottom quartile AUM (₹2,828 Cr). Bottom quartile AUM (₹757 Cr). Lower mid AUM (₹6,265 Cr). Upper mid AUM (₹11,019 Cr). Point 2 Oldest track record among peers (14 yrs). Established history (14+ yrs). Established history (13+ yrs). Established history (14+ yrs). Established history (14+ yrs). Point 3 Top rated. Rating: 1★ (upper mid). Not Rated. Rating: 1★ (lower mid). Rating: 1★ (bottom quartile). Point 4 Risk profile: Moderately High. Risk profile: Moderately High. Risk profile: Moderately High. Risk profile: Moderately High. Risk profile: Moderately High. Point 5 5Y return: 23.43% (top quartile). 5Y return: 23.35% (upper mid). 5Y return: 23.29% (lower mid). 5Y return: 23.28% (bottom quartile). 5Y return: 23.18% (bottom quartile). Point 6 3Y return: 32.82% (top quartile). 3Y return: 32.46% (bottom quartile). 3Y return: 32.52% (bottom quartile). 3Y return: 32.77% (upper mid). 3Y return: 32.53% (lower mid). Point 7 1Y return: 43.88% (top quartile). 1Y return: 43.42% (bottom quartile). 1Y return: 43.43% (lower mid). 1Y return: 43.57% (upper mid). 1Y return: 43.28% (bottom quartile). Point 8 1M return: -1.60% (bottom quartile). 1M return: -1.43% (top quartile). 1M return: -1.49% (upper mid). 1M return: -1.54% (lower mid). 1M return: -1.57% (bottom quartile). Point 9 Alpha: 0.00 (top quartile). Alpha: 0.00 (upper mid). Alpha: 0.00 (lower mid). Alpha: 0.00 (bottom quartile). Alpha: 0.00 (bottom quartile). Point 10 Sharpe: 1.29 (upper mid). Sharpe: 1.35 (top quartile). Sharpe: 1.22 (bottom quartile). Sharpe: 1.22 (bottom quartile). Sharpe: 1.28 (lower mid). SBI Gold Fund
Axis Gold Fund
IDBI Gold Fund
ICICI Prudential Regular Gold Savings Fund
HDFC Gold Fund
The scheme seeks to provide returns that closely correspond to returns provided by SBI - ETF Gold (Previously known as SBI GETS). Below is the key information for SBI Gold Fund Returns up to 1 year are on To generate returns that closely correspond to returns generated by Axis Gold ETF. Research Highlights for Axis Gold Fund Below is the key information for Axis Gold Fund Returns up to 1 year are on The investment objective of the Scheme will be to generate returns that correspond closely to the returns generated by IDBI Gold Exchange Traded Fund (IDBI GOLD ETF). Research Highlights for IDBI Gold Fund Below is the key information for IDBI Gold Fund Returns up to 1 year are on ICICI Prudential Regular Gold Savings Fund (the Scheme) is a fund of funds scheme with the primary objective to generate returns by investing in units of ICICI Prudential Gold Exchange Traded Fund (IPru Gold ETF).
However, there can be no assurance that the investment objectives of the Scheme will be realized. Research Highlights for ICICI Prudential Regular Gold Savings Fund Below is the key information for ICICI Prudential Regular Gold Savings Fund Returns up to 1 year are on To seek capital appreciation by investing in units of HDFC Gold Exchange Traded Fund (HGETF). Research Highlights for HDFC Gold Fund Below is the key information for HDFC Gold Fund Returns up to 1 year are on 1. SBI Gold Fund
SBI Gold Fund
Growth Launch Date 12 Sep 11 NAV (22 Jul 26) ₹42.011 ↑ 0.54 (1.31 %) Net Assets (Cr) ₹15,294 on 30 Jun 26 Category Gold - Gold AMC SBI Funds Management Private Limited Rating ☆☆ Risk Moderately High Expense Ratio 0.3 Sharpe Ratio 1.29 Information Ratio 0 Alpha Ratio 0 Min Investment 5,000 Min SIP Investment 500 Exit Load 0-1 Years (1%),1 Years and above(NIL) Growth of 10,000 investment over the years.
Date Value Returns for SBI Gold Fund
absolute basis & more than 1 year are on CAGR (Compound Annual Growth Rate) basis. as on 22 Jul 26 Duration Returns 1 Month -1.6% 3 Month -4.6% 6 Month -4.4% 1 Year 43.9% 3 Year 32.8% 5 Year 23.4% 10 Year 15 Year Since launch 10.1% Historical performance (Yearly) on absolute basis
Year Returns 2025 71.5% 2024 19.6% 2023 14.1% 2022 12.6% 2021 -5.7% 2020 27.4% 2019 22.8% 2018 6.4% 2017 3.5% 2016 10% Fund Manager information for SBI Gold Fund
Name Since Tenure Data below for SBI Gold Fund as on 30 Jun 26
Asset Allocation
Asset Class Value Top Securities Holdings / Portfolio
Name Holding Value Quantity 2. Axis Gold Fund
Axis Gold Fund
Growth Launch Date 20 Oct 11 NAV (22 Jul 26) ₹41.7559 ↑ 0.51 (1.24 %) Net Assets (Cr) ₹2,828 on 30 Jun 26 Category Gold - Gold AMC Axis Asset Management Company Limited Rating ☆ Risk Moderately High Expense Ratio 0.5 Sharpe Ratio 1.35 Information Ratio 0 Alpha Ratio 0 Min Investment 5,000 Min SIP Investment 1,000 Exit Load 0-1 Years (1%),1 Years and above(NIL) Growth of 10,000 investment over the years.
Date Value Returns for Axis Gold Fund
absolute basis & more than 1 year are on CAGR (Compound Annual Growth Rate) basis. as on 22 Jul 26 Duration Returns 1 Month -1.4% 3 Month -4.5% 6 Month -4% 1 Year 43.4% 3 Year 32.5% 5 Year 23.3% 10 Year 15 Year Since launch 10.2% Historical performance (Yearly) on absolute basis
Year Returns 2025 69.8% 2024 19.2% 2023 14.7% 2022 12.5% 2021 -4.7% 2020 26.9% 2019 23.1% 2018 8.3% 2017 0.7% 2016 10.7% Fund Manager information for Axis Gold Fund
Name Since Tenure Data below for Axis Gold Fund as on 30 Jun 26
Asset Allocation
Asset Class Value Top Securities Holdings / Portfolio
Name Holding Value Quantity 3. IDBI Gold Fund
IDBI Gold Fund
Growth Launch Date 14 Aug 12 NAV (22 Jul 26) ₹37.1714 ↑ 0.43 (1.16 %) Net Assets (Cr) ₹757 on 30 Jun 26 Category Gold - Gold AMC IDBI Asset Management Limited Rating Risk Moderately High Expense Ratio 0.64 Sharpe Ratio 1.22 Information Ratio 0 Alpha Ratio 0 Min Investment 5,000 Min SIP Investment 500 Exit Load 0-12 Months (1%),12 Months and above(NIL) Growth of 10,000 investment over the years.
Date Value Returns for IDBI Gold Fund
absolute basis & more than 1 year are on CAGR (Compound Annual Growth Rate) basis. as on 22 Jul 26 Duration Returns 1 Month -1.5% 3 Month -4.7% 6 Month -5.3% 1 Year 43.4% 3 Year 32.5% 5 Year 23.3% 10 Year 15 Year Since launch 9.9% Historical performance (Yearly) on absolute basis
Year Returns 2025 79% 2024 18.7% 2023 14.8% 2022 12% 2021 -4% 2020 24.2% 2019 21.6% 2018 5.8% 2017 1.4% 2016 8.3% Fund Manager information for IDBI Gold Fund
Name Since Tenure Data below for IDBI Gold Fund as on 30 Jun 26
Asset Allocation
Asset Class Value Top Securities Holdings / Portfolio
Name Holding Value Quantity 4. ICICI Prudential Regular Gold Savings Fund
ICICI Prudential Regular Gold Savings Fund
Growth Launch Date 11 Oct 11 NAV (22 Jul 26) ₹44.4117 ↑ 0.53 (1.20 %) Net Assets (Cr) ₹6,265 on 30 Jun 26 Category Gold - Gold AMC ICICI Prudential Asset Management Company Limited Rating ☆ Risk Moderately High Expense Ratio 0.38 Sharpe Ratio 1.22 Information Ratio 0 Alpha Ratio 0 Min Investment 5,000 Min SIP Investment 100 Exit Load 0-15 Months (2%),15 Months and above(NIL) Growth of 10,000 investment over the years.
Date Value Returns for ICICI Prudential Regular Gold Savings Fund
absolute basis & more than 1 year are on CAGR (Compound Annual Growth Rate) basis. as on 22 Jul 26 Duration Returns 1 Month -1.5% 3 Month -4.8% 6 Month -4.2% 1 Year 43.6% 3 Year 32.8% 5 Year 23.3% 10 Year 15 Year Since launch 10.6% Historical performance (Yearly) on absolute basis
Year Returns 2025 72% 2024 19.5% 2023 13.5% 2022 12.7% 2021 -5.4% 2020 26.6% 2019 22.7% 2018 7.4% 2017 0.8% 2016 8.9% Fund Manager information for ICICI Prudential Regular Gold Savings Fund
Name Since Tenure Data below for ICICI Prudential Regular Gold Savings Fund as on 30 Jun 26
Asset Allocation
Asset Class Value Top Securities Holdings / Portfolio
Name Holding Value Quantity 5. HDFC Gold Fund
HDFC Gold Fund
Growth Launch Date 24 Oct 11 NAV (22 Jul 26) ₹42.7629 ↑ 0.46 (1.09 %) Net Assets (Cr) ₹11,019 on 30 Jun 26 Category Gold - Gold AMC HDFC Asset Management Company Limited Rating ☆ Risk Moderately High Expense Ratio 0.49 Sharpe Ratio 1.28 Information Ratio 0 Alpha Ratio 0 Min Investment 5,000 Min SIP Investment 300 Exit Load 0-6 Months (2%),6-12 Months (1%),12 Months and above(NIL) Growth of 10,000 investment over the years.
Date Value Returns for HDFC Gold Fund
absolute basis & more than 1 year are on CAGR (Compound Annual Growth Rate) basis. as on 22 Jul 26 Duration Returns 1 Month -1.6% 3 Month -4.8% 6 Month -4.8% 1 Year 43.3% 3 Year 32.5% 5 Year 23.2% 10 Year 15 Year Since launch 10.4% Historical performance (Yearly) on absolute basis
Year Returns 2025 71.3% 2024 18.9% 2023 14.1% 2022 12.7% 2021 -5.5% 2020 27.5% 2019 21.7% 2018 6.6% 2017 2.8% 2016 10.1% Fund Manager information for HDFC Gold Fund
Name Since Tenure Data below for HDFC Gold Fund as on 30 Jun 26
Asset Allocation
Asset Class Value Top Securities Holdings / Portfolio
Name Holding Value Quantity
किसी भी अन्य प्रश्न के मामले में, आप किसी भी कार्य दिवस पर सुबह 9.30 बजे से शाम 6.30 बजे के बीच 8451864111 पर हमसे संपर्क कर सकते हैं या हमें किसी भी समय एक मेल लिख सकते हैं।support@fincash.com या हमारी वेबसाइट पर लॉग इन करके हमारे साथ चैट करेंwww.fincash.com.
यहां प्रदान की गई जानकारी सटीक है, यह सुनिश्चित करने के लिए सभी प्रयास किए गए हैं। हालांकि, डेटा की शुद्धता के संबंध में कोई गारंटी नहीं दी जाती है। कृपया कोई भी निवेश करने से पहले योजना सूचना दस्तावेज के साथ सत्यापित करें।
")


AMFI Registration No. 112358 | CIN: U74999MH2016PTC282153
Shepard Technologies Pvt. Ltd. (with ARN code 112358) makes no warranties or representations, express or implied, on products offered through the platform. It accepts no liability for any damages or losses, however caused, in connection with the use of, or on the reliance of its product or related services. Terms and conditions of the website are applicable.
©2026 Shepard Technologies Private Limited. All Rights Reserved
Research Highlights for SBI Gold Fund