ആർബിട്രേജ് ഫണ്ടുകൾ എന്തൊക്കെയാണ്?
വിവിധ വിപണികളിലെ വിലവ്യത്യാസങ്ങൾ പ്രയോജനപ്പെടുത്തി ലാഭം നേടുന്ന ഒരു തന്ത്രമാണ് ആർബിട്രേജ്. ആർബിട്രേജ് ഫണ്ടുകൾ അവർ ഉപയോഗിക്കുന്ന ആർബിട്രേജ് തന്ത്രത്തിന്റെ പേരിലാണ് അറിയപ്പെടുന്നത്. അവർ ഒരു തരംമ്യൂച്വൽ ഫണ്ട് ആദായം സൃഷ്ടിക്കുന്നതിന് വില വ്യത്യാസത്തെ സ്വാധീനിക്കുന്നു. ഈ ഫണ്ടുകളുടെ വരുമാനം നിക്ഷേപിച്ച അസറ്റിന്റെ അസ്ഥിരതയെ ആശ്രയിച്ചിരിക്കുന്നുവിപണി. തങ്ങളുടെ നിക്ഷേപകർക്ക് വരുമാനം ഉണ്ടാക്കാൻ അവർ വിപണിയിലെ കാര്യക്ഷമതയില്ലായ്മ ഉപയോഗിക്കുന്നു.
അസമമായ വിലകൾ ചൂഷണം ചെയ്യുക എന്നതാണ് ആർബിട്രേജ് ഫണ്ടുകളുടെ കേന്ദ്ര ആശയം. റിട്ടേണുകൾ ഒപ്റ്റിമൈസ് ചെയ്യുന്നതിനായി ആർബിട്രേജ് ഫണ്ടുകൾ റിസ്ക് കുറഞ്ഞ വാങ്ങലും വിൽപനയും അവസരങ്ങൾ ഉപയോഗിക്കുന്നു. ഉദാഹരണത്തിന്, XYZ Co. LTD-യുടെ ഓഹരികൾ ക്യാഷ് മാർക്കറ്റിൽ 500 രൂപ വീതവും INR 1 എന്ന നിരക്കിലും ട്രേഡ് ചെയ്യപ്പെടുന്നു.000 ഫ്യൂച്ചേഴ്സ് മാർക്കറ്റിൽ. ക്യാഷ് മാർക്കറ്റിൽ നിന്ന് ഓഹരികൾ വാങ്ങുന്നതിലൂടെയും ഫ്യൂച്ചേഴ്സ് മാർക്കറ്റിൽ ഓഹരികൾ വിൽക്കുന്നതിലൂടെയും ഒരു ഷെയറിന് 500 രൂപ ലാഭം ലഭിക്കും.
Talk to our investment specialist
ആർബിട്രേജ് ഫണ്ടുകളിൽ നിങ്ങൾ എന്തിന് നിക്ഷേപിക്കണം?
അവയിൽ ചിലത് ഇതാനിക്ഷേപത്തിന്റെ നേട്ടങ്ങൾ ആർബിട്രേജ് ഫണ്ടുകളിൽ:
നിസ്സാരമായ അപകടസാധ്യത
ആർബിട്രേജ് ഫണ്ടുകൾ 100% അപകടസാധ്യതയില്ലാത്തവയല്ല, പക്ഷേ അവ നിസാരമായ അപകടസാധ്യത വഹിക്കുന്നു. അവർബാങ്ക് വിപണികളിൽ നടക്കുന്ന തെറ്റായ വിലനിർണ്ണയത്തെക്കുറിച്ച്. ഇത് നൽകുന്നുനിക്ഷേപകൻ മറ്റുള്ളവയുമായി താരതമ്യം ചെയ്യുമ്പോൾ സുരക്ഷിതമായ ഓപ്ഷൻഹ്രസ്വകാല ഫണ്ടുകൾ ഈ ഫണ്ടുകൾ വിപണിയിലെ ചാഞ്ചാട്ട സമയത്ത് മികച്ച വരുമാനം വാഗ്ദാനം ചെയ്യുന്നതിനാൽ.
മടങ്ങുന്നു
ഈ ഫണ്ടുകൾ സാധാരണയായി നിക്ഷേപിച്ച തുകയുടെ ഏകദേശം 7-9% വരുമാനം നൽകുന്നു. താരതമ്യപ്പെടുത്തുമ്പോൾ ഇത് കൂടുതലാണ്ലിക്വിഡ് ഫണ്ടുകൾ അല്ലെങ്കിൽ ഹ്രസ്വകാലഡെറ്റ് ഫണ്ട്. അങ്ങനെ, ആർബിട്രേജ് ഫണ്ടുകൾ ലാഭകരമായ നിക്ഷേപ ഓപ്ഷനായി മാറ്റുന്നു.
അനുകൂലമായ നികുതി
യുടെ ഏറ്റവും വലിയ നേട്ടങ്ങളിലൊന്ന്നിക്ഷേപിക്കുന്നു ഈ ഫണ്ടുകളിൽ നികുതി ചികിത്സയാണ്.ഇക്വിറ്റി ഫണ്ടുകൾ ദീർഘകാലത്തേക്ക് ആകർഷിക്കുകമൂലധനം നേട്ടങ്ങൾ. ഒരു ലക്ഷം രൂപ വരെ നേട്ടമുണ്ടാക്കിയാൽ അത് നികുതി രഹിതമായി കണക്കാക്കും. ഒരു ലക്ഷത്തിന് മുകളിലുള്ള നേട്ടങ്ങൾക്ക് 10% നികുതി ബാധകമാണ്.
ആർബിട്രേജ് ഫണ്ടുകളിൽ എങ്ങനെ നിക്ഷേപിക്കാം എന്നതിനെക്കുറിച്ചുള്ള മാർഗ്ഗനിർദ്ദേശങ്ങൾ
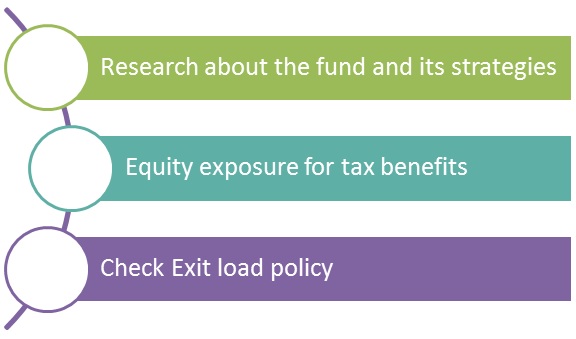
ഫണ്ടിനെക്കുറിച്ചും അതിന്റെ തന്ത്രങ്ങളെക്കുറിച്ചും ഗവേഷണം
ഫണ്ടിൽ നിക്ഷേപിക്കുന്നതിനുമുമ്പ്, അതിന്റെ മുൻകാല റിട്ടേണുകളും ആവശ്യമായ ഏറ്റവും കുറഞ്ഞ നിക്ഷേപവും അതിന്റെ തന്ത്രങ്ങളും വായിക്കുക. ഇന്ത്യയിലെ മിക്ക ആർബിട്രേജ് ഫണ്ടുകളും ശുദ്ധമായ മദ്ധ്യസ്ഥ തന്ത്രം പിന്തുടരുന്നു. എന്നാൽ ഈ ഫണ്ടുകൾ ലയനം/റിസ്ക് ആർബിട്രേജ് (ലയനങ്ങളും ഏറ്റെടുക്കലുകളും വിജയകരമായി പൂർത്തീകരിച്ചുവെന്ന ഊഹക്കച്ചവടം) പോലുള്ള തന്ത്രങ്ങൾ പിന്തുടരുന്നതായി അറിയപ്പെടുന്നു. സാധാരണക്കാർക്ക് മനസ്സിലാക്കാൻ അൽപ്പം സങ്കീർണ്ണമാണ്. അതിനാൽ, നിങ്ങൾ എന്താണ് ചെയ്യുന്നതെന്ന് അറിയാൻ നിക്ഷേപിക്കുന്നതിന് മുമ്പ് ഫണ്ടിന്റെ തന്ത്രത്തെക്കുറിച്ച് ഒരു ആശയം നേടേണ്ടത് പ്രധാനമാണ്.
എക്സിറ്റ് ലോഡ് പോളിസി പരിശോധിക്കുക
ആർബിട്രേജ് ഫണ്ടുകളിൽ നിന്നുള്ള അകാല പിൻവലിക്കൽ സാധാരണയായി 0.25-0.5% പിഴയോ എക്സിറ്റ് ലോഡോ ആകർഷിക്കുന്നു. അനാവശ്യ പിഴകൾ ഒഴിവാക്കാൻ നിക്ഷേപിക്കുന്നതിന് മുമ്പ് നിങ്ങളുടെ ഫണ്ടിന്റെ എക്സിറ്റ് ലോഡ് പോളിസി പരിശോധിക്കുക.
ആർബിട്രേജ് മ്യൂച്വൽ ഫണ്ടുകളിൽ നിക്ഷേപിക്കുന്നതിനുള്ള അപകടസാധ്യതകൾ
വൈവിധ്യവൽക്കരണത്തിന്റെ അഭാവം
ഇക്വിറ്റി നില നിലനിർത്തുന്നതിന്, ആർബിട്രേജ് ഫണ്ടുകൾക്ക് ഇക്വിറ്റിയിൽ കുറഞ്ഞത് 65% മൂലധനം നിലനിർത്തേണ്ടതുണ്ട്. ഡെറ്റ് ഫണ്ടുകളിൽ കൂടുതൽ നിക്ഷേപിക്കാൻ കഴിയാത്തതിനാൽ ഇത് ഫണ്ടിന്റെ വൈവിധ്യവൽക്കരണത്തെ ബാധിക്കുന്നു, അങ്ങനെ നിക്ഷേപകന്റെ മൊത്തത്തിലുള്ള പോർട്ട്ഫോളിയോയെ ബാധിക്കുന്നു.
എക്സിറ്റ് ലോഡ്സ്
നേരത്തെ പറഞ്ഞതുപോലെ, ഈ ഫണ്ടുകൾ അകാല പിൻവലിക്കലിൽ എക്സിറ്റ് ലോഡ് വഹിക്കുന്നു. അതിന് കഴിയുംപരിധി 0.25-0.50% മുതൽ എവിടെയും. കൂടാതെ, ദിമോചനം പണത്തിന്റെ 1-3 പ്രവൃത്തി ദിവസങ്ങൾ എടുക്കും. ഇത് ബാധിക്കുന്നുദ്രവ്യത ഫണ്ടിന്റെ.
ദീർഘകാലത്തേക്ക് അനുയോജ്യമല്ല
ആർബിട്രേജ് ഫണ്ടുകൾ ദീർഘകാല സമ്പത്ത് സൃഷ്ടിക്കുന്നതിനുള്ള ആകർഷകമായ ഓപ്ഷനല്ല. ആർബിട്രേജ് അവസരങ്ങൾ പരിമിതമായതിനാൽ, ലാഭമുണ്ടാക്കാൻ ഒരു ചെറിയ വിൻഡോ മാത്രമേയുള്ളൂ. അവരുടെ തന്ത്രം കാരണം, അവർക്ക് ഉയർന്ന വളർച്ചാ സാധ്യതയില്ല. അങ്ങനെ, അവരെ ദീർഘകാലത്തേക്ക് അനുയോജ്യരാക്കുന്നു.
മികച്ച 10 മികച്ച പ്രകടനം നടത്തുന്ന ആർബിട്രേജ് ഫണ്ടുകൾ
ഇന്ത്യയിൽ മികച്ച പ്രകടനം നടത്തുന്ന ചില ഫണ്ടുകൾ ഇവയാണ്:
Fund NAV Net Assets (Cr) 3 MO (%) 6 MO (%) 1 YR (%) 3 YR (%) 5 YR (%) 2024 (%) Kotak Equity Arbitrage Fund Growth ₹39.68
↑ 0.03 ₹72,079 1.5 3.1 6 7 6.2 6.4 UTI Arbitrage Fund Growth ₹37.1164
↑ 0.03 ₹10,991 1.5 3 6 7 6 6.5 Invesco India Arbitrage Fund Growth ₹33.7952
↑ 0.03 ₹28,062 1.5 3 6.1 6.9 6.2 6.5 HDFC Arbitrage Fund Growth ₹32.439
↑ 0.02 ₹25,085 1.5 3 6 6.9 6 6.3 SBI Arbitrage Opportunities Fund Growth ₹35.8077
↑ 0.03 ₹43,266 1.5 3 6 6.9 6.2 6.5 ICICI Prudential Equity Arbitrage Fund Growth ₹36.32
↑ 0.03 ₹32,260 1.5 3 6 6.9 6 6.5 Edelweiss Arbitrage Fund Growth ₹20.5045
↑ 0.02 ₹14,862 1.5 3 5.9 6.9 6 6.3 Aditya Birla Sun Life Arbitrage Fund Growth ₹28.1033
↑ 0.02 ₹26,280 1.5 3 5.9 6.8 5.9 6.4 Axis Arbitrage Fund Growth ₹19.777
↑ 0.02 ₹9,781 1.5 3 5.9 6.8 6 6.3 Nippon India Arbitrage Fund Growth ₹28.0808
↑ 0.02 ₹16,184 1.5 3 5.9 6.8 5.9 6.2 Note: Returns up to 1 year are on absolute basis & more than 1 year are on CAGR basis. as on 25 Jun 26 Research Highlights & Commentary of 10 Funds showcased
Commentary Kotak Equity Arbitrage Fund UTI Arbitrage Fund Invesco India Arbitrage Fund HDFC Arbitrage Fund SBI Arbitrage Opportunities Fund ICICI Prudential Equity Arbitrage Fund Edelweiss Arbitrage Fund Aditya Birla Sun Life Arbitrage Fund Axis Arbitrage Fund Nippon India Arbitrage Fund Point 1 Highest AUM (₹72,079 Cr). Bottom quartile AUM (₹10,991 Cr). Upper mid AUM (₹28,062 Cr). Lower mid AUM (₹25,085 Cr). Top quartile AUM (₹43,266 Cr). Upper mid AUM (₹32,260 Cr). Bottom quartile AUM (₹14,862 Cr). Upper mid AUM (₹26,280 Cr). Bottom quartile AUM (₹9,781 Cr). Lower mid AUM (₹16,184 Cr). Point 2 Oldest track record among peers (20 yrs). Established history (20+ yrs). Established history (19+ yrs). Established history (18+ yrs). Established history (19+ yrs). Established history (19+ yrs). Established history (12+ yrs). Established history (16+ yrs). Established history (11+ yrs). Established history (15+ yrs). Point 3 Rating: 4★ (top quartile). Rating: 3★ (upper mid). Rating: 3★ (lower mid). Rating: 3★ (lower mid). Rating: 2★ (bottom quartile). Rating: 4★ (upper mid). Top rated. Rating: 3★ (bottom quartile). Rating: 2★ (bottom quartile). Rating: 4★ (upper mid). Point 4 Risk profile: Moderately Low. Risk profile: Moderately Low. Risk profile: Moderately Low. Risk profile: Moderately Low. Risk profile: Moderately Low. Risk profile: Moderate. Risk profile: Moderately Low. Risk profile: Moderate. Risk profile: Moderate. Risk profile: Moderately Low. Point 5 5Y return: 6.18% (upper mid). 5Y return: 6.02% (upper mid). 5Y return: 6.21% (top quartile). 5Y return: 5.99% (lower mid). 5Y return: 6.21% (top quartile). 5Y return: 6.02% (lower mid). 5Y return: 6.04% (upper mid). 5Y return: 5.94% (bottom quartile). 5Y return: 5.97% (bottom quartile). 5Y return: 5.92% (bottom quartile). Point 6 3Y return: 7.02% (top quartile). 3Y return: 6.98% (top quartile). 3Y return: 6.93% (upper mid). 3Y return: 6.92% (upper mid). 3Y return: 6.91% (upper mid). 3Y return: 6.90% (lower mid). 3Y return: 6.88% (lower mid). 3Y return: 6.84% (bottom quartile). 3Y return: 6.81% (bottom quartile). 3Y return: 6.76% (bottom quartile). Point 7 1Y return: 6.02% (upper mid). 1Y return: 6.05% (top quartile). 1Y return: 6.08% (top quartile). 1Y return: 6.03% (upper mid). 1Y return: 6.03% (upper mid). 1Y return: 5.99% (lower mid). 1Y return: 5.93% (bottom quartile). 1Y return: 5.91% (bottom quartile). 1Y return: 5.93% (bottom quartile). 1Y return: 5.94% (lower mid). Point 8 1M return: 0.71% (lower mid). 1M return: 0.75% (top quartile). 1M return: 0.68% (bottom quartile). 1M return: 0.73% (upper mid). 1M return: 0.68% (bottom quartile). 1M return: 0.74% (top quartile). 1M return: 0.71% (bottom quartile). 1M return: 0.74% (upper mid). 1M return: 0.73% (lower mid). 1M return: 0.74% (upper mid). Point 9 Alpha: 0.00 (top quartile). Alpha: 0.00 (top quartile). Alpha: 0.00 (upper mid). Alpha: 0.00 (upper mid). Alpha: 0.00 (upper mid). Alpha: 0.00 (lower mid). Alpha: -0.82 (bottom quartile). Alpha: 0.00 (lower mid). Alpha: 0.00 (bottom quartile). Alpha: 0.00 (bottom quartile). Point 10 Sharpe: -0.28 (upper mid). Sharpe: -0.21 (upper mid). Sharpe: -0.08 (top quartile). Sharpe: -0.24 (upper mid). Sharpe: -0.06 (top quartile). Sharpe: -0.30 (lower mid). Sharpe: -0.40 (lower mid). Sharpe: -0.40 (bottom quartile). Sharpe: -0.44 (bottom quartile). Sharpe: -0.48 (bottom quartile). Kotak Equity Arbitrage Fund
UTI Arbitrage Fund
Invesco India Arbitrage Fund
HDFC Arbitrage Fund
SBI Arbitrage Opportunities Fund
ICICI Prudential Equity Arbitrage Fund
Edelweiss Arbitrage Fund
Aditya Birla Sun Life Arbitrage Fund
Axis Arbitrage Fund
Nippon India Arbitrage Fund
*മുകളിൽ മികച്ചവയുടെ ലിസ്റ്റ്മാദ്ധസ്ഥം ഫണ്ടുകൾക്ക് മുകളിൽ AUM/നെറ്റ് അസറ്റുകൾ ഉണ്ട്500 കോടി. ക്രമീകരിച്ചുകഴിഞ്ഞ 3 വർഷത്തെ റിട്ടേൺ.
The investment objective of the scheme is to generate capital appreciation and income by predominantly investing in arbitrage opportunities in the cash and derivatives segment of the equity market, and by investing the balance in debt and money market instruments. However, there is no assurance that the objective of the scheme will be realized Below is the key information for Kotak Equity Arbitrage Fund Returns up to 1 year are on (Erstwhile UTI SPREAD Fund) The investment objective of the scheme is to provide capital appreciation and dividend distribution through arbitrage opportunities arising out of price differences between the cash and derivative market by investing predominantly in equity and equity-related securities, derivatives and the balance portion in debt securities. However, there can be no assurance that the investment objective of the scheme will be realised. Research Highlights for UTI Arbitrage Fund Below is the key information for UTI Arbitrage Fund Returns up to 1 year are on The primary investment objective of the scheme is to generate income through arbitrage opportunities emerging out of mis-pricing between the cash market and the derivatives market and through deployment of surplus cash in fixed income instruments. Research Highlights for Invesco India Arbitrage Fund Below is the key information for Invesco India Arbitrage Fund Returns up to 1 year are on "To generate income through arbitrage opportunities between cash and derivative market and arbitrage opportunities within the derivative segment and by deployment of surplus cash in debt securities and money market instruments." Research Highlights for HDFC Arbitrage Fund Below is the key information for HDFC Arbitrage Fund Returns up to 1 year are on To provide capital appreciation and regular income for unitholders by identifying profitable arbitrage opportunities between the spot and derivative market segments as also through investment of surplus cash in debt and money market instruments. Research Highlights for SBI Arbitrage Opportunities Fund Below is the key information for SBI Arbitrage Opportunities Fund Returns up to 1 year are on The investment objective of Income Optimiser Plan under the scheme is to seek to generate low volatility returns by using arbitrage and other derivative strategies in equity markets and investments in short-term debt portfolio. Research Highlights for ICICI Prudential Equity Arbitrage Fund Below is the key information for ICICI Prudential Equity Arbitrage Fund Returns up to 1 year are on The investment objective of the Scheme is to generate income by predominantly investing in arbitrage opportunities in the cash and the derivative segments of the equity markets and the arbitrage opportunities available within the derivative segment and by investing the balance in debt and money market instruments. However, there is no assurance that the investment objective of the scheme will be realized. Research Highlights for Edelweiss Arbitrage Fund Below is the key information for Edelweiss Arbitrage Fund Returns up to 1 year are on (Erstwhile Aditya Birla Sun Life Enhanced Arbitrage Fund) An Open ended Equity Scheme with an investment objective to generate income by investing predominantly in equity and equity related instruments. Scheme intends to take advantage from the price differentials / mis-pricing prevailing for stock / index in various market segments (Cash & Futures). Research Highlights for Aditya Birla Sun Life Arbitrage Fund Below is the key information for Aditya Birla Sun Life Arbitrage Fund Returns up to 1 year are on (Erstwhile Axis Enhanced Arbitrage Fund) To generate income through low volatility absolute return strategies that take advantage of opportunities in the cash and the derivative segments of the equity markets including the arbitrage opportunities available within the derivative segment, by using other derivative based strategies and by investing the balance in debt and money market instruments. However, there is no assurance or guarantee that the investment objective of the Scheme will be achieved. The Scheme does not assure or guarantee any returns. Research Highlights for Axis Arbitrage Fund Below is the key information for Axis Arbitrage Fund Returns up to 1 year are on (Erstwhile Reliance Arbitrage Advantage Fund) The investment objective of the scheme is to generate income by taking advantage of the arbitrage opportunities that potentially exists between cash and derivative market and within the derivative segment along with investments in debt securities & money market instruments. Research Highlights for Nippon India Arbitrage Fund Below is the key information for Nippon India Arbitrage Fund Returns up to 1 year are on 1. Kotak Equity Arbitrage Fund
Kotak Equity Arbitrage Fund
Growth Launch Date 29 Sep 05 NAV (25 Jun 26) ₹39.68 ↑ 0.03 (0.08 %) Net Assets (Cr) ₹72,079 on 31 May 26 Category Hybrid - Arbitrage AMC Kotak Mahindra Asset Management Co Ltd Rating ☆☆☆☆ Risk Moderately Low Expense Ratio 0.97 Sharpe Ratio -0.28 Information Ratio 0 Alpha Ratio 0 Min Investment 5,000 Min SIP Investment 500 Exit Load 0-30 Days (0.25%),30 Days and above(NIL) Growth of 10,000 investment over the years.
Date Value 31 May 21 ₹10,000 31 May 22 ₹10,396 31 May 23 ₹10,989 31 May 24 ₹11,866 31 May 25 ₹12,724 31 May 26 ₹13,421 Returns for Kotak Equity Arbitrage Fund
absolute basis & more than 1 year are on CAGR (Compound Annual Growth Rate) basis. as on 25 Jun 26 Duration Returns 1 Month 0.7% 3 Month 1.5% 6 Month 3.1% 1 Year 6% 3 Year 7% 5 Year 6.2% 10 Year 15 Year Since launch 6.9% Historical performance (Yearly) on absolute basis
Year Returns 2024 6.4% 2023 7.8% 2022 7.4% 2021 4.5% 2020 4% 2019 4.3% 2018 6.1% 2017 6.3% 2016 5.8% 2015 6.7% Fund Manager information for Kotak Equity Arbitrage Fund
Name Since Tenure Hiten Shah 3 Oct 19 6.67 Yr. Data below for Kotak Equity Arbitrage Fund as on 31 May 26
Asset Allocation
Asset Class Value Cash 90.98% Debt 9.32% Other 0.07% Equity Sector Allocation
Sector Value Financial Services 25.64% Basic Materials 8.28% Consumer Cyclical 7.64% Industrials 6.25% Energy 4.26% Communication Services 4.24% Consumer Defensive 3.7% Utility 3.5% Health Care 3.26% Technology 1.1% Real Estate 0.96% Debt Sector Allocation
Sector Value Cash Equivalent 76.11% Corporate 18.36% Government 5.83% Credit Quality
Rating Value AAA 100% Top Securities Holdings / Portfolio
Name Holding Value Quantity Kotak Money Market Dir Gr
Investment Fund | -12% ₹8,145 Cr 17,061,028 Kotak Savings Fund Dir Gr
Investment Fund | -6% ₹4,059 Cr 858,004,118 HDFC Bank Ltd (Financial Services)
Equity, Since 30 Apr 22 | HDFCBANK4% ₹2,791 Cr 36,165,750
↓ -15,628,850 Kotak Liquid Dir Gr
Investment Fund | -3% ₹2,411 Cr 4,303,343
↓ -5,065,660 ICICI Bank Ltd (Financial Services)
Equity, Since 31 Dec 19 | ICICIBANK3% ₹2,053 Cr 16,250,500
↑ 693,000 Kotak Low Duration Dir Gr
Investment Fund | -3% ₹1,904 Cr 4,960,831
↑ 1,567,015 HDFC Bank Ltd.-MAY2026
Derivatives | -2% -₹1,706 Cr 21,979,650
↑ 21,479,700 ICICI Bank Ltd.-MAY2026
Derivatives | -2% -₹1,599 Cr 12,587,400
↑ 6,099,100 Axis Bank Ltd (Financial Services)
Equity, Since 30 Jun 18 | 5322152% ₹1,505 Cr 11,865,625
↓ -1,218,125 Kotak Mahindra Bank Ltd (Financial Services)
Equity, Since 31 Jan 24 | KOTAKBANK2% ₹1,494 Cr 38,968,000
↑ 4,058,000 2. UTI Arbitrage Fund
UTI Arbitrage Fund
Growth Launch Date 22 Jun 06 NAV (25 Jun 26) ₹37.1164 ↑ 0.03 (0.08 %) Net Assets (Cr) ₹10,991 on 31 May 26 Category Hybrid - Arbitrage AMC UTI Asset Management Company Ltd Rating ☆☆☆ Risk Moderately Low Expense Ratio 0.78 Sharpe Ratio -0.21 Information Ratio 0 Alpha Ratio 0 Min Investment 5,000 Min SIP Investment 500 Exit Load 0-30 Days (0.5%),30 Days and above(NIL) Growth of 10,000 investment over the years.
Date Value 31 May 21 ₹10,000 31 May 22 ₹10,369 31 May 23 ₹10,922 31 May 24 ₹11,769 31 May 25 ₹12,621 31 May 26 ₹13,317 Returns for UTI Arbitrage Fund
absolute basis & more than 1 year are on CAGR (Compound Annual Growth Rate) basis. as on 25 Jun 26 Duration Returns 1 Month 0.8% 3 Month 1.5% 6 Month 3% 1 Year 6% 3 Year 7% 5 Year 6% 10 Year 15 Year Since launch 6.8% Historical performance (Yearly) on absolute basis
Year Returns 2024 6.5% 2023 7.7% 2022 7.2% 2021 4% 2020 3.9% 2019 4.4% 2018 6.2% 2017 6.2% 2016 5.7% 2015 6.5% Fund Manager information for UTI Arbitrage Fund
Name Since Tenure Amit Sharma 2 Jul 18 7.92 Yr. Sharwan Kumar Goyal 1 Jan 21 5.41 Yr. Data below for UTI Arbitrage Fund as on 31 May 26
Asset Allocation
Asset Class Value Cash 94.56% Debt 5.7% Other 0.05% Equity Sector Allocation
Sector Value Financial Services 28.78% Basic Materials 7.57% Consumer Cyclical 6.4% Industrials 4.78% Health Care 4.53% Communication Services 4.02% Consumer Defensive 3.72% Energy 3.12% Real Estate 1.61% Technology 1.01% Utility 0.74% Debt Sector Allocation
Sector Value Cash Equivalent 74.39% Corporate 20.8% Government 5.08% Credit Quality
Rating Value AAA 100% Top Securities Holdings / Portfolio
Name Holding Value Quantity UTI Money Market Dir Gr
Investment Fund | -13% ₹1,456 Cr 4,430,086
↑ 228,157 HDFC Bank Ltd (Financial Services)
Equity, Since 30 Apr 22 | HDFCBANK5% ₹589 Cr 7,631,800
↓ -451,550 HDFC BANK LTD.-26-May-2026
Derivatives | -4% -₹420 Cr 5,414,200
↑ 5,149,100 ICICI Bank Ltd (Financial Services)
Equity, Since 30 Sep 24 | ICICIBANK4% ₹392 Cr 3,105,200
↓ -38,500 Kotak Mahindra Bank Ltd (Financial Services)
Equity, Since 30 Jun 23 | KOTAKBANK4% ₹392 Cr 10,224,000
↑ 1,904,000 Reliance Industries Ltd (Energy)
Equity, Since 31 Aug 23 | RELIANCE3% ₹312 Cr 2,179,000
↓ -55,000 KOTAK MAHINDRA BANK LTD.-26-May-2026
Derivatives | -3% -₹304 Cr 7,884,000
↑ 7,818,000 State Bank of India (Financial Services)
Equity, Since 31 May 23 | SBIN3% ₹298 Cr 2,788,500
↑ 56,250 STATE BANK OF INDIA-26-May-2026
Derivatives | -3% -₹297 Cr 2,788,500
↑ 2,788,500 RELIANCE INDUSTRIES LTD.-26-May-2026
Derivatives | -2% -₹253 Cr 1,763,500
↑ 1,413,500 3. Invesco India Arbitrage Fund
Invesco India Arbitrage Fund
Growth Launch Date 30 Apr 07 NAV (25 Jun 26) ₹33.7952 ↑ 0.03 (0.07 %) Net Assets (Cr) ₹28,062 on 31 May 26 Category Hybrid - Arbitrage AMC Invesco Asset Management (India) Private Ltd Rating ☆☆☆ Risk Moderately Low Expense Ratio 1.06 Sharpe Ratio -0.08 Information Ratio 0 Alpha Ratio 0 Min Investment 5,000 Min SIP Investment 500 Exit Load 0-15 Days (0.5%),15 Days and above(NIL) Growth of 10,000 investment over the years.
Date Value 31 May 21 ₹10,000 31 May 22 ₹10,395 31 May 23 ₹11,024 31 May 24 ₹11,880 31 May 25 ₹12,727 31 May 26 ₹13,435 Returns for Invesco India Arbitrage Fund
absolute basis & more than 1 year are on CAGR (Compound Annual Growth Rate) basis. as on 25 Jun 26 Duration Returns 1 Month 0.7% 3 Month 1.5% 6 Month 3% 1 Year 6.1% 3 Year 6.9% 5 Year 6.2% 10 Year 15 Year Since launch 6.6% Historical performance (Yearly) on absolute basis
Year Returns 2024 6.5% 2023 7.6% 2022 7.4% 2021 5.1% 2020 3.5% 2019 4.3% 2018 5.9% 2017 5.9% 2016 5.5% 2015 6.5% Fund Manager information for Invesco India Arbitrage Fund
Name Since Tenure Deepak Gupta 11 Nov 21 4.55 Yr. Manish Kalani 1 Jul 25 0.92 Yr. Data below for Invesco India Arbitrage Fund as on 31 May 26
Asset Allocation
Asset Class Value Cash 97.28% Equity 1.05% Debt 2.96% Equity Sector Allocation
Sector Value Financial Services 26.4% Basic Materials 7.14% Industrials 6.38% Energy 5.77% Consumer Defensive 5.05% Consumer Cyclical 4.38% Health Care 3.76% Communication Services 3.24% Utility 1.72% Technology 1.12% Real Estate 0.54% Debt Sector Allocation
Sector Value Cash Equivalent 78.53% Corporate 19.38% Government 2.34% Credit Quality
Rating Value AA 1.83% AAA 98.17% Top Securities Holdings / Portfolio
Name Holding Value Quantity Future on BANK Index
- | -11% -₹3,116 Cr 97,857,325
↓ -6,365,650 Invesco India Liquid Dir Gr
Investment Fund | -9% ₹2,336 Cr 6,137,898
↑ 790,023 Invesco India Money Market Dir Gr
Investment Fund | -5% ₹1,464 Cr 4,415,910
↓ -1,510,000 State Bank of India (Financial Services)
Equity, Since 31 Jan 23 | SBIN4% ₹1,007 Cr 9,420,750
↓ -116,250 ICICI Bank Ltd (Financial Services)
Equity, Since 31 Oct 24 | ICICIBANK3% ₹930 Cr 7,361,900
↑ 1,635,900 State Bank of India Future May 26
Derivatives | -3% -₹807 Cr 7,579,500
↑ 6,725,250 HDFC Bank Ltd (Financial Services)
Equity, Since 31 Jan 23 | HDFCBANK3% ₹745 Cr 9,656,900
↓ -8,177,950 Varun Beverages Ltd (Consumer Defensive)
Equity, Since 30 Nov 24 | VBL3% ₹720 Cr 14,007,375
↑ 6,457,500 Varun Beverages Limited May 2026 Future
Derivatives | -3% -₹719 Cr 13,905,000
↑ 13,905,000 Cholamandalam Investment And Finance Company Ltd May 2026 Future
Derivatives | -3% -₹701 Cr 4,455,625
↑ 4,455,625 4. HDFC Arbitrage Fund
HDFC Arbitrage Fund
Growth Launch Date 23 Oct 07 NAV (25 Jun 26) ₹32.439 ↑ 0.02 (0.06 %) Net Assets (Cr) ₹25,085 on 31 May 26 Category Hybrid - Arbitrage AMC HDFC Asset Management Company Limited Rating ☆☆☆ Risk Moderately Low Expense Ratio 0.97 Sharpe Ratio -0.24 Information Ratio 0 Alpha Ratio 0 Min Investment 100,000 Min SIP Investment 300 Exit Load 0-1 Months (0.25%),1 Months and above(NIL) Growth of 10,000 investment over the years.
Date Value 31 May 21 ₹10,000 31 May 22 ₹10,345 31 May 23 ₹10,916 31 May 24 ₹11,762 31 May 25 ₹12,597 31 May 26 ₹13,290 Returns for HDFC Arbitrage Fund
absolute basis & more than 1 year are on CAGR (Compound Annual Growth Rate) basis. as on 25 Jun 26 Duration Returns 1 Month 0.7% 3 Month 1.5% 6 Month 3% 1 Year 6% 3 Year 6.9% 5 Year 6% 10 Year 15 Year Since launch 6.5% Historical performance (Yearly) on absolute basis
Year Returns 2024 6.3% 2023 7.7% 2022 7.2% 2021 4.2% 2020 3.6% 2019 3.7% 2018 6% 2017 5.7% 2016 5.3% 2015 6.6% Fund Manager information for HDFC Arbitrage Fund
Name Since Tenure Anil Bamboli 1 Feb 22 4.33 Yr. Arun Agarwal 24 Aug 20 5.77 Yr. Dhruv Muchhal 22 Jun 23 2.94 Yr. Nandita Menezes 29 Mar 25 1.18 Yr. Data below for HDFC Arbitrage Fund as on 31 May 26
Asset Allocation
Asset Class Value Cash 92.32% Debt 7.97% Other 0.05% Equity Sector Allocation
Sector Value Financial Services 22% Basic Materials 10.02% Consumer Cyclical 7.71% Energy 6.39% Industrials 5.93% Consumer Defensive 4.11% Communication Services 3.45% Health Care 2.99% Utility 2.51% Real Estate 0.68% Technology 0.58% Debt Sector Allocation
Sector Value Cash Equivalent 75.15% Corporate 20.54% Government 4.61% Credit Quality
Rating Value AAA 100% Top Securities Holdings / Portfolio
Name Holding Value Quantity HDFC Money Market Dir Gr
Investment Fund | -8% ₹2,060 Cr 3,354,179
↓ -38,198 Future on HDFC Bank Ltd
Derivatives | -7% -₹1,605 Cr 20,719,600
↓ -1,260,600 HDFC Bank Ltd (Financial Services)
Equity, Since 31 Jan 23 | HDFCBANK7% ₹1,599 Cr 20,719,600
↓ -1,260,600 Future on Reliance Industries Ltd
Derivatives | -5% -₹1,126 Cr 7,833,000
↑ 2,103,000 Reliance Industries Ltd (Energy)
Equity, Since 31 Oct 21 | RELIANCE5% ₹1,121 Cr 7,833,000
↑ 2,103,000 HDFC Liquid Dir Gr
Investment Fund | -4% ₹929 Cr 1,704,922 Future on ICICI Bank Ltd
Derivatives | -3% -₹827 Cr 6,481,300
↓ -692,300 ICICI Bank Ltd (Financial Services)
Equity, Since 30 Jun 24 | ICICIBANK3% ₹819 Cr 6,481,300
↓ -692,300 Future on Bharti Airtel Ltd
Derivatives | -3% -₹667 Cr 3,516,425
↑ 1,142,375 Bharti Airtel Ltd (Communication Services)
Equity, Since 31 Oct 23 | BHARTIARTL3% ₹663 Cr 3,516,425
↑ 1,142,375 5. SBI Arbitrage Opportunities Fund
SBI Arbitrage Opportunities Fund
Growth Launch Date 3 Nov 06 NAV (25 Jun 26) ₹35.8077 ↑ 0.03 (0.08 %) Net Assets (Cr) ₹43,266 on 31 May 26 Category Hybrid - Arbitrage AMC SBI Funds Management Private Limited Rating ☆☆ Risk Moderately Low Expense Ratio 0.95 Sharpe Ratio -0.06 Information Ratio 0 Alpha Ratio 0 Min Investment 5,000 Min SIP Investment 500 Exit Load 0-1 Months (0.5%),1 Months and above(NIL) Growth of 10,000 investment over the years.
Date Value 31 May 21 ₹10,000 31 May 22 ₹10,413 31 May 23 ₹11,038 31 May 24 ₹11,884 31 May 25 ₹12,731 31 May 26 ₹13,440 Returns for SBI Arbitrage Opportunities Fund
absolute basis & more than 1 year are on CAGR (Compound Annual Growth Rate) basis. as on 25 Jun 26 Duration Returns 1 Month 0.7% 3 Month 1.5% 6 Month 3% 1 Year 6% 3 Year 6.9% 5 Year 6.2% 10 Year 15 Year Since launch 6.7% Historical performance (Yearly) on absolute basis
Year Returns 2024 6.5% 2023 7.5% 2022 7.4% 2021 4.6% 2020 4% 2019 3.5% 2018 6% 2017 6.2% 2016 5.3% 2015 6.4% Fund Manager information for SBI Arbitrage Opportunities Fund
Name Since Tenure Neeraj Kumar 5 Oct 12 13.66 Yr. Ardhendu Bhattacharya 27 Dec 24 1.43 Yr. Data below for SBI Arbitrage Opportunities Fund as on 31 May 26
Asset Allocation
Asset Class Value Cash 98.77% Debt 1.85% Other 0.05% Equity Sector Allocation
Sector Value Financial Services 27.84% Basic Materials 7.69% Industrials 7.6% Consumer Cyclical 5.51% Energy 4.19% Health Care 4.16% Communication Services 4.05% Consumer Defensive 3.88% Utility 2.97% Real Estate 1.84% Technology 1.26% Debt Sector Allocation
Sector Value Cash Equivalent 87.7% Corporate 9.85% Government 2.71% Credit Quality
Rating Value AA 1.63% AAA 98.37% Top Securities Holdings / Portfolio
Name Holding Value Quantity SBI Savings Dir Gr
Investment Fund | -8% ₹3,400 Cr 726,722,883 SBI Liquid Dir Gr
Investment Fund | -6% ₹2,456 Cr 5,666,562
↓ -1,157,892 HDFC Bank Ltd (Financial Services)
Equity, Since 30 Apr 22 | HDFCBANK5% ₹2,247 Cr 29,115,350
↓ -1,584,550 ICICI Bank Ltd (Financial Services)
Equity, Since 30 Jun 21 | ICICIBANK4% ₹1,632 Cr 12,917,800
↑ 763,700 State Bank of India (Financial Services)
Equity, Since 31 May 23 | SBIN3% ₹1,431 Cr 13,397,250
↑ 7,580,250 Icici Bank Ltd. 26-May-26
Derivatives | -3% -₹1,347 Cr 10,600,100
↑ 10,600,100 Hdfc Bank Ltd. 30-Jun-26
Derivatives | -3% -₹1,235 Cr 16,065,500
↑ 16,065,500 State Bank Of India 26-May-26
Derivatives | -3% -₹1,138 Cr 10,696,500
↑ 10,696,500 SBI Low Duration Dir Gr
Investment Fund | -3% ₹1,107 Cr 2,904,125 Hdfc Bank Ltd. 26-May-26
Derivatives | -2% -₹1,009 Cr 12,999,800
↑ 12,999,800 6. ICICI Prudential Equity Arbitrage Fund
ICICI Prudential Equity Arbitrage Fund
Growth Launch Date 30 Dec 06 NAV (25 Jun 26) ₹36.32 ↑ 0.03 (0.09 %) Net Assets (Cr) ₹32,260 on 31 May 26 Category Hybrid - Arbitrage AMC ICICI Prudential Asset Management Company Limited Rating ☆☆☆☆ Risk Moderate Expense Ratio 0.9 Sharpe Ratio -0.3 Information Ratio 0 Alpha Ratio 0 Min Investment 5,000 Min SIP Investment 1,000 Exit Load 0-1 Months (0.25%),1 Months and above(NIL) Growth of 10,000 investment over the years.
Date Value 31 May 21 ₹10,000 31 May 22 ₹10,367 31 May 23 ₹10,944 31 May 24 ₹11,777 31 May 25 ₹12,625 31 May 26 ₹13,314 Returns for ICICI Prudential Equity Arbitrage Fund
absolute basis & more than 1 year are on CAGR (Compound Annual Growth Rate) basis. as on 25 Jun 26 Duration Returns 1 Month 0.7% 3 Month 1.5% 6 Month 3% 1 Year 6% 3 Year 6.9% 5 Year 6% 10 Year 15 Year Since launch 6.8% Historical performance (Yearly) on absolute basis
Year Returns 2024 6.5% 2023 7.6% 2022 7.1% 2021 4.2% 2020 3.9% 2019 4.3% 2018 5.9% 2017 6.2% 2016 5.5% 2015 6.8% Fund Manager information for ICICI Prudential Equity Arbitrage Fund
Name Since Tenure Nikhil Kabra 29 Dec 20 5.42 Yr. Sharmila D'Silva 31 Jul 22 3.84 Yr. Darshil Dedhia 13 Sep 24 1.71 Yr. Ajaykumar Solanki 23 Aug 24 1.77 Yr. Archana Nair 1 Feb 24 2.33 Yr. Data below for ICICI Prudential Equity Arbitrage Fund as on 31 May 26
Asset Allocation
Asset Class Value Cash 93.68% Debt 6.6% Other 0.05% Equity Sector Allocation
Sector Value Financial Services 22.91% Communication Services 8.75% Basic Materials 6.96% Consumer Cyclical 5.78% Industrials 5.44% Health Care 5.2% Energy 3.77% Consumer Defensive 3.53% Utility 1.89% Real Estate 1.47% Technology 1.03% Debt Sector Allocation
Sector Value Cash Equivalent 73.28% Corporate 21.86% Government 5.14% Credit Quality
Rating Value AAA 100% Top Securities Holdings / Portfolio
Name Holding Value Quantity ICICI Pru Money Market Dir Gr
Investment Fund | -16% ₹5,174 Cr 127,933,512 Bharti Airtel Ltd. $$
Derivatives | -6% -₹1,903 Cr 10,013,000
↑ 10,013,000 Bharti Airtel Ltd (Communication Services)
Equity, Since 31 Dec 23 | BHARTIARTL6% ₹1,889 Cr 10,013,000
↑ 514,425 Hdfc Bank Ltd. $$
Derivatives | -3% -₹1,129 Cr 14,628,900
↑ 14,628,900 HDFC Bank Ltd (Financial Services)
Equity, Since 30 Nov 21 | HDFCBANK3% ₹1,129 Cr 14,628,900
↓ -8,632,800 State Bank of India (Financial Services)
Equity, Since 31 Jan 23 | SBIN3% ₹1,056 Cr 9,888,000
↑ 3,418,500 State Bank Of India $$
Derivatives | -3% -₹1,052 Cr 9,888,000
↑ 9,888,000 Vodafone Idea Ltd. $$
Derivatives | -3% -₹877 Cr 855,126,900
↑ 855,126,900 Vodafone Idea Ltd (Communication Services)
Equity, Since 30 Sep 23 | 5328223% ₹874 Cr 855,126,900
↓ -15,795,975 Reliance Industries Ltd. $$
Derivatives | -3% -₹826 Cr 5,753,500
↑ 5,753,500 7. Edelweiss Arbitrage Fund
Edelweiss Arbitrage Fund
Growth Launch Date 27 Jun 14 NAV (25 Jun 26) ₹20.5045 ↑ 0.02 (0.09 %) Net Assets (Cr) ₹14,862 on 31 May 26 Category Hybrid - Arbitrage AMC Edelweiss Asset Management Limited Rating ☆☆☆☆☆ Risk Moderately Low Expense Ratio 1.07 Sharpe Ratio -0.4 Information Ratio -1.79 Alpha Ratio -0.82 Min Investment 5,000 Min SIP Investment 500 Exit Load 0-30 Days (0.25%),30 Days and above(NIL) Growth of 10,000 investment over the years.
Date Value 31 May 21 ₹10,000 31 May 22 ₹10,387 31 May 23 ₹10,966 31 May 24 ₹11,817 31 May 25 ₹12,650 31 May 26 ₹13,337 Returns for Edelweiss Arbitrage Fund
absolute basis & more than 1 year are on CAGR (Compound Annual Growth Rate) basis. as on 25 Jun 26 Duration Returns 1 Month 0.7% 3 Month 1.5% 6 Month 3% 1 Year 5.9% 3 Year 6.9% 5 Year 6% 10 Year 15 Year Since launch 6.2% Historical performance (Yearly) on absolute basis
Year Returns 2024 6.3% 2023 7.7% 2022 7.1% 2021 4.4% 2020 3.8% 2019 4.5% 2018 6.2% 2017 6.1% 2016 5.8% 2015 6.7% Fund Manager information for Edelweiss Arbitrage Fund
Name Since Tenure Bhavesh Jain 27 Jun 14 11.94 Yr. Rahul Dedhia 15 Jan 26 0.37 Yr. Amit Vora 6 Nov 24 1.57 Yr. Hetul Raval 22 Sep 25 0.69 Yr. Data below for Edelweiss Arbitrage Fund as on 31 May 26
Asset Allocation
Asset Class Value Cash 92.95% Debt 7.33% Other 0.04% Equity Sector Allocation
Sector Value Financial Services 22.66% Basic Materials 8.69% Industrials 5.48% Consumer Cyclical 5.41% Utility 4.69% Health Care 4.33% Communication Services 4.19% Energy 3.88% Consumer Defensive 3.37% Real Estate 2.12% Technology 1.24% Debt Sector Allocation
Sector Value Cash Equivalent 74.18% Corporate 20.01% Government 6.1% Credit Quality
Rating Value AAA 100% Top Securities Holdings / Portfolio
Name Holding Value Quantity Edelweiss Liquid Dir Gr
Investment Fund | -8% ₹1,174 Cr 3,273,844
↓ -2,374,252 HDFC Bank Ltd (Financial Services)
Equity, Since 31 Mar 21 | HDFCBANK5% ₹674 Cr 8,737,850
↓ -5,697,450 Edelweiss Money Market Dir Gr
Investment Fund | -4% ₹564 Cr 171,039,989 Hdfc Bank Ltd.26/05/2026
Derivatives | -4% -₹535 Cr 6,899,200
↑ 6,899,200 Nmdc Ltd.26/05/2026
Derivatives | -2% -₹359 Cr 39,534,750
↑ 39,534,750 NMDC Ltd (Basic Materials)
Equity, Since 30 Nov 22 | 5263712% ₹357 Cr 39,534,750
↓ -2,058,750 ICICI Bank Ltd (Financial Services)
Equity, Since 30 Apr 20 | ICICIBANK2% ₹339 Cr 2,684,500
↓ -957,600 Vodafone Idea Ltd.26/05/2026
Derivatives | -2% -₹330 Cr 321,566,025
↑ 321,566,025 Vodafone Idea Ltd (Communication Services)
Equity, Since 31 May 20 | 5328222% ₹329 Cr 321,566,025
↓ -1,358,025 Adani Energy Solutions Ltd.26/05/2026
Derivatives | -2% -₹296 Cr 2,190,375
↑ 2,190,375 8. Aditya Birla Sun Life Arbitrage Fund
Aditya Birla Sun Life Arbitrage Fund
Growth Launch Date 24 Jul 09 NAV (25 Jun 26) ₹28.1033 ↑ 0.02 (0.08 %) Net Assets (Cr) ₹26,280 on 31 May 26 Category Hybrid - Arbitrage AMC Birla Sun Life Asset Management Co Ltd Rating ☆☆☆ Risk Moderate Expense Ratio 1.01 Sharpe Ratio -0.4 Information Ratio 0 Alpha Ratio 0 Min Investment 1,000 Min SIP Investment 1,000 Exit Load 0-30 Days (0.5%),30 Days and above(NIL) Growth of 10,000 investment over the years.
Date Value 31 May 21 ₹10,000 31 May 22 ₹10,359 31 May 23 ₹10,921 31 May 24 ₹11,751 31 May 25 ₹12,587 31 May 26 ₹13,266 Returns for Aditya Birla Sun Life Arbitrage Fund
absolute basis & more than 1 year are on CAGR (Compound Annual Growth Rate) basis. as on 25 Jun 26 Duration Returns 1 Month 0.7% 3 Month 1.5% 6 Month 3% 1 Year 5.9% 3 Year 6.8% 5 Year 5.9% 10 Year 15 Year Since launch 6.3% Historical performance (Yearly) on absolute basis
Year Returns 2024 6.4% 2023 7.5% 2022 7.1% 2021 4.1% 2020 3.8% 2019 4.1% 2018 6.2% 2017 6% 2016 5.6% 2015 6.5% Fund Manager information for Aditya Birla Sun Life Arbitrage Fund
Name Since Tenure Lovelish Solanki 15 Dec 14 11.47 Yr. Mohit Sharma 3 Mar 25 1.25 Yr. Krina Mehta 2 Oct 25 0.66 Yr. Data below for Aditya Birla Sun Life Arbitrage Fund as on 31 May 26
Asset Allocation
Asset Class Value Cash 90.93% Debt 9.36% Other 0.05% Equity Sector Allocation
Sector Value Financial Services 24.44% Basic Materials 8.41% Consumer Cyclical 6.63% Energy 5.81% Industrials 5.38% Communication Services 4.64% Consumer Defensive 3.75% Health Care 3.56% Utility 2.53% Real Estate 1.12% Technology 1.08% Debt Sector Allocation
Sector Value Cash Equivalent 77.11% Corporate 15.87% Government 7.32% Credit Quality
Rating Value AA 5.45% AAA 94.55% Top Securities Holdings / Portfolio
Name Holding Value Quantity Aditya BSL Money Mgr Dir Gr
Investment Fund | -10% ₹2,663 Cr 67,468,928
↓ -5,066,094 Future on HDFC Bank Ltd
Derivatives | -6% -₹1,466 Cr HDFC Bank Ltd (Financial Services)
Equity, Since 31 Dec 21 | HDFCBANK6% ₹1,459 Cr 18,911,200
↑ 1,100 Aditya BSL Liquid Dir Gr
Investment Fund | -4% ₹1,139 Cr 25,423,782
↑ 11,165,453 Future on Reliance Industries Ltd
Derivatives | -4% -₹1,053 Cr Reliance Industries Ltd (Energy)
Equity, Since 30 Jun 18 | RELIANCE4% ₹1,048 Cr 7,327,500
↑ 138,500 Aditya BSL FRF Dir Gr
Investment Fund | -4% ₹935 Cr 24,863,082
↓ -3,272,686 Future on ICICI Bank Ltd
Derivatives | -3% -₹721 Cr ICICI Bank Ltd (Financial Services)
Equity, Since 31 May 24 | ICICIBANK3% ₹715 Cr 5,657,400
↓ -268,100 Future on Axis Bank Ltd
Derivatives | -2% -₹602 Cr 9. Axis Arbitrage Fund
Axis Arbitrage Fund
Growth Launch Date 14 Aug 14 NAV (25 Jun 26) ₹19.777 ↑ 0.02 (0.09 %) Net Assets (Cr) ₹9,781 on 31 May 26 Category Hybrid - Arbitrage AMC Axis Asset Management Company Limited Rating ☆☆ Risk Moderate Expense Ratio 1 Sharpe Ratio -0.44 Information Ratio 0 Alpha Ratio 0 Min Investment 5,000 Min SIP Investment 1,000 Exit Load 0-7 Days (0.25%),7 Days and above(NIL) Growth of 10,000 investment over the years.
Date Value 31 May 21 ₹10,000 31 May 22 ₹10,403 31 May 23 ₹10,942 31 May 24 ₹11,771 31 May 25 ₹12,595 31 May 26 ₹13,274 Returns for Axis Arbitrage Fund
absolute basis & more than 1 year are on CAGR (Compound Annual Growth Rate) basis. as on 25 Jun 26 Duration Returns 1 Month 0.7% 3 Month 1.5% 6 Month 3% 1 Year 5.9% 3 Year 6.8% 5 Year 6% 10 Year 15 Year Since launch 5.9% Historical performance (Yearly) on absolute basis
Year Returns 2024 6.3% 2023 7.6% 2022 6.9% 2021 4.2% 2020 3.8% 2019 4.1% 2018 5.8% 2017 6.1% 2016 5.2% 2015 6.9% Fund Manager information for Axis Arbitrage Fund
Name Since Tenure Devang Shah 14 Aug 14 11.81 Yr. Sachin Jain 9 Nov 21 4.56 Yr. Data below for Axis Arbitrage Fund as on 31 May 26
Asset Allocation
Asset Class Value Cash 97.11% Debt 3.19% Other 0.04% Equity Sector Allocation
Sector Value Financial Services 23.83% Basic Materials 8.23% Consumer Cyclical 8.16% Industrials 7.62% Energy 4.44% Communication Services 3.95% Health Care 3.8% Consumer Defensive 3.46% Utility 1.98% Real Estate 1.57% Technology 0.81% Debt Sector Allocation
Sector Value Cash Equivalent 76.92% Corporate 19.24% Government 4.14% Credit Quality
Rating Value AAA 100% Top Securities Holdings / Portfolio
Name Holding Value Quantity Axis Money Market Dir Gr
Investment Fund | -15% ₹1,421 Cr 9,335,000
↑ 3,025,844 Future on BANK Index
- | -13% -₹1,281 Cr 36,126,950
↓ -35,875 HDFC Bank Ltd (Financial Services)
Equity, Since 28 Feb 23 | HDFCBANK4% ₹428 Cr 5,551,700
↓ -515,350 ICICI Bank Ltd (Financial Services)
Equity, Since 30 Nov 24 | ICICIBANK3% ₹310 Cr 2,451,400
↑ 88,900 Reliance Industries Ltd (Energy)
Equity, Since 31 Mar 20 | RELIANCE3% ₹283 Cr 1,979,000
↑ 529,000 Bharti Airtel Ltd (Communication Services)
Equity, Since 31 Aug 24 | BHARTIARTL3% ₹246 Cr 1,305,775
↑ 277,400 Kotak Mahindra Bank Ltd (Financial Services)
Equity, Since 30 Jun 23 | KOTAKBANK2% ₹238 Cr 6,210,000
↑ 366,000 Reliance Industries Limited May 2026 Future
Derivatives | -2% -₹211 Cr 1,471,500
↑ 1,471,500 Bharti Airtel Limited May 2026 Future
Derivatives | -2% -₹207 Cr 1,090,125
↑ 1,090,125 Bharat Heavy Electricals Ltd (Industrials)
Equity, Since 31 Mar 25 | 5001032% ₹192 Cr 5,446,875
↑ 1,913,625 10. Nippon India Arbitrage Fund
Nippon India Arbitrage Fund
Growth Launch Date 14 Oct 10 NAV (25 Jun 26) ₹28.0808 ↑ 0.02 (0.08 %) Net Assets (Cr) ₹16,184 on 31 May 26 Category Hybrid - Arbitrage AMC Nippon Life Asset Management Ltd. Rating ☆☆☆☆ Risk Moderately Low Expense Ratio 1.07 Sharpe Ratio -0.48 Information Ratio 0 Alpha Ratio 0 Min Investment 5,000 Min SIP Investment 100 Exit Load 0-1 Months (0.25%),1 Months and above(NIL) Growth of 10,000 investment over the years.
Date Value 31 May 21 ₹10,000 31 May 22 ₹10,376 31 May 23 ₹10,937 31 May 24 ₹11,767 31 May 25 ₹12,573 31 May 26 ₹13,251 Returns for Nippon India Arbitrage Fund
absolute basis & more than 1 year are on CAGR (Compound Annual Growth Rate) basis. as on 25 Jun 26 Duration Returns 1 Month 0.7% 3 Month 1.5% 6 Month 3% 1 Year 5.9% 3 Year 6.8% 5 Year 5.9% 10 Year 15 Year Since launch 6.8% Historical performance (Yearly) on absolute basis
Year Returns 2024 6.2% 2023 7.5% 2022 7% 2021 4.2% 2020 3.8% 2019 4.3% 2018 6.2% 2017 6.8% 2016 5.5% 2015 6.6% Fund Manager information for Nippon India Arbitrage Fund
Name Since Tenure Kinjal Desai 25 May 18 8.02 Yr. Vikash Agarwal 14 Sep 24 1.71 Yr. Nemish Sheth 21 Mar 25 1.19 Yr. Rohit Shah 8 Apr 24 2.15 Yr. Amber Singhania 11 Mar 26 0.22 Yr. Data below for Nippon India Arbitrage Fund as on 31 May 26
Asset Allocation
Asset Class Value Cash 91.41% Debt 8.87% Other 0.05% Equity Sector Allocation
Sector Value Financial Services 24.47% Basic Materials 9.6% Consumer Cyclical 8.95% Industrials 5.44% Communication Services 4.71% Energy 4.48% Health Care 4.46% Consumer Defensive 2.98% Utility 1.88% Real Estate 1.38% Technology 1.17% Debt Sector Allocation
Sector Value Cash Equivalent 80.32% Corporate 16.29% Government 3.67% Credit Quality
Rating Value AA 30.64% AAA 69.36% Top Securities Holdings / Portfolio
Name Holding Value Quantity Nippon India Money Market Dir Gr
Investment Fund | -14% ₹2,237 Cr 5,053,325 Nippon India U/ST Duration Dir Gr
Investment Fund | -6% ₹989 Cr 2,108,547 HDFC Bank Ltd (Financial Services)
Equity, Since 31 Jan 23 | HDFCBANK5% ₹877 Cr 11,366,750
↑ 1,023,450 Bharti Airtel Ltd (Communication Services)
Equity, Since 31 Oct 23 | BHARTIARTL3% ₹495 Cr 2,622,950
↑ 622,725 ICICI Bank Ltd (Financial Services)
Equity, Since 31 Oct 24 | ICICIBANK3% ₹446 Cr 3,529,400
↓ -838,600 Hdfc Bank Limited_30/06/2026
Derivatives | -3% -₹437 Cr 5,687,550
↑ 5,687,550 Hdfc Bank Limited_26/05/2026
Derivatives | -3% -₹434 Cr 5,586,900
↑ 5,586,900 Reliance Industries Ltd (Energy)
Equity, Since 31 Dec 17 | RELIANCE3% ₹417 Cr 2,914,500
↓ -96,000 Axis Bank Ltd (Financial Services)
Equity, Since 31 Jul 23 | 5322152% ₹351 Cr 2,769,375
↓ -14,375 Jsw Steel Limited_26/05/2026
Derivatives | -2% -₹345 Cr 2,712,825
↑ 2,712,825
ആർബിട്രേജ് ഫണ്ടുകളിൽ ഓൺലൈനിൽ എങ്ങനെ നിക്ഷേപിക്കാം?
Fincash.com-ൽ ആജീവനാന്ത സൗജന്യ നിക്ഷേപ അക്കൗണ്ട് തുറക്കുക.
നിങ്ങളുടെ രജിസ്ട്രേഷനും KYC പ്രക്രിയയും പൂർത്തിയാക്കുക
രേഖകൾ അപ്ലോഡ് ചെയ്യുക (പാൻ, ആധാർ മുതലായവ).കൂടാതെ, നിങ്ങൾ നിക്ഷേപിക്കാൻ തയ്യാറാണ്!
ഉപസംഹാരം
ഹ്രസ്വകാല നിക്ഷേപകർ ആർബിട്രേജ് ഫണ്ടുകൾ പരിഗണിക്കണം, പ്രത്യേകിച്ച് അവരുടെ അനുകൂലമായ നികുതി ചികിത്സയ്ക്കായി. എന്നിരുന്നാലും, ഈ ഫണ്ടുകൾക്ക് ഇക്വിറ്റി ഫണ്ടുകൾക്കോ ഡെറ്റ് ഫണ്ടുകൾക്കോ പകരമാകാൻ കഴിയില്ല. അതിനാൽ, അടുത്ത തവണ നിങ്ങൾ ഹ്രസ്വകാല നിക്ഷേപ ഓപ്ഷനുകൾക്കായി തിരയുമ്പോൾ, ആർബിട്രേജ് ഫണ്ടുകളെക്കുറിച്ച് ചിന്തിക്കുക.
ഇവിടെ നൽകിയിരിക്കുന്ന വിവരങ്ങൾ കൃത്യമാണെന്ന് ഉറപ്പാക്കാൻ എല്ലാ ശ്രമങ്ങളും നടത്തിയിട്ടുണ്ട്. എന്നിരുന്നാലും, ഡാറ്റയുടെ കൃത്യത സംബന്ധിച്ച് യാതൊരു ഉറപ്പും നൽകുന്നില്ല. എന്തെങ്കിലും നിക്ഷേപം നടത്തുന്നതിന് മുമ്പ് സ്കീം വിവര രേഖ ഉപയോഗിച്ച് പരിശോധിക്കുക.


?")

AMFI Registration No. 112358 | CIN: U74999MH2016PTC282153
Shepard Technologies Pvt. Ltd. (with ARN code 112358) makes no warranties or representations, express or implied, on products offered through the platform. It accepts no liability for any damages or losses, however caused, in connection with the use of, or on the reliance of its product or related services. Terms and conditions of the website are applicable.
©2026 Shepard Technologies Private Limited. All Rights Reserved
Research Highlights for Kotak Equity Arbitrage Fund