
 +91-22-48913909
7 ਭਾਰਤ ਵਿੱਚ ਫੰਡਾਂ ਦਾ ਸਭ ਤੋਂ ਵਧੀਆ ਫੰਡ 2022
ਫੰਡ ਦੇ ਫੰਡ ਦੇ ਇੱਕ ਹੈਚੋਟੀ ਦੇ ਮਿਉਚੁਅਲ ਫੰਡ ਉਨ੍ਹਾਂ ਨਿਵੇਸ਼ਕਾਂ ਲਈ ਜਿਨ੍ਹਾਂ ਦੀ ਨਿਵੇਸ਼ ਰਾਸ਼ੀ ਬਹੁਤ ਜ਼ਿਆਦਾ ਨਹੀਂ ਹੈ ਅਤੇ ਕਈ ਫੰਡਾਂ ਦੀ ਬਜਾਏ ਇੱਕ ਫੰਡ (ਫੰਡਾਂ ਦਾ ਫੰਡ) ਦਾ ਪ੍ਰਬੰਧਨ ਕਰਨਾ ਆਸਾਨ ਹੈ।ਮਿਉਚੁਅਲ ਫੰਡ. ਮਿਉਚੁਅਲ ਫੰਡ ਨਿਵੇਸ਼ ਰਣਨੀਤੀ ਦੇ ਇਸ ਰੂਪ ਵਿੱਚ, ਨਿਵੇਸ਼ਕ ਇੱਕ ਸਿੰਗਲ ਫੰਡ ਦੀ ਛਤਰੀ ਹੇਠ ਬਹੁਤ ਸਾਰੇ ਫੰਡ ਰੱਖਦੇ ਹਨ, ਇਸਲਈ ਫੰਡਾਂ ਦਾ ਨਾਮ ਫੰਡ ਹੈ।
ਅਕਸਰ ਮਲਟੀ-ਪ੍ਰਬੰਧਕ ਨਿਵੇਸ਼ ਦੇ ਨਾਮ ਦੁਆਰਾ ਜਾ ਰਿਹਾ ਹੈ; ਇਸ ਨੂੰ ਮਿਉਚੁਅਲ ਫੰਡ ਸ਼੍ਰੇਣੀਆਂ ਵਿੱਚੋਂ ਇੱਕ ਮੰਨਿਆ ਜਾਂਦਾ ਹੈ। ਮਲਟੀ-ਮੈਨੇਜਰ ਨਿਵੇਸ਼ਾਂ ਦਾ ਇੱਕ ਮੁੱਖ ਫਾਇਦਾ ਇਹ ਹੈ ਕਿ ਘੱਟ ਟਿਕਟ ਦੇ ਆਕਾਰ 'ਤੇ,ਨਿਵੇਸ਼ਕ ਮਿਉਚੁਅਲ ਫੰਡ ਸਕੀਮਾਂ ਦੇ ਇੱਕ ਸਮੂਹ ਵਿੱਚ ਆਪਣੇ ਆਪ ਨੂੰ ਵਿਭਿੰਨ ਬਣਾ ਸਕਦੇ ਹਨ। ਇਸ ਲਈ ਆਓ ਅਸੀਂ ਫੰਡਾਂ ਦੇ ਫੰਡ ਦੇ ਕਈ ਪਹਿਲੂਆਂ ਜਿਵੇਂ ਕਿ ਫੰਡਾਂ ਦੇ ਫੰਡ ਵਿੱਚ ਨਿਵੇਸ਼ ਕਿਉਂ ਕਰੀਏ, ਫੰਡਾਂ ਦੇ ਫੰਡ ਦੇ ਫਾਇਦੇ, ਭਾਰਤ ਵਿੱਚ ਫੰਡਾਂ ਦਾ ਫੰਡ, ਫੰਡਾਂ ਦੇ ਫੰਡ ਦੀ ਕਾਰਗੁਜ਼ਾਰੀ, ਅਤੇ ਹੋਰ ਮਹੱਤਵਪੂਰਨ ਪਹਿਲੂਆਂ ਵਿੱਚੋਂ ਲੰਘੀਏ।
ਫੰਡ ਦੇ ਫੰਡ ਕੀ ਹਨ?
ਸਰਲ ਸ਼ਬਦਾਂ ਵਿਚ, ਏਮਿਉਚੁਅਲ ਫੰਡ ਨਿਵੇਸ਼ ਕਿਸੇ ਹੋਰ ਮਿਉਚੁਅਲ ਫੰਡ (ਇੱਕ ਜਾਂ ਸ਼ਾਇਦ ਇੱਕ ਤੋਂ ਵੱਧ) ਵਿੱਚ ਪੈਸੇ ਦੇ ਇਸ ਦੇ ਇਕੱਠੇ ਕੀਤੇ ਪੂਲ ਨੂੰ ਫੰਡਾਂ ਦਾ ਫੰਡ ਕਿਹਾ ਜਾਂਦਾ ਹੈ। ਆਪਣੇ ਪੋਰਟਫੋਲੀਓ ਵਿੱਚ ਨਿਵੇਸ਼ਕ ਵੱਖ-ਵੱਖ ਫੰਡਾਂ ਦਾ ਐਕਸਪੋਜ਼ਰ ਲੈਂਦੇ ਹਨ ਅਤੇ ਉਹਨਾਂ ਦਾ ਵੱਖਰੇ ਤੌਰ 'ਤੇ ਟਰੈਕ ਰੱਖਦੇ ਹਨ। ਹਾਲਾਂਕਿ, ਦੁਆਰਾਨਿਵੇਸ਼ ਮਲਟੀ-ਮੈਨੇਜਰ ਮਿਉਚੁਅਲ ਫੰਡਾਂ ਵਿੱਚ ਇਹ ਪ੍ਰਕਿਰਿਆ ਵਧੇਰੇ ਸਰਲ ਹੋ ਜਾਂਦੀ ਹੈ ਕਿਉਂਕਿ ਨਿਵੇਸ਼ਕਾਂ ਨੂੰ ਸਿਰਫ਼ ਇੱਕ ਫੰਡ ਨੂੰ ਟਰੈਕ ਕਰਨ ਦੀ ਲੋੜ ਹੁੰਦੀ ਹੈ, ਜੋ ਬਦਲੇ ਵਿੱਚ ਇਸ ਦੇ ਅੰਦਰ ਬਹੁਤ ਸਾਰੇ ਮਿਉਚੁਅਲ ਫੰਡ ਰੱਖਦਾ ਹੈ। ਮੰਨ ਲਓ ਕਿ ਕਿਸੇ ਵਿਅਕਤੀ ਨੇ 10 ਵੱਖ-ਵੱਖ ਫੰਡਾਂ ਵਿੱਚ ਨਿਵੇਸ਼ ਕੀਤਾ ਹੈ, ਜਿਸ ਵਿੱਚ ਵੱਖ-ਵੱਖ ਵਿੱਤੀ ਸੰਪਤੀਆਂ ਜਿਵੇਂ ਕਿ ਸਟਾਕ,ਬਾਂਡ, ਸਰਕਾਰੀ ਪ੍ਰਤੀਭੂਤੀਆਂ, ਸੋਨਾ, ਆਦਿ। ਹਾਲਾਂਕਿ, ਉਸਨੂੰ ਉਹਨਾਂ ਫੰਡਾਂ ਦਾ ਪ੍ਰਬੰਧਨ ਕਰਨ ਵਿੱਚ ਮੁਸ਼ਕਲ ਆਉਂਦੀ ਹੈ ਕਿਉਂਕਿ ਉਸਨੂੰ ਹਰੇਕ ਫੰਡ ਦਾ ਵੱਖਰੇ ਤੌਰ 'ਤੇ ਟਰੈਕ ਰੱਖਣ ਦੀ ਲੋੜ ਹੁੰਦੀ ਹੈ। ਇਸ ਲਈ, ਅਜਿਹੀਆਂ ਮੁਸ਼ਕਲਾਂ ਤੋਂ ਬਚਣ ਲਈ, ਨਿਵੇਸ਼ਕ ਇੱਕ ਬਹੁ-ਪ੍ਰਬੰਧਨ ਨਿਵੇਸ਼ (ਜਾਂ ਫੰਡਾਂ ਦੀ ਇੱਕ ਸਿੰਗਲ ਫੰਡ ਰਣਨੀਤੀ) ਵਿੱਚ ਪੈਸਾ ਨਿਵੇਸ਼ ਕਰਦਾ ਹੈ ਜਿਸਦੀ ਵੱਖ-ਵੱਖ ਮਿਉਚੁਅਲ ਫੰਡਾਂ ਵਿੱਚ ਹਿੱਸੇਦਾਰੀ ਹੁੰਦੀ ਹੈ।
ਫੰਡਾਂ ਦੇ ਫੰਡ ਦੀਆਂ ਕਿਸਮਾਂ ਕੀ ਹਨ?
1. ਸੰਪੱਤੀ ਵੰਡ ਫੰਡ
ਇਹਨਾਂ ਫੰਡਾਂ ਵਿੱਚ ਇੱਕ ਵਿਭਿੰਨ ਸੰਪੱਤੀ ਪੂਲ ਸ਼ਾਮਲ ਹੁੰਦਾ ਹੈ - ਜਿਸ ਵਿੱਚ ਇਕੁਇਟੀ, ਕਰਜ਼ੇ ਦੇ ਯੰਤਰ, ਕੀਮਤੀ ਧਾਤਾਂ ਆਦਿ ਸ਼ਾਮਲ ਹੁੰਦੇ ਹਨ।ਸੰਪੱਤੀ ਵੰਡ ਪੋਰਟਫੋਲੀਓ ਵਿੱਚ ਮੌਜੂਦ ਮੁਕਾਬਲਤਨ ਸਥਿਰ ਪ੍ਰਤੀਭੂਤੀਆਂ ਦੁਆਰਾ ਗਾਰੰਟੀਸ਼ੁਦਾ ਘੱਟ ਜੋਖਮ ਪੱਧਰ 'ਤੇ, ਵਧੀਆ ਪ੍ਰਦਰਸ਼ਨ ਕਰਨ ਵਾਲੇ ਸਾਧਨ ਦੁਆਰਾ ਉੱਚ ਰਿਟਰਨ ਪੈਦਾ ਕਰਨ ਲਈ ਫੰਡ।
2. ਗੋਲਡ ਫੰਡ
ਵੱਖ-ਵੱਖ ਮਿਉਚੁਅਲ ਫੰਡਾਂ ਵਿੱਚ ਨਿਵੇਸ਼ ਕਰਨਾ, ਮੁੱਖ ਤੌਰ 'ਤੇ ਸੋਨੇ ਦੀਆਂ ਪ੍ਰਤੀਭੂਤੀਆਂ ਵਿੱਚ ਵਪਾਰ ਕਰਨਾ ਸੋਨੇ ਦੇ ਫੰਡ ਹਨ। ਸਬੰਧਤ ਸੰਪੱਤੀ ਪ੍ਰਬੰਧਨ ਕੰਪਨੀ 'ਤੇ ਨਿਰਭਰ ਕਰਦੇ ਹੋਏ, ਇਸ ਸ਼੍ਰੇਣੀ ਨਾਲ ਸਬੰਧਤ ਫੰਡਾਂ ਦੇ ਫੰਡਾਂ ਵਿੱਚ ਮਿਉਚੁਅਲ ਫੰਡ ਜਾਂ ਸੋਨੇ ਦੀਆਂ ਵਪਾਰਕ ਕੰਪਨੀਆਂ ਦਾ ਪੋਰਟਫੋਲੀਓ ਹੋ ਸਕਦਾ ਹੈ।
3. ਫੰਡਾਂ ਦਾ ਅੰਤਰਰਾਸ਼ਟਰੀ ਫੰਡ
ਵਿਦੇਸ਼ਾਂ ਵਿੱਚ ਕੰਮ ਕਰਨ ਵਾਲੇ ਮਿਉਚੁਅਲ ਫੰਡਾਂ ਨੂੰ ਨਿਸ਼ਾਨਾ ਬਣਾਇਆ ਜਾਂਦਾ ਹੈਅੰਤਰਰਾਸ਼ਟਰੀ ਫੰਡ ਫੰਡ ਦੇ. ਇਹ ਨਿਵੇਸ਼ਕਾਂ ਨੂੰ ਸਬੰਧਤ ਦੇਸ਼ ਦੇ ਸਭ ਤੋਂ ਵਧੀਆ ਪ੍ਰਦਰਸ਼ਨ ਕਰਨ ਵਾਲੇ ਸਟਾਕਾਂ ਅਤੇ ਬਾਂਡਾਂ ਦੁਆਰਾ ਸੰਭਾਵੀ ਤੌਰ 'ਤੇ ਉੱਚ ਰਿਟਰਨ ਦੇਣ ਦੀ ਆਗਿਆ ਦਿੰਦਾ ਹੈ।
4. ਫੰਡਾਂ ਦਾ ਮਲਟੀ-ਮੈਨੇਜਰ ਫੰਡ
ਇਹ ਫੰਡਾਂ ਦੀ ਸਭ ਤੋਂ ਆਮ ਕਿਸਮ ਹੈ ਮਿਉਚੁਅਲ ਫੰਡ ਵਿੱਚ ਉਪਲਬਧਬਜ਼ਾਰ. ਅਜਿਹੇ ਫੰਡ ਦੇ ਸੰਪੱਤੀ ਅਧਾਰ ਵਿੱਚ ਵੱਖ-ਵੱਖ ਪੇਸ਼ੇਵਰ ਪ੍ਰਬੰਧਿਤ ਮਿਉਚੁਅਲ ਫੰਡ ਸ਼ਾਮਲ ਹੁੰਦੇ ਹਨ, ਜਿਨ੍ਹਾਂ ਸਾਰਿਆਂ ਦੀ ਇੱਕ ਵੱਖਰੀ ਪੋਰਟਫੋਲੀਓ ਇਕਾਗਰਤਾ ਹੁੰਦੀ ਹੈ। ਫੰਡਾਂ ਦੇ ਮਲਟੀ-ਮੈਨੇਜਰ ਫੰਡ ਵਿੱਚ ਆਮ ਤੌਰ 'ਤੇ ਕਈ ਪੋਰਟਫੋਲੀਓ ਮੈਨੇਜਰ ਹੁੰਦੇ ਹਨ, ਹਰ ਇੱਕ ਮਿਉਚੁਅਲ ਫੰਡ ਵਿੱਚ ਮੌਜੂਦ ਇੱਕ ਖਾਸ ਸੰਪਤੀ ਨਾਲ ਕੰਮ ਕਰਦਾ ਹੈ।
Talk to our investment specialist
5. ਫੰਡਾਂ ਦਾ ਈ.ਟੀ.ਐਫ
ਦੇ ਫੰਡ ਸ਼ਾਮਲ ਹਨਐਕਸਚੇਂਜ ਟਰੇਡਡ ਫੰਡ ਉਨ੍ਹਾਂ ਦੇ ਪੋਰਟਫੋਲੀਓ ਵਿੱਚ ਦੇਸ਼ ਵਿੱਚ ਇੱਕ ਪ੍ਰਸਿੱਧ ਨਿਵੇਸ਼ ਸਾਧਨ ਹੈ। ਫੰਡਾਂ ਦੇ ਫੰਡ ਦੁਆਰਾ ਇੱਕ ETF ਵਿੱਚ ਨਿਵੇਸ਼ ਕਰਨਾ ਇਸ ਸਾਧਨ ਵਿੱਚ ਸਿੱਧੇ ਨਿਵੇਸ਼ ਨਾਲੋਂ ਵਧੇਰੇ ਪਹੁੰਚਯੋਗ ਹੈ। ਇਹ ਇਸ ਲਈ ਹੈ ਕਿਉਂਕਿ ETF ਨੂੰ ਡੀਮੈਟ ਦੀ ਲੋੜ ਹੁੰਦੀ ਹੈਵਪਾਰ ਖਾਤਾ ਫੰਡਾਂ ਦੇ ETF ਫੰਡ ਵਿੱਚ ਨਿਵੇਸ਼ ਕਰਦੇ ਸਮੇਂ ਅਜਿਹੀਆਂ ਕੋਈ ਸੀਮਾਵਾਂ ਨਹੀਂ ਹਨ।
ਹਾਲਾਂਕਿ, ETFs ਵਿੱਚ ਥੋੜ੍ਹਾ ਵੱਧ ਜੋਖਮ ਹੁੰਦਾ ਹੈਕਾਰਕ ਉਹਨਾਂ ਨਾਲ ਜੁੜਿਆ ਹੋਇਆ ਹੈ ਕਿਉਂਕਿ ਉਹਨਾਂ ਦਾ ਸਟਾਕ ਮਾਰਕੀਟ ਵਿੱਚ ਸ਼ੇਅਰਾਂ ਵਾਂਗ ਵਪਾਰ ਕੀਤਾ ਜਾਂਦਾ ਹੈ, ਜਿਸ ਨਾਲ ਇਹਨਾਂ ਫੰਡਾਂ ਦੇ ਫੰਡਾਂ ਨੂੰ ਮਾਰਕੀਟ ਦੀ ਅਸਥਿਰਤਾ ਲਈ ਵਧੇਰੇ ਸੰਵੇਦਨਸ਼ੀਲ ਬਣਾਉਂਦੇ ਹਨ।
ਫੰਡਾਂ ਦੇ ਫੰਡ ਵਿੱਚ ਕਿਸ ਨੂੰ ਨਿਵੇਸ਼ ਕਰਨਾ ਚਾਹੀਦਾ ਹੈ?
ਫੰਡਾਂ ਦੇ ਸਿਖਰਲੇ ਫੰਡ ਦਾ ਮੁੱਖ ਉਦੇਸ਼ ਘੱਟ ਤੋਂ ਘੱਟ ਜੋਖਮ ਵਾਲੇ ਵਿਭਿੰਨ ਪੋਰਟਫੋਲੀਓ ਵਿੱਚ ਨਿਵੇਸ਼ ਕਰਕੇ ਰਿਟਰਨ ਨੂੰ ਵੱਧ ਤੋਂ ਵੱਧ ਕਰਨਾ ਹੈ। ਵਿੱਤੀ ਸਰੋਤਾਂ ਦੇ ਇੱਕ ਛੋਟੇ ਜਿਹੇ ਪੂਲ ਤੱਕ ਪਹੁੰਚ ਵਾਲੇ ਵਿਅਕਤੀ, ਜਿਸ ਨੂੰ ਉਹ ਵਧੇਰੇ ਵਿਸਤ੍ਰਿਤ ਸਮੇਂ ਲਈ ਛੱਡ ਸਕਦੇ ਹਨ, ਅਜਿਹੇ ਮਿਉਚੁਅਲ ਫੰਡ ਦੀ ਚੋਣ ਕਰ ਸਕਦੇ ਹਨ। ਕਿਉਂਕਿ ਅਜਿਹੇ ਫੰਡਾਂ ਦੇ ਪੋਰਟਫੋਲੀਓ ਵਿੱਚ ਵੱਖੋ-ਵੱਖਰੇ ਹੁੰਦੇ ਹਨਮਿਉਚੁਅਲ ਫੰਡਾਂ ਦੀਆਂ ਕਿਸਮਾਂ, ਇਹ ਉੱਚ- ਤੱਕ ਪਹੁੰਚ ਨੂੰ ਯਕੀਨੀ ਬਣਾਉਂਦਾ ਹੈਮੁੱਲ ਫੰਡ ਦੇ ਨਾਲ ਨਾਲ.
ਆਦਰਸ਼ਕ ਤੌਰ 'ਤੇ, ਮੁਕਾਬਲਤਨ ਘੱਟ ਸਰੋਤ ਅਤੇ ਘੱਟ ਵਾਲੇ ਨਿਵੇਸ਼ਕਤਰਲਤਾ ਲੋੜਾਂ ਬਾਜ਼ਾਰ ਵਿੱਚ ਉਪਲਬਧ ਫੰਡਾਂ ਦੇ ਚੋਟੀ ਦੇ ਫੰਡ ਵਿੱਚ ਨਿਵੇਸ਼ ਕਰਨ ਦੀ ਚੋਣ ਕਰ ਸਕਦੀਆਂ ਹਨ। ਇਹ ਉਹਨਾਂ ਨੂੰ ਘੱਟੋ-ਘੱਟ ਜੋਖਮ 'ਤੇ ਵੱਧ ਤੋਂ ਵੱਧ ਰਿਟਰਨ ਕਮਾਉਣ ਦੇ ਯੋਗ ਬਣਾਉਂਦਾ ਹੈ।
ਫੰਡ ਦੇ ਫੰਡ ਵਿੱਚ ਨਿਵੇਸ਼ ਕਰਨ ਦੇ ਫਾਇਦੇ
ਵੱਖ-ਵੱਖ ਹਨਨਿਵੇਸ਼ ਦੇ ਲਾਭ ਫੰਡਾਂ ਦੇ ਫੰਡ ਵਿੱਚ ਮਿਉਚੁਅਲ ਫੰਡ -
1. ਵਿਭਿੰਨਤਾ
ਫੰਡ ਦੇ ਫੰਡ ਵੱਖ-ਵੱਖ ਟੀਚੇਵਧੀਆ ਪ੍ਰਦਰਸ਼ਨ ਕਰਨ ਵਾਲੇ ਮਿਉਚੁਅਲ ਫੰਡ ਬਜ਼ਾਰ ਵਿੱਚ, ਹਰੇਕ ਫੰਡ ਦੇ ਇੱਕ ਖਾਸ ਸੰਪੱਤੀ ਜਾਂ ਖੇਤਰ ਵਿੱਚ ਮੁਹਾਰਤ ਰੱਖਦਾ ਹੈ। ਇਹ ਵਿਭਿੰਨਤਾ ਦੁਆਰਾ ਲਾਭਾਂ ਨੂੰ ਯਕੀਨੀ ਬਣਾਉਂਦਾ ਹੈ, ਕਿਉਂਕਿ ਅੰਤਰੀਵ ਪੋਰਟਫੋਲੀਓ ਵਿਭਿੰਨਤਾ ਦੇ ਕਾਰਨ ਰਿਟਰਨ ਅਤੇ ਜੋਖਮ ਦੋਵੇਂ ਅਨੁਕੂਲਿਤ ਹੁੰਦੇ ਹਨ।
2. ਪੇਸ਼ੇਵਰ ਤੌਰ 'ਤੇ ਸਿਖਲਾਈ ਪ੍ਰਾਪਤ ਪ੍ਰਬੰਧਕ
ਫੰਡਾਂ ਦਾ ਫੰਡ ਸਾਲਾਂ ਦੇ ਤਜ਼ਰਬੇ ਵਾਲੇ ਉੱਚ ਸਿਖਲਾਈ ਪ੍ਰਾਪਤ ਲੋਕਾਂ ਦੁਆਰਾ ਪ੍ਰਬੰਧਿਤ ਕੀਤਾ ਜਾਂਦਾ ਹੈ। ਅਜਿਹੇ ਪੋਰਟਫੋਲੀਓ ਪ੍ਰਬੰਧਕਾਂ ਦੁਆਰਾ ਕੀਤੇ ਸਹੀ ਵਿਸ਼ਲੇਸ਼ਣ ਅਤੇ ਗਣਨਾ ਕੀਤੀ ਮਾਰਕੀਟ ਭਵਿੱਖਬਾਣੀਆਂ ਗੁੰਝਲਦਾਰ ਨਿਵੇਸ਼ ਰਣਨੀਤੀਆਂ ਦੁਆਰਾ ਉੱਚ ਉਪਜ ਨੂੰ ਯਕੀਨੀ ਬਣਾਉਂਦੀਆਂ ਹਨ।
3. ਘੱਟ ਸਰੋਤ ਲੋੜਾਂ
ਸੀਮਤ ਵਿੱਤੀ ਸਰੋਤਾਂ ਵਾਲਾ ਵਿਅਕਤੀ ਉੱਚ ਮੁਨਾਫ਼ਾ ਕਮਾਉਣ ਲਈ ਉਪਲਬਧ ਫੰਡਾਂ ਦੇ ਸਿਖਰ ਫੰਡ ਵਿੱਚ ਆਸਾਨੀ ਨਾਲ ਨਿਵੇਸ਼ ਕਰ ਸਕਦਾ ਹੈ। ਨਿਵੇਸ਼ ਕਰਨ ਲਈ ਫੰਡਾਂ ਦੇ ਫੰਡ ਦੀ ਚੋਣ ਕਰਦੇ ਸਮੇਂ ਮਹੀਨਾਵਾਰ ਨਿਵੇਸ਼ ਯੋਜਨਾਵਾਂ ਦਾ ਵੀ ਲਾਭ ਲਿਆ ਜਾ ਸਕਦਾ ਹੈ।
ਫੰਡਾਂ ਦੇ ਫੰਡਾਂ ਦੀਆਂ ਸੀਮਾਵਾਂ
1. ਖਰਚ ਅਨੁਪਾਤ
ਫੰਡਾਂ ਦੇ ਫੰਡ ਦਾ ਪ੍ਰਬੰਧਨ ਕਰਨ ਲਈ ਖਰਚ ਅਨੁਪਾਤ ਮਿਉਚੁਅਲ ਫੰਡ ਸਟੈਂਡਰਡ ਮਿਉਚੁਅਲ ਫੰਡਾਂ ਨਾਲੋਂ ਵੱਧ ਹੁੰਦੇ ਹਨ, ਕਿਉਂਕਿ ਇਸਦਾ ਪ੍ਰਬੰਧਨ ਖਰਚਾ ਵੱਧ ਹੁੰਦਾ ਹੈ। ਜੋੜੇ ਗਏ ਖਰਚਿਆਂ ਵਿੱਚ ਮੁੱਖ ਤੌਰ 'ਤੇ ਨਿਵੇਸ਼ ਕਰਨ ਲਈ ਸਹੀ ਸੰਪਤੀ ਦੀ ਚੋਣ ਕਰਨਾ ਸ਼ਾਮਲ ਹੈ, ਜੋ ਸਮੇਂ-ਸਮੇਂ 'ਤੇ ਉਤਰਾਅ-ਚੜ੍ਹਾਅ ਕਰਦਾ ਰਹਿੰਦਾ ਹੈ।
2. ਟੈਕਸ
ਫੰਡਾਂ ਦੇ ਫੰਡ 'ਤੇ ਲਗਾਇਆ ਗਿਆ ਟੈਕਸ ਇੱਕ ਨਿਵੇਸ਼ਕ ਦੁਆਰਾ ਭੁਗਤਾਨ ਯੋਗ ਹੁੰਦਾ ਹੈ, ਸਿਰਫ ਦੌਰਾਨਛੁਟਕਾਰਾ ਮੂਲ ਰਕਮ ਦਾ। ਹਾਲਾਂਕਿ, ਰਿਕਵਰੀ ਦੇ ਦੌਰਾਨ, ਥੋੜ੍ਹੇ ਸਮੇਂ ਅਤੇ ਲੰਬੇ ਸਮੇਂ ਲਈਪੂੰਜੀ ਸਾਲਾਨਾ 'ਤੇ ਨਿਰਭਰ ਕਰਦੇ ਹੋਏ, ਲਾਭ ਟੈਕਸ ਕਟੌਤੀਆਂ ਦੇ ਅਧੀਨ ਹੁੰਦੇ ਹਨਆਮਦਨ ਨਿਵੇਸ਼ਕ ਅਤੇ ਨਿਵੇਸ਼ ਦੀ ਸਮਾਂ ਮਿਆਦ।
ਨਿਵੇਸ਼ ਕਰਨ ਲਈ ਫੰਡਾਂ ਦਾ ਸਰਵੋਤਮ ਪ੍ਰਦਰਸ਼ਨ ਫੰਡ 2022
Fund NAV Net Assets (Cr) 3 MO (%) 6 MO (%) 1 YR (%) 3 YR (%) 5 YR (%) 2025 (%) PGIM India Euro Equity Fund Growth ₹20.87
↓ -0.19 ₹1,415 -1.7 -8.3 18.9 22.2 1.3 18.3 IDBI Nifty Index Fund Growth ₹36.2111
↓ -0.02 ₹208 9.1 11.9 16.2 20.3 11.7 Bandhan All Seasons Bond Fund Growth ₹46.8846
↑ 0.01 ₹1,865 0.9 2.6 5.3 7 5.9 7.1 ICICI Prudential Advisor Series - Hybrid Fund Growth ₹66.8046
↓ -0.03 ₹3,294 0.3 2.2 5 8.7 8.8 6.6 HDFC Dynamic PE Ratio Fund of Funds Growth ₹41.3728
↓ 0.00 ₹2,647 0.5 2.2 4.5 8.1 9.3 1.3 ICICI Prudential Advisor Series - Debt Management Fund Growth ₹47.4808
↓ -0.09 ₹106 -0.4 1.6 3.5 6.7 6 7.6 PGIM India Global Agribusiness Offshore Fund Growth ₹46.73
↑ 0.26 ₹1,677 -7.6 -2.6 0.2 15.1 3.3 7.9 Note: Returns up to 1 year are on absolute basis & more than 1 year are on CAGR basis. as on 19 Oct 26 Research Highlights & Commentary of 7 Funds showcased
Commentary PGIM India Euro Equity Fund IDBI Nifty Index Fund Bandhan All Seasons Bond Fund ICICI Prudential Advisor Series - Hybrid Fund HDFC Dynamic PE Ratio Fund of Funds ICICI Prudential Advisor Series - Debt Management Fund PGIM India Global Agribusiness Offshore Fund Point 1 Lower mid AUM (₹1,415 Cr). Bottom quartile AUM (₹208 Cr). Upper mid AUM (₹1,865 Cr). Highest AUM (₹3,294 Cr). Upper mid AUM (₹2,647 Cr). Bottom quartile AUM (₹106 Cr). Lower mid AUM (₹1,677 Cr). Point 2 Established history (19+ yrs). Established history (16+ yrs). Oldest track record among peers (22 yrs). Established history (22+ yrs). Established history (14+ yrs). Established history (22+ yrs). Established history (16+ yrs). Point 3 Rating: 2★ (lower mid). Rating: 1★ (bottom quartile). Rating: 3★ (upper mid). Rating: 3★ (upper mid). Rating: 3★ (lower mid). Top rated. Rating: 1★ (bottom quartile). Point 4 Risk profile: High. Risk profile: Moderately High. Risk profile: Moderately Low. Risk profile: Moderately High. Risk profile: Moderately High. Risk profile: Moderate. Risk profile: High. Point 5 5Y return: 1.25% (bottom quartile). 5Y return: 11.74% (top quartile). 5Y return: 5.93% (lower mid). 5Y return: 8.78% (upper mid). 5Y return: 9.28% (upper mid). 5Y return: 6.01% (lower mid). 5Y return: 3.35% (bottom quartile). Point 6 3Y return: 22.22% (top quartile). 3Y return: 20.28% (upper mid). 3Y return: 7.01% (bottom quartile). 3Y return: 8.66% (lower mid). 3Y return: 8.11% (lower mid). 3Y return: 6.72% (bottom quartile). 3Y return: 15.12% (upper mid). Point 7 1Y return: 18.92% (top quartile). 1Y return: 16.16% (upper mid). 1Y return: 5.27% (upper mid). 1Y return: 4.96% (lower mid). 1Y return: 4.49% (lower mid). 1Y return: 3.49% (bottom quartile). 1Y return: 0.17% (bottom quartile). Point 8 1M return: -9.38% (bottom quartile). 1M return: 3.68% (top quartile). 1M return: 0.17% (upper mid). 1M return: -0.34% (lower mid). 1M return: -0.04% (upper mid). 1M return: -0.85% (lower mid). 1M return: -2.99% (bottom quartile). Point 9 Alpha: -16.90 (bottom quartile). Alpha: -1.03 (lower mid). Alpha: 0.00 (top quartile). Alpha: 0.00 (upper mid). Alpha: 0.00 (upper mid). Alpha: 0.00 (lower mid). Alpha: -24.04 (bottom quartile). Point 10 Sharpe: 0.71 (upper mid). Sharpe: 1.04 (top quartile). Sharpe: 0.10 (lower mid). Sharpe: 0.22 (upper mid). Sharpe: -0.25 (bottom quartile). Sharpe: -0.24 (bottom quartile). Sharpe: 0.03 (lower mid). PGIM India Euro Equity Fund
IDBI Nifty Index Fund
Bandhan All Seasons Bond Fund
ICICI Prudential Advisor Series - Hybrid Fund
HDFC Dynamic PE Ratio Fund of Funds
ICICI Prudential Advisor Series - Debt Management Fund
PGIM India Global Agribusiness Offshore Fund
ਸੰਪਤੀ >= 50 ਕਰੋੜ 'ਤੇ ਆਧਾਰਿਤ ਛਾਂਟੀ ਕੀਤੀ ਗਈ ਹੈ1 ਸਾਲ ਦੀ ਵਾਪਸੀ.
(Erstwhile DHFL Pramerica Top Euroland Offshore Fund) The primary investment objective of the scheme is to generate long-term capital growth from a diversified portfolio of units of overseas mutual funds. Below is the key information for PGIM India Euro Equity Fund Returns up to 1 year are on The investment objective of the scheme is to invest in the stocks and equity related instruments comprising the S&P CNX Nifty Index in the same weights as these stocks represented in the Index with the intent to replicate the performance of the Total Returns Index of S&P CNX Nifty index. The scheme will adopt a passive investment strategy and will seek to achieve the investment objective by minimizing the tracking error between the S&P CNX Nifty index (Total Returns Index) and the scheme. Research Highlights for IDBI Nifty Index Fund Below is the key information for IDBI Nifty Index Fund Returns up to 1 year are on Seek to generate optimal returns with high liquidity by active management of
the portfolio by investing predominantly in debt oriented mutual fund schemes and money market instruments. However, there can be no assurance that the investment objectives of the Scheme will be realized. Research Highlights for Bandhan All Seasons Bond Fund Below is the key information for Bandhan All Seasons Bond Fund Returns up to 1 year are on (Erstwhile ICICI Prudential Advisor Series - Cautious Plan) The primary investment objective of this Plan is to seek to generate regular income primarily through investments in the schemes of domestic or offshore Mutual Fund(s) having asset allocation: • Primarily to fixed income securities • To a lesser extent (maximum 35%) in equity and equity related securities so as to generate long-term capital appreciation. However, there can be no assurance that the investment objectives of the Plan/s will be realized. Research Highlights for ICICI Prudential Advisor Series - Hybrid Fund Below is the key information for ICICI Prudential Advisor Series - Hybrid Fund Returns up to 1 year are on The Scheme seeks to generate regular income through investments in debt & money market instruments, along with capital appreciation through limited exposure to equity and equity related instruments. Research Highlights for HDFC Dynamic PE Ratio Fund of Funds Below is the key information for HDFC Dynamic PE Ratio Fund of Funds Returns up to 1 year are on (Erstwhile ICICI Prudential Advisor Series - Dynamic Accrual Plan) The primary investment objective of this Plan is to seek to provide reasonable returns, commensurate with low risk while providing a high level of liquidity, through investments made primarily in the schemes of domestic or offshore Mutual Fund(s) having asset allocation to: • Money market and debt securities. This Plan may be considered to be ideal for investors having a low risk appetite and a shorter duration of investment. However, there can be no assurance that the investment objectives of the Plan/s will be realized. Research Highlights for ICICI Prudential Advisor Series - Debt Management Fund Below is the key information for ICICI Prudential Advisor Series - Debt Management Fund Returns up to 1 year are on The primary investment objective of the scheme is to generate long-term capital growth by investing predominantly in units of overseas mutual funds, focusing on
agriculture and/or would be direct and indirect beneficiaries of the anticipated growth in the agriculture and/or affiliated/allied sectors. Research Highlights for PGIM India Global Agribusiness Offshore Fund Below is the key information for PGIM India Global Agribusiness Offshore Fund Returns up to 1 year are on 1. PGIM India Euro Equity Fund
PGIM India Euro Equity Fund
Growth Launch Date 11 Sep 07 NAV (19 Oct 26) ₹20.87 ↓ -0.19 (-0.90 %) Net Assets (Cr) ₹1,415 on 30 Sep 26 Category Others - Fund of Fund AMC Pramerica Asset Managers Private Limited Rating ☆☆ Risk High Expense Ratio 1.68 Sharpe Ratio 0.71 Information Ratio -0.43 Alpha Ratio -16.9 Min Investment 5,000 Min SIP Investment 1,000 Exit Load 0-12 Months (1%),12 Months and above(NIL) Growth of 10,000 investment over the years.
Date Value 30 Sep 21 ₹10,000 30 Sep 22 ₹6,031 30 Sep 23 ₹6,121 30 Sep 24 ₹8,039 30 Sep 25 ₹9,649 30 Sep 26 ₹12,168 Returns for PGIM India Euro Equity Fund
absolute basis & more than 1 year are on CAGR (Compound Annual Growth Rate) basis. as on 19 Oct 26 Duration Returns 1 Month -9.4% 3 Month -1.7% 6 Month -8.3% 1 Year 18.9% 3 Year 22.2% 5 Year 1.3% 10 Year 15 Year Since launch 3.9% Historical performance (Yearly) on absolute basis
Year Returns 2025 18.3% 2024 20.6% 2023 14.6% 2022 -35.6% 2021 -1.9% 2020 20.5% 2019 21.4% 2018 -10.3% 2017 14.6% 2016 -6.7% Fund Manager information for PGIM India Euro Equity Fund
Name Since Tenure Anandha Padmanabhan Anjeneyan 15 Feb 25 1.54 Yr. Vivek Sharma 15 Feb 25 1.54 Yr. Data below for PGIM India Euro Equity Fund as on 30 Sep 26
Asset Allocation
Asset Class Value Cash 10.01% Equity 89.99% Top Securities Holdings / Portfolio
Name Holding Value Quantity PGIM Jennison Emerging Mkts Eq USD W Acc
Investment Fund | -96% ₹1,362 Cr 982,813 Clearing Corporation Of India Ltd.
CBLO/Reverse Repo | -4% ₹51 Cr Net Receivables / (Payables)
Net Current Assets | -0% ₹1 Cr 2. IDBI Nifty Index Fund
IDBI Nifty Index Fund
Growth Launch Date 25 Jun 10 NAV (28 Jul 23) ₹36.2111 ↓ -0.02 (-0.06 %) Net Assets (Cr) ₹208 on 30 Jun 23 Category Others - Index Fund AMC IDBI Asset Management Limited Rating ☆ Risk Moderately High Expense Ratio 0.9 Sharpe Ratio 1.04 Information Ratio -3.93 Alpha Ratio -1.03 Min Investment 5,000 Min SIP Investment 500 Exit Load NIL Growth of 10,000 investment over the years.
Date Value Returns for IDBI Nifty Index Fund
absolute basis & more than 1 year are on CAGR (Compound Annual Growth Rate) basis. as on 19 Oct 26 Duration Returns 1 Month 3.7% 3 Month 9.1% 6 Month 11.9% 1 Year 16.2% 3 Year 20.3% 5 Year 11.7% 10 Year 15 Year Since launch 10.3% Historical performance (Yearly) on absolute basis
Year Returns 2025 2024 2023 2022 2021 2020 2019 2018 2017 2016 Fund Manager information for IDBI Nifty Index Fund
Name Since Tenure Data below for IDBI Nifty Index Fund as on 30 Jun 23
Asset Allocation
Asset Class Value Top Securities Holdings / Portfolio
Name Holding Value Quantity 3. Bandhan All Seasons Bond Fund
Bandhan All Seasons Bond Fund
Growth Launch Date 13 Sep 04 NAV (21 Oct 26) ₹46.8846 ↑ 0.01 (0.02 %) Net Assets (Cr) ₹1,865 on 30 Sep 26 Category Others - Fund of Fund AMC IDFC Asset Management Company Limited Rating ☆☆☆ Risk Moderately Low Expense Ratio 0.29 Sharpe Ratio 0.1 Information Ratio 0 Alpha Ratio 0 Min Investment 5,000 Min SIP Investment 1,000 Exit Load 0-3 Months (0.5%),3 Months and above(NIL) Growth of 10,000 investment over the years.
Date Value 30 Sep 21 ₹10,000 30 Sep 22 ₹10,226 30 Sep 23 ₹10,888 30 Sep 24 ₹11,771 30 Sep 25 ₹12,619 30 Sep 26 ₹13,338 Returns for Bandhan All Seasons Bond Fund
absolute basis & more than 1 year are on CAGR (Compound Annual Growth Rate) basis. as on 19 Oct 26 Duration Returns 1 Month 0.2% 3 Month 0.9% 6 Month 2.6% 1 Year 5.3% 3 Year 7% 5 Year 5.9% 10 Year 15 Year Since launch 7.2% Historical performance (Yearly) on absolute basis
Year Returns 2025 7.1% 2024 7.8% 2023 6.8% 2022 3.2% 2021 3.3% 2020 10.5% 2019 10.4% 2018 6.3% 2017 5.9% 2016 8.9% Fund Manager information for Bandhan All Seasons Bond Fund
Name Since Tenure Harshal Joshi 15 Jul 16 10.14 Yr. Data below for Bandhan All Seasons Bond Fund as on 30 Sep 26
Asset Allocation
Asset Class Value Cash 50.45% Debt 49.46% Other 0.09% Top Securities Holdings / Portfolio
Name Holding Value Quantity Bandhan Corporate Bond Dir Gr
Investment Fund | -58% ₹1,048 Cr 495,308,536
↑ 7,930,136 Bandhan Arbitrage Dir Gr
Investment Fund | -42% ₹751 Cr 198,911,352
↑ 2,970,790 Triparty Repo Trp_010926
CBLO/Reverse Repo | -0% ₹8 Cr Net Current Assets
Net Current Assets | -0% -₹2 Cr Cash Margin - Ccil
CBLO/Reverse Repo | -0% ₹0 Cr 4. ICICI Prudential Advisor Series - Hybrid Fund
ICICI Prudential Advisor Series - Hybrid Fund
Growth Launch Date 18 Dec 03 NAV (21 Oct 26) ₹66.8046 ↓ -0.03 (-0.05 %) Net Assets (Cr) ₹3,294 on 30 Sep 26 Category Others - Fund of Fund AMC ICICI Prudential Asset Management Company Limited Rating ☆☆☆ Risk Moderately High Expense Ratio 0.25 Sharpe Ratio 0.22 Information Ratio 0 Alpha Ratio 0 Min Investment 5,000 Min SIP Investment 1,000 Exit Load 0-1 Months (0.25%),1 Months and above(NIL) Growth of 10,000 investment over the years.
Date Value 30 Sep 21 ₹10,000 30 Sep 22 ₹10,390 30 Sep 23 ₹11,943 30 Sep 24 ₹13,801 30 Sep 25 ₹14,470 30 Sep 26 ₹15,319 Returns for ICICI Prudential Advisor Series - Hybrid Fund
absolute basis & more than 1 year are on CAGR (Compound Annual Growth Rate) basis. as on 19 Oct 26 Duration Returns 1 Month -0.3% 3 Month 0.3% 6 Month 2.2% 1 Year 5% 3 Year 8.7% 5 Year 8.8% 10 Year 15 Year Since launch 8.7% Historical performance (Yearly) on absolute basis
Year Returns 2025 6.6% 2024 12.3% 2023 14.4% 2022 6.7% 2021 10.8% 2020 9.2% 2019 8.6% 2018 6.4% 2017 5.8% 2016 9.6% Fund Manager information for ICICI Prudential Advisor Series - Hybrid Fund
Name Since Tenure Manish Banthia 16 Jun 17 9.22 Yr. Ritesh Lunawat 29 Dec 20 5.68 Yr. Data below for ICICI Prudential Advisor Series - Hybrid Fund as on 30 Sep 26
Asset Allocation
Asset Class Value Cash 49.65% Debt 50.3% Other 0.16% Top Securities Holdings / Portfolio
Name Holding Value Quantity ICICI Prudential Arbitrage Dir Gr
Investment Fund | -37% ₹1,209 Cr 305,547,819
↑ 3,795,616 ICICI Pru Corporate Bond Dir Gr
Investment Fund | -31% ₹1,023 Cr 305,392,121 ICICI Pru Floating Interest Dir Gr
Investment Fund | -12% ₹400 Cr 7,982,320
↑ 4,487,729 ICICI Pru Nifty PSU B Pl SDL Dir Gr
Investment Fund | -10% ₹327 Cr 244,319,061
↑ 7,504,372 ICICI Pru Gilt Dir Gr
Investment Fund | -7% ₹225 Cr 19,223,545
↓ -16,981,273 Treps
CBLO/Reverse Repo | -3% ₹96 Cr Net Current Assets
Net Current Assets | -0% -₹2 Cr 5. HDFC Dynamic PE Ratio Fund of Funds
HDFC Dynamic PE Ratio Fund of Funds
Growth Launch Date 6 Feb 12 NAV (21 Oct 26) ₹41.3728 ↓ 0.00 (-0.01 %) Net Assets (Cr) ₹2,647 on 30 Sep 26 Category Others - Fund of Fund AMC HDFC Asset Management Company Limited Rating ☆☆☆ Risk Moderately High Expense Ratio 0.38 Sharpe Ratio -0.25 Information Ratio 0 Alpha Ratio 0 Min Investment 5,000 Min SIP Investment 300 Exit Load 0-1 Years (1%),1 Years and above(NIL) Growth of 10,000 investment over the years.
Date Value 30 Sep 21 ₹10,000 30 Sep 22 ₹10,413 30 Sep 23 ₹12,476 30 Sep 24 ₹15,250 30 Sep 25 ₹14,979 30 Sep 26 ₹15,751 Returns for HDFC Dynamic PE Ratio Fund of Funds
absolute basis & more than 1 year are on CAGR (Compound Annual Growth Rate) basis. as on 19 Oct 26 Duration Returns 1 Month 0% 3 Month 0.5% 6 Month 2.2% 1 Year 4.5% 3 Year 8.1% 5 Year 9.3% 10 Year 15 Year Since launch 10.1% Historical performance (Yearly) on absolute basis
Year Returns 2025 1.3% 2024 12.9% 2023 22.8% 2022 7.3% 2021 21.6% 2020 14.4% 2019 6% 2018 -2.3% 2017 23.6% 2016 9% Fund Manager information for HDFC Dynamic PE Ratio Fund of Funds
Name Since Tenure Anil Bamboli 27 Jun 14 12.27 Yr. Data below for HDFC Dynamic PE Ratio Fund of Funds as on 30 Sep 26
Asset Allocation
Asset Class Value Cash 49.17% Debt 50.73% Other 0.22% Top Securities Holdings / Portfolio
Name Holding Value Quantity HDFC Corporate Bond Dir Gr
Investment Fund | -45% ₹1,182 Cr 336,154,858 HDFC Arbitrage Direct Growth
Investment Fund | -37% ₹969 Cr 445,629,422 HDFC Money Market Dir Gr
Investment Fund | -17% ₹447 Cr 709,144 Treps - Tri-Party Repo
CBLO/Reverse Repo | -1% ₹34 Cr Net Current Assets
Net Current Assets | -0% -₹6 Cr 6. ICICI Prudential Advisor Series - Debt Management Fund
ICICI Prudential Advisor Series - Debt Management Fund
Growth Launch Date 18 Dec 03 NAV (21 Oct 26) ₹47.4808 ↓ -0.09 (-0.18 %) Net Assets (Cr) ₹106 on 30 Sep 26 Category Others - Fund of Fund AMC ICICI Prudential Asset Management Company Limited Rating ☆☆☆☆ Risk Moderate Expense Ratio 0.62 Sharpe Ratio -0.25 Information Ratio 0 Alpha Ratio 0 Min Investment 5,000 Min SIP Investment 100 Exit Load 0-6 Months (0.5%),6 Months and above(NIL) Growth of 10,000 investment over the years.
Date Value 30 Sep 21 ₹10,000 30 Sep 22 ₹10,296 30 Sep 23 ₹11,023 30 Sep 24 ₹11,939 30 Sep 25 ₹12,865 30 Sep 26 ₹13,495 Returns for ICICI Prudential Advisor Series - Debt Management Fund
absolute basis & more than 1 year are on CAGR (Compound Annual Growth Rate) basis. as on 19 Oct 26 Duration Returns 1 Month -0.8% 3 Month -0.4% 6 Month 1.6% 1 Year 3.5% 3 Year 6.7% 5 Year 6% 10 Year 15 Year Since launch 7.1% Historical performance (Yearly) on absolute basis
Year Returns 2025 7.6% 2024 8.1% 2023 7.5% 2022 4% 2021 4.2% 2020 9.7% 2019 8.7% 2018 6.2% 2017 6.5% 2016 11.2% Fund Manager information for ICICI Prudential Advisor Series - Debt Management Fund
Name Since Tenure Manish Banthia 16 Jun 17 9.21 Yr. Ritesh Lunawat 29 Dec 20 5.67 Yr. Data below for ICICI Prudential Advisor Series - Debt Management Fund as on 30 Sep 26
Asset Allocation
Asset Class Value Cash 11.3% Equity 1.1% Debt 87.29% Other 0.3% Top Securities Holdings / Portfolio
Name Holding Value Quantity ICICI Pru All Seasons Bond Dir Gr
Investment Fund | -41% ₹43 Cr 10,182,323 ICICI Pru Short Term Dir Gr
Investment Fund | -33% ₹35 Cr 4,897,478 ICICI Pru Medium Term Dir Gr
Investment Fund | -12% ₹12 Cr 2,308,862 ICICI Pru Gilt Dir Gr
Investment Fund | -8% ₹8 Cr 686,142
↓ -508,813 ICICI Pru Floating Interest Dir Gr
Investment Fund | -6% ₹6 Cr 119,650
↑ 119,650 Treps
CBLO/Reverse Repo | -1% ₹1 Cr Net Current Assets
Net Current Assets | -0% ₹0 Cr 7. PGIM India Global Agribusiness Offshore Fund
PGIM India Global Agribusiness Offshore Fund
Growth Launch Date 14 May 10 NAV (19 Oct 26) ₹46.73 ↑ 0.26 (0.56 %) Net Assets (Cr) ₹1,677 on 30 Sep 26 Category Others - Fund of Fund AMC Pramerica Asset Managers Private Limited Rating ☆ Risk High Expense Ratio 1.57 Sharpe Ratio 0.03 Information Ratio -0.75 Alpha Ratio -24.04 Min Investment 5,000 Min SIP Investment 1,000 Exit Load 0-12 Months (1%),12 Months and above(NIL) Growth of 10,000 investment over the years.
Date Value 30 Sep 21 ₹10,000 30 Sep 22 ₹6,591 30 Sep 23 ₹8,306 30 Sep 24 ₹11,604 30 Sep 25 ₹13,059 30 Sep 26 ₹13,551 Returns for PGIM India Global Agribusiness Offshore Fund
absolute basis & more than 1 year are on CAGR (Compound Annual Growth Rate) basis. as on 19 Oct 26 Duration Returns 1 Month -3% 3 Month -7.6% 6 Month -2.6% 1 Year 0.2% 3 Year 15.1% 5 Year 3.3% 10 Year 15 Year Since launch 9.8% Historical performance (Yearly) on absolute basis
Year Returns 2025 7.9% 2024 24% 2023 39.5% 2022 -33.8% 2021 7% 2020 72.4% 2019 30.9% 2018 0.3% 2017 11.9% 2016 0.8% Fund Manager information for PGIM India Global Agribusiness Offshore Fund
Name Since Tenure Anandha Padmanabhan Anjeneyan 15 Feb 25 1.54 Yr. Vivek Sharma 15 Feb 25 1.54 Yr. Data below for PGIM India Global Agribusiness Offshore Fund as on 30 Sep 26
Asset Allocation
Asset Class Value Cash 6.79% Equity 93.21% Top Securities Holdings / Portfolio
Name Holding Value Quantity PGIM Jennison Global Eq Opps USD I Acc
Investment Fund | -96% ₹1,585 Cr 511,394 Clearing Corporation Of India Ltd.
CBLO/Reverse Repo | -4% ₹62 Cr Net Receivables / (Payables)
Net Current Assets | -0% -₹3 Cr
ਫੰਡ ਦੇ ਫੰਡ ਦੇ ਫਾਇਦੇ
ਹਰੇਕ ਮਿਉਚੁਅਲ ਫੰਡ ਦੀ ਤਰ੍ਹਾਂ, ਫੰਡਾਂ ਦੇ ਫੰਡ ਦੇ ਵੀ ਕਈ ਫਾਇਦੇ ਹਨ। ਉਹਨਾਂ ਵਿੱਚੋਂ ਕੁਝ ਹਨ:
1. ਪੋਰਟਫੋਲੀਓ ਵਿਭਿੰਨਤਾ ਅਤੇ ਫੰਡ ਵੰਡ
ਮੁੱਖ ਪ੍ਰਾਇਮਰੀ ਲਾਭਾਂ ਵਿੱਚੋਂ ਇੱਕ ਪੋਰਟਫੋਲੀਓ ਵਿਭਿੰਨਤਾ ਹੈ। ਇੱਥੇ, ਇੱਕ ਸਿੰਗਲ ਫੰਡ ਵਿੱਚ ਨਿਵੇਸ਼ ਕਰਨ ਦੇ ਬਾਵਜੂਦ, ਨਿਵੇਸ਼ ਕਈ ਮਿਉਚੁਅਲ ਫੰਡ ਸਕੀਮਾਂ ਵਿੱਚ ਕੀਤਾ ਜਾਂਦਾ ਹੈ, ਜਿੱਥੇ ਫੰਡ ਨੂੰ ਦਿੱਤੇ ਗਏ ਜੋਖਮ ਦੇ ਪੱਧਰ 'ਤੇ ਵੱਧ ਤੋਂ ਵੱਧ ਰਿਟਰਨ ਕਮਾਉਣ ਦੇ ਉਦੇਸ਼ ਨਾਲ ਇੱਕ ਅਨੁਕੂਲ ਤਰੀਕੇ ਨਾਲ ਵੰਡਿਆ ਜਾਂਦਾ ਹੈ।
2. ਵਿਵਿਧ ਸੰਪਤੀਆਂ ਲਈ ਗੇਟਵੇ
ਬਹੁ-ਪ੍ਰਬੰਧਨ ਨਿਵੇਸ਼ ਰਿਟੇਲ ਨਿਵੇਸ਼ਕਾਂ ਨੂੰ ਫੰਡਾਂ ਤੱਕ ਪਹੁੰਚ ਪ੍ਰਾਪਤ ਕਰਨ ਵਿੱਚ ਮਦਦ ਕਰਦਾ ਹੈ ਜੋ ਨਿਵੇਸ਼ਾਂ ਲਈ ਆਸਾਨੀ ਨਾਲ ਉਪਲਬਧ ਨਹੀਂ ਹਨ। ਫੰਡ ਦਾ ਇੱਕ ਸਿੰਗਲ ਫੰਡ ਬਦਲੇ ਵਿੱਚ ਐਕਸਪੋਜ਼ਰ ਲੈ ਸਕਦਾ ਹੈਇਕੁਇਟੀ ਫੰਡ,ਕਰਜ਼ਾ ਫੰਡ ਜਾਂ ਇੱਥੋਂ ਤੱਕ ਕਿ ਵਸਤੂ ਅਧਾਰਤ ਮਿਉਚੁਅਲ ਫੰਡ। ਇਹ ਕੇਵਲ ਇੱਕ ਮਿਉਚੁਅਲ ਫੰਡ ਵਿੱਚ ਆਉਣ ਦੁਆਰਾ ਪ੍ਰਚੂਨ ਨਿਵੇਸ਼ਕ ਲਈ ਵਿਭਿੰਨਤਾ ਨੂੰ ਯਕੀਨੀ ਬਣਾਉਂਦਾ ਹੈ।
3. ਉਚਿਤ ਮਿਹਨਤ ਪ੍ਰਕਿਰਿਆ
ਇਸ ਸ਼੍ਰੇਣੀ ਦੇ ਅਧੀਨ ਸਾਰੇ ਫੰਡਾਂ ਤੋਂ ਉਮੀਦ ਕੀਤੀ ਜਾਂਦੀ ਹੈ ਕਿ ਉਹ ਫੰਡ ਮੈਨੇਜਰ ਦੁਆਰਾ ਕੀਤੀ ਗਈ ਇੱਕ ਉਚਿਤ ਮਿਹਨਤ ਪ੍ਰਕਿਰਿਆ ਦਾ ਪਾਲਣ ਕਰਨ ਜਿੱਥੇ ਉਹਨਾਂ ਨੂੰ ਇਹ ਯਕੀਨੀ ਬਣਾਉਣ ਲਈ ਕਿ ਰਣਨੀਤੀ ਉਮੀਦਾਂ ਦੇ ਅਨੁਸਾਰ ਹੈ, ਨਿਵੇਸ਼ ਕਰਨ ਤੋਂ ਪਹਿਲਾਂ ਅੰਡਰਲਾਈੰਗ ਫੰਡ ਪ੍ਰਬੰਧਕਾਂ ਦੇ ਪਿਛੋਕੜ ਅਤੇ ਪ੍ਰਮਾਣ ਪੱਤਰਾਂ ਦੀ ਜਾਂਚ ਕਰਨ ਦੀ ਲੋੜ ਹੁੰਦੀ ਹੈ।
4. ਘੱਟ ਨਿਵੇਸ਼ ਦੀ ਰਕਮ
ਇਹ ਰਿਟੇਲ ਨਿਵੇਸ਼ਕਾਂ ਲਈ ਇੱਕ ਚੰਗਾ ਵਿਕਲਪ ਹੈ ਜੋ ਘੱਟ ਟਿਕਟ ਦੇ ਆਕਾਰ ਦੇ ਨਾਲ ਇਸ ਨਿਵੇਸ਼ ਐਵੇਨਿਊ ਵਿੱਚ ਉੱਦਮ ਕਰਨਾ ਚਾਹੁੰਦੇ ਹਨ।
ਫੰਡ ਦਾ ਫੰਡ ਕਿਵੇਂ ਕੰਮ ਕਰਦਾ ਹੈ?
ਬਹੁ-ਪ੍ਰਬੰਧਕ ਨਿਵੇਸ਼ ਦੇ ਕਾਰਜਾਂ ਦੀ ਰੂਪ-ਰੇਖਾ ਨੂੰ ਸਮਝਣ ਲਈ, ਬੇੜੀਆਂ ਅਤੇ ਬੇਰੋਕ ਪ੍ਰਬੰਧਨ ਦੀਆਂ ਧਾਰਨਾਵਾਂ ਨੂੰ ਸਮਝਣਾ ਮਹੱਤਵਪੂਰਨ ਹੈ। ਫੈਟਰਡ ਪ੍ਰਬੰਧਨ ਇੱਕ ਅਜਿਹੀ ਸਥਿਤੀ ਹੈ ਜਦੋਂ ਮਿਉਚੁਅਲ ਫੰਡ ਆਪਣੀ ਕੰਪਨੀ ਦੁਆਰਾ ਪ੍ਰਬੰਧਿਤ ਸੰਪਤੀਆਂ ਅਤੇ ਫੰਡਾਂ ਵਾਲੇ ਪੋਰਟਫੋਲੀਓ ਵਿੱਚ ਆਪਣਾ ਪੈਸਾ ਨਿਵੇਸ਼ ਕਰਦਾ ਹੈ। ਦੂਜੇ ਸ਼ਬਦਾਂ ਵਿੱਚ, ਪੈਸਾ ਉਸੇ ਸੰਪਤੀ ਪ੍ਰਬੰਧਨ ਕੰਪਨੀ ਦੇ ਫੰਡਾਂ ਵਿੱਚ ਨਿਵੇਸ਼ ਕੀਤਾ ਜਾਂਦਾ ਹੈ। ਇਸਦੇ ਉਲਟ, ਨਿਰਵਿਘਨ ਪ੍ਰਬੰਧਨ ਇੱਕ ਅਜਿਹੀ ਸਥਿਤੀ ਹੈ ਜਿੱਥੇ ਮਿਉਚੁਅਲ ਫੰਡ ਦੂਜੇ ਦੁਆਰਾ ਪ੍ਰਬੰਧਿਤ ਬਾਹਰੀ ਫੰਡਾਂ ਵਿੱਚ ਨਿਵੇਸ਼ ਕਰਦਾ ਹੈਸੰਪੱਤੀ ਪ੍ਰਬੰਧਨ ਕੰਪਨੀਆਂ. ਨਿਰਵਿਘਨ ਫੰਡਾਂ ਦਾ ਫਸੇ ਫੰਡਾਂ ਨਾਲੋਂ ਇੱਕ ਫਾਇਦਾ ਹੁੰਦਾ ਹੈ ਕਿਉਂਕਿ ਉਹ ਆਪਣੇ ਆਪ ਨੂੰ ਇੱਕੋ ਪਰਿਵਾਰਕ ਫੰਡਾਂ ਤੱਕ ਸੀਮਤ ਕਰਨ ਦੀ ਬਜਾਏ ਕਈ ਫੰਡਾਂ ਅਤੇ ਹੋਰ ਸਕੀਮਾਂ ਤੋਂ ਮੌਕਿਆਂ ਦਾ ਸ਼ੋਸ਼ਣ ਕਰ ਸਕਦੇ ਹਨ।
ਫੰਡਾਂ ਦਾ ਫੰਡ ਕਿਉਂ ਚੁਣੋ?
ਹੇਠਾਂ ਦਿੱਤੀ ਤਸਵੀਰ ਸਪਸ਼ਟਤਾ ਦਿੰਦੀ ਹੈ ਕਿ ਕਿਵੇਂ ਬਹੁ-ਪ੍ਰਬੰਧਨ ਨਿਵੇਸ਼ ਇੱਕ ਵਿਅਕਤੀ ਨੂੰ ਉਹਨਾਂ ਦੇ ਉਦੇਸ਼ਾਂ ਨੂੰ ਪ੍ਰਾਪਤ ਕਰਨ ਲਈ ਇੱਕ ਸਧਾਰਨ ਮਿਉਚੁਅਲ ਫੰਡ ਦੀ ਬਜਾਏ ਮਦਦ ਕਰ ਸਕਦਾ ਹੈ।
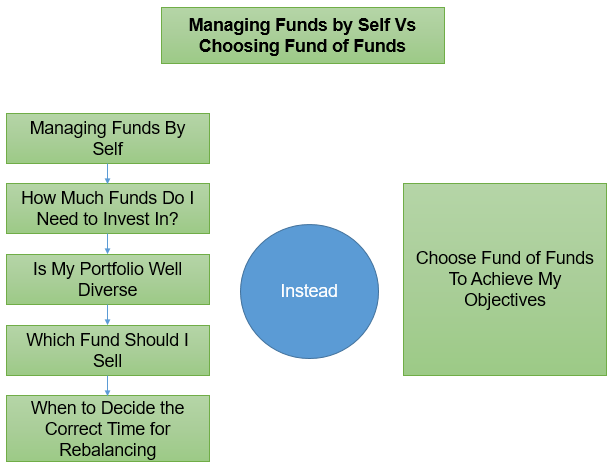
ਹਾਲਾਂਕਿ ਬਹੁ-ਪ੍ਰਬੰਧਨ ਨਿਵੇਸ਼ ਦੇ ਇਸ ਨਾਲ ਜੁੜੇ ਬਹੁਤ ਸਾਰੇ ਲਾਭ ਹਨ, ਇੱਕ ਮਹੱਤਵਪੂਰਣ ਕਾਰਕ ਜਿਸ ਬਾਰੇ ਕਿਸੇ ਨੂੰ ਸੁਚੇਤ ਹੋਣ ਦੀ ਜ਼ਰੂਰਤ ਹੈ ਉਹ ਹੈ ਇਸਦੇ ਨਾਲ ਜੁੜੀ ਫੀਸ। ਨਿਵੇਸ਼ਕਾਂ ਨੂੰ ਕਿਸੇ ਵੀ ਚਾਰਜ ਜਾਂ ਖਰਚਿਆਂ ਬਾਰੇ ਪਤਾ ਹੋਣਾ ਚਾਹੀਦਾ ਹੈ ਜੋ ਇੱਕ ਮਿਉਚੁਅਲ ਫੰਡ ਆਕਰਸ਼ਿਤ ਕਰੇਗਾ ਅਤੇ ਉਸ ਅਨੁਸਾਰ ਆਪਣੇ ਨਿਵੇਸ਼ ਕਰੇਗਾ। ਇਸ ਲਈ, ਸੰਖੇਪ ਰੂਪ ਵਿੱਚ, ਇਹ ਸਿੱਟਾ ਕੱਢਿਆ ਜਾ ਸਕਦਾ ਹੈ ਕਿ ਫੰਡਾਂ ਦਾ ਫੰਡ ਨਿਵੇਸ਼ਕਾਂ ਲਈ ਇੱਕ ਆਦਰਸ਼ ਨਿਵੇਸ਼ ਵਿਕਲਪ ਹੈ ਜੋ ਮਿਉਚੁਅਲ ਫੰਡਾਂ ਵਿੱਚ ਇੱਕ ਮੁਸ਼ਕਲ ਰਹਿਤ ਨਿਵੇਸ਼ ਦਾ ਆਨੰਦ ਲੈਣਾ ਚਾਹੁੰਦੇ ਹਨ।
FOF ਮਿਉਚੁਅਲ ਫੰਡਾਂ ਵਿੱਚ ਔਨਲਾਈਨ ਨਿਵੇਸ਼ ਕਿਵੇਂ ਕਰੀਏ?
Fincash.com 'ਤੇ ਜੀਵਨ ਭਰ ਲਈ ਮੁਫਤ ਨਿਵੇਸ਼ ਖਾਤਾ ਖੋਲ੍ਹੋ।
ਆਪਣੀ ਰਜਿਸਟ੍ਰੇਸ਼ਨ ਅਤੇ ਕੇਵਾਈਸੀ ਪ੍ਰਕਿਰਿਆ ਨੂੰ ਪੂਰਾ ਕਰੋ
ਦਸਤਾਵੇਜ਼ (ਪੈਨ, ਆਧਾਰ, ਆਦਿ) ਅੱਪਲੋਡ ਕਰੋ।ਅਤੇ, ਤੁਸੀਂ ਨਿਵੇਸ਼ ਕਰਨ ਲਈ ਤਿਆਰ ਹੋ!
ਅਕਸਰ ਪੁੱਛੇ ਜਾਂਦੇ ਸਵਾਲ
1. FOFs ਦਾ ਸਭ ਤੋਂ ਮਹੱਤਵਪੂਰਨ ਫਾਇਦਾ ਕੀ ਹੈ?
A: FOFs ਦਾ ਸਭ ਤੋਂ ਮਹੱਤਵਪੂਰਨ ਫਾਇਦਾ ਇਹ ਹੈ ਕਿ ਇਹ ਤੁਹਾਡੇ ਨਿਵੇਸ਼ ਨੂੰ ਵਿਭਿੰਨ ਬਣਾਉਂਦਾ ਹੈ ਅਤੇ ਚੰਗੇ ਰਿਟਰਨ ਨੂੰ ਯਕੀਨੀ ਬਣਾਉਂਦਾ ਹੈ। ਜੇਕਰ ਤੁਸੀਂ ਆਪਣੇ ਨਿਵੇਸ਼ ਪੋਰਟਫੋਲੀਓ ਵਿੱਚ ਵਿਭਿੰਨਤਾ ਲਿਆਉਣ ਦੀ ਯੋਜਨਾ ਬਣਾ ਰਹੇ ਹੋ, ਤਾਂ FOFs ਵਿੱਚ ਨਿਵੇਸ਼ ਕਰਨਾ ਚੰਗਾ ਹੈ। ਇਹ ਤੁਹਾਡੇ ਜੋਖਮ ਨੂੰ ਘਟਾਉਂਦਾ ਹੈ ਅਤੇ ਇਹ ਯਕੀਨੀ ਬਣਾਉਂਦਾ ਹੈ ਕਿ ਤੁਸੀਂ ਆਪਣੇ ਨਿਵੇਸ਼ਾਂ 'ਤੇ ਚੰਗੇ ਰਿਟਰਨ ਦਾ ਆਨੰਦ ਮਾਣਦੇ ਹੋ।
2. FOFs ਦੀਆਂ ਵੱਖ-ਵੱਖ ਕਿਸਮਾਂ ਕੀ ਹਨ?
A: ਪੰਜ ਵੱਖ-ਵੱਖ ਕਿਸਮਾਂ ਦੇ FOFs ਹਨ, ਅਤੇ ਇਹ ਹੇਠ ਲਿਖੇ ਅਨੁਸਾਰ ਹਨ:
- ਸੰਪੱਤੀ ਵੰਡ ਫੰਡ
- ਗੋਲਡ ਫੰਡ
- ਅੰਤਰਰਾਸ਼ਟਰੀ FOFs
- FOFs ETFs
- ਮਲਟੀ-ਪ੍ਰਬੰਧਕ FOFs
ਹਰੇਕ FOF ਦੀਆਂ ਵਿਲੱਖਣ ਵਿਸ਼ੇਸ਼ਤਾਵਾਂ ਹਨ। ਉਦਾਹਰਨ ਲਈ, ਸੋਨੇ ਦੇ ਫੰਡਾਂ ਵਿੱਚ ਤੁਸੀਂ ਨਿਵੇਸ਼ ਕਰੋਗੇਗੋਲਡ ETF ਅਤੇ ਮਲਟੀ-ਮੈਨੇਜਰ FOFs ਵਿੱਚ ਤੁਸੀਂ ਵੱਖ-ਵੱਖ ਕਿਸਮਾਂ ਦੇ ਮਿਉਚੁਅਲ ਫੰਡਾਂ ਵਿੱਚ ਨਿਵੇਸ਼ ਕਰੋਗੇ।
3. FOFs ਵਿੱਚ ਨਿਵੇਸ਼ ਕਰਦੇ ਸਮੇਂ ਕਿਹੜੇ ਮਾਪਦੰਡਾਂ 'ਤੇ ਵਿਚਾਰ ਕਰਨਾ ਚਾਹੀਦਾ ਹੈ?
A: FOFs ਮਿਉਚੁਅਲ ਫੰਡ ਹਨ, ਇਸਲਈ, ਜਦੋਂ ਤੁਸੀਂ ਨਿਵੇਸ਼ ਕਰਦੇ ਹੋ ਤਾਂ ਤੁਹਾਨੂੰ ਆਪਣੀ ਜੋਖਮ ਲੈਣ ਦੀ ਸਮਰੱਥਾ ਅਤੇ ਪੈਸੇ ਦੀ ਮਾਤਰਾ 'ਤੇ ਵਿਚਾਰ ਕਰਨਾ ਚਾਹੀਦਾ ਹੈ ਜੋ ਤੁਸੀਂ ਨਿਵੇਸ਼ ਕਰਨਾ ਚਾਹੁੰਦੇ ਹੋ। ਦਿੱਤੇ ਗਏ ਸਮੇਂ ਵਿੱਚ ਤੁਹਾਡੇ ਦੁਆਰਾ ਉਮੀਦ ਕੀਤੀ ਗਈ ਰਿਟਰਨ ਦੀ ਪ੍ਰਤੀਸ਼ਤਤਾ ਤੁਹਾਨੂੰ ਜੋਖਮ ਲੈਣ ਦੀ ਤੁਹਾਡੀ ਸਮਰੱਥਾ ਦਾ ਅੰਦਾਜ਼ਾ ਦੇਵੇਗੀ। ਇਸਦੇ ਆਧਾਰ 'ਤੇ, ਤੁਹਾਨੂੰ ਉਸ ਪੈਸੇ ਦਾ ਮੁਲਾਂਕਣ ਕਰਨਾ ਚਾਹੀਦਾ ਹੈ ਜੋ ਤੁਸੀਂ ਨਿਵੇਸ਼ ਕਰਨਾ ਚਾਹੁੰਦੇ ਹੋ। ਤੁਹਾਡੀ ਵਿੱਤੀ ਸਥਿਤੀ ਇਹ ਫੈਸਲਾ ਕਰਨ ਵਿੱਚ ਵੀ ਤੁਹਾਡੀ ਮਦਦ ਕਰੇਗੀ ਕਿ ਤੁਹਾਨੂੰ FOFs ਵਿੱਚ ਕਿੰਨਾ ਪੈਸਾ ਨਿਵੇਸ਼ ਕਰਨਾ ਚਾਹੀਦਾ ਹੈ।
ਇੱਕ ਵਾਰ ਜਦੋਂ ਤੁਸੀਂ ਇਹਨਾਂ ਦੋ ਕਾਰਕਾਂ ਦਾ ਮੁਲਾਂਕਣ ਕਰ ਲੈਂਦੇ ਹੋ, ਇੱਕ ਖਾਸ FOF ਚੁਣੋ ਅਤੇ ਨਿਵੇਸ਼ ਕਰਨਾ ਸ਼ੁਰੂ ਕਰੋ।
4. ਕਿਸ FOF ਨੇ ਸਭ ਤੋਂ ਵਧੀਆ ਰਿਟਰਨ ਦਿਖਾਇਆ ਹੈ?
A: ਗੋਲਡ FOFs ਨੂੰ ਸਭ ਤੋਂ ਸੁਰੱਖਿਅਤ ਨਿਵੇਸ਼ਾਂ ਵਿੱਚੋਂ ਇੱਕ ਮੰਨਿਆ ਜਾਂਦਾ ਹੈ। ਇਹ ਸੋਨੇ ਦੇ ਈਟੀਐਫ ਵਰਗੇ ਹਨ, ਅਤੇ ਜਦੋਂ ਤੁਸੀਂਸੋਨੇ ਵਿੱਚ ਨਿਵੇਸ਼ ਕਰੋ FOF, ਇਹ ਭੁਗਤਾਨ ਕਰਨ ਵਰਗੇ ਵਾਧੂ ਮੁੱਦਿਆਂ ਦੇ ਬਿਨਾਂ ਭੌਤਿਕ ਸੋਨੇ ਵਿੱਚ ਨਿਵੇਸ਼ ਕਰਨ ਵਰਗਾ ਹੈਜੀ.ਐੱਸ.ਟੀ,ਵਿਕਰੀ ਕਰ, ਜਾਂ ਦੌਲਤ ਟੈਕਸ। ਇਹ ਨਿਵੇਸ਼ ਸੁਰੱਖਿਅਤ ਹੈ ਕਿਉਂਕਿ ਸੋਨੇ ਦੀ ਕੀਮਤ ਬਾਜ਼ਾਰ ਦੇ ਮੁਕਾਬਲੇ ਕਦੇ ਵੀ ਵੱਡੇ ਪੱਧਰ 'ਤੇ ਨਹੀਂ ਡਿੱਗਦੀ ਅਤੇ ਇਸਲਈ, ਚੰਗਾ ਰਿਟਰਨ ਪੈਦਾ ਕਰਦਾ ਹੈ। ਇਸ ਤਰ੍ਹਾਂ, ਅਕਸਰ ਸੋਨੇ ਦੇ FOF ਨੂੰ ਸਭ ਤੋਂ ਵਧੀਆ ਅਤੇ ਸੁਰੱਖਿਅਤ ਨਿਵੇਸ਼ਾਂ ਵਿੱਚੋਂ ਇੱਕ ਮੰਨਿਆ ਜਾਂਦਾ ਹੈ।
5. ਕੀ ਕੋਈ ਆਮ FOFs ਹੈ?
A: ਐਕਸਚੇਂਜ ਟਰੇਡਡ ਫੰਡ ਜਾਂ ਈਟੀਐਫ ਸਭ ਤੋਂ ਪ੍ਰਸਿੱਧ ਐਫਓਐਫ ਹਨ ਕਿਉਂਕਿ ਇਹਨਾਂ ਫੰਡਾਂ ਵਿੱਚ ਨਿਵੇਸ਼ ਕਰਨਾ ਸਭ ਤੋਂ ਆਸਾਨ ਹੈ। ਤੁਹਾਨੂੰ ਬੱਸ ਓਪਨ ਏਡੀਮੈਟ ਖਾਤਾ ETFs ਵਿੱਚ ਵਪਾਰ ਕਰਨ ਲਈ, ਅਤੇ ਤੁਹਾਡੇ ਦੁਆਰਾ ETFs ਵਿੱਚ ਨਿਵੇਸ਼ ਕਰਨ ਦੀ ਰਕਮ ਦੀ ਕੋਈ ਸੀਮਾਵਾਂ ਨਹੀਂ ਹਨ।
6. FOF ਦੀਆਂ ਸਭ ਤੋਂ ਨਾਜ਼ੁਕ ਸੀਮਾਵਾਂ ਵਿੱਚੋਂ ਇੱਕ ਕੀ ਹੈ?
A: ਇਹ ਟੈਕਸਯੋਗ ਹੈ। ਇੱਕ ਨਿਵੇਸ਼ਕ ਵਜੋਂ, ਜਦੋਂ ਤੁਸੀਂ ਆਪਣਾ ਨਿਵੇਸ਼ ਰੀਡੀਮ ਕਰਦੇ ਹੋ ਤਾਂ ਤੁਹਾਨੂੰ ਮੂਲ ਰਕਮ 'ਤੇ ਟੈਕਸ ਦਾ ਭੁਗਤਾਨ ਕਰਨਾ ਪਵੇਗਾ। ਜੇਕਰ ਤੁਸੀਂ ਥੋੜ੍ਹੇ ਸਮੇਂ ਲਈ FOF ਵਿੱਚ ਨਿਵੇਸ਼ ਕਰਦੇ ਹੋ, ਤਾਂ ਤੁਹਾਨੂੰ ਭੁਗਤਾਨ ਕਰਨਾ ਪਵੇਗਾਟੈਕਸ ਪ੍ਰਿੰਸੀਪਲ ਅਤੇ ਰਿਟਰਨ 'ਤੇ। ਹਾਲਾਂਕਿ, ਕਮਾਇਆ ਲਾਭਅੰਸ਼ ਟੈਕਸਯੋਗ ਨਹੀਂ ਹੈ ਕਿਉਂਕਿ ਫੰਡ ਹਾਊਸ ਟੈਕਸ ਸਹਿਣ ਕਰਦਾ ਹੈ।
7. ਕੀ FOFs ਦਾ ਲਾਕ-ਇਨ ਪੀਰੀਅਡ ਲੰਬਾ ਹੁੰਦਾ ਹੈ?
A: ਵੱਖ-ਵੱਖ FOFs ਦੇ ਵੱਖ-ਵੱਖ ਨਿਵੇਸ਼ ਸਮੇਂ ਹੁੰਦੇ ਹਨ। ਹਾਲਾਂਕਿ, ਜੇਕਰ ਤੁਸੀਂ ਵੱਧ ਤੋਂ ਵੱਧ ਰਿਟਰਨ ਕਮਾਉਣਾ ਚਾਹੁੰਦੇ ਹੋ, ਤਾਂ ਤੁਹਾਨੂੰ ਲਾਜ਼ਮੀ ਤੌਰ 'ਤੇ ਲੰਬੇ ਸਮੇਂ ਲਈ FOFs ਵਿੱਚ ਨਿਵੇਸ਼ ਕਰਨਾ ਚਾਹੀਦਾ ਹੈ।
ਇਹ ਯਕੀਨੀ ਬਣਾਉਣ ਲਈ ਸਾਰੇ ਯਤਨ ਕੀਤੇ ਗਏ ਹਨ ਕਿ ਇੱਥੇ ਦਿੱਤੀ ਗਈ ਜਾਣਕਾਰੀ ਸਹੀ ਹੈ। ਹਾਲਾਂਕਿ, ਡੇਟਾ ਦੀ ਸ਼ੁੱਧਤਾ ਬਾਰੇ ਕੋਈ ਗਾਰੰਟੀ ਨਹੀਂ ਦਿੱਤੀ ਗਈ ਹੈ। ਕਿਰਪਾ ਕਰਕੇ ਕੋਈ ਵੀ ਨਿਵੇਸ਼ ਕਰਨ ਤੋਂ ਪਹਿਲਾਂ ਸਕੀਮ ਜਾਣਕਾਰੀ ਦਸਤਾਵੇਜ਼ ਨਾਲ ਤਸਦੀਕ ਕਰੋ।
You Might Also Like










AMFI Registration No. 112358 | CIN: U74999MH2016PTC282153
Shepard Technologies Pvt. Ltd. (with ARN code 112358) makes no warranties or representations, express or implied, on products offered through the platform. It accepts no liability for any damages or losses, however caused, in connection with the use of, or on the reliance of its product or related services. Terms and conditions of the website are applicable.
©2026 Shepard Technologies Private Limited. All Rights Reserved
Research Highlights for PGIM India Euro Equity Fund