
 +91-22-48913909
ਬੀਐਸਈ ਸੈਂਸੈਕਸ ਵਿੱਚ ਸਾਲਾਂ ਦੌਰਾਨ ਵਾਧਾ
ਇਕੁਇਟੀਜ਼ ਲੰਬੇ ਸਮੇਂ ਲਈ ਚੰਗੇ ਕਿਉਂ ਹਨ?
ਜਦੋਂ ਵੀ ਅਸੀਂ ਇਕੁਇਟੀ ਨਿਵੇਸ਼ ਬਾਰੇ ਸੁਣਦੇ ਹਾਂ, ਸਭ ਤੋਂ ਪਹਿਲਾਂ ਜੋ ਅਸੀਂ ਸੁਣਦੇ ਹਾਂ, ਇਕੁਇਟੀ ਲੰਬੇ ਸਮੇਂ ਦੇ ਨਿਵੇਸ਼ ਲਈ ਚੰਗੀ ਹੁੰਦੀ ਹੈ। ਹਾਲਾਂਕਿ, ਵੱਖ-ਵੱਖ ਲੋਕ ਇਕੁਇਟੀ ਨਿਵੇਸ਼ ਦੇ ਸਬੰਧ ਵਿੱਚ ਨਕਾਰਾਤਮਕ ਵਿਚਾਰ ਰੱਖਦੇ ਹਨ। ਇਸ ਲਈ, ਆਓ ਸਮਝੀਏ ਕਿ ਲੰਬੇ ਸਮੇਂ ਲਈ ਇਕੁਇਟੀ ਇੱਕ ਚੰਗਾ ਨਿਵੇਸ਼ ਕਿਉਂ ਅਤੇ ਕਿਵੇਂ ਹੈ, ਇਕੁਇਟੀ ਨਿਵੇਸ਼ ਦੇ ਪਿੱਛੇ ਦੀਆਂ ਮਿੱਥਾਂ, ਅਤੇ ਮਾਪਦੰਡਾਂ ਦੀ ਜਾਂਚ ਕੀਤੀ ਜਾਣੀ ਚਾਹੀਦੀ ਹੈਨਿਵੇਸ਼ ਇਕੁਇਟੀ ਅਤੇ ਸੰਕਲਪ ਵਿੱਚਇਕੁਇਟੀ ਫੰਡ.
ਸੈਂਸੈਕਸ ਦੇ ਪਿਛਲੇ ਪ੍ਰਦਰਸ਼ਨ ਨੂੰ ਸਮਝਣਾ
ਹੁਣ, ਆਓ ਹੇਠਾਂ ਦਿੱਤੇ ਗ੍ਰਾਫ ਦੀ ਮਦਦ ਨਾਲ ਸੈਂਸੈਕਸ ਦੀ ਸ਼ੁਰੂਆਤ ਤੋਂ ਲੈ ਕੇ ਹੁਣ ਤੱਕ ਦੇ ਪ੍ਰਦਰਸ਼ਨ 'ਤੇ ਧਿਆਨ ਕੇਂਦਰਿਤ ਕਰੀਏ।
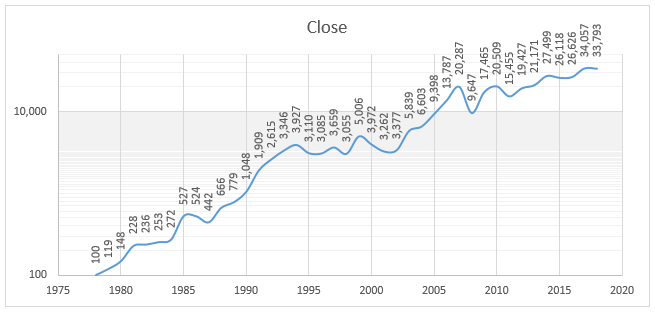
(3 ਜਨਵਰੀ, 2018 ਨੂੰ, ਸਰੋਤ- BSE ਲਿਮਿਟੇਡ)
ਸੈਂਸੈਕਸ ਦਾ ਦਿੱਤਾ ਗਿਆ ਗ੍ਰਾਫ ਦਿਖਾਉਂਦਾ ਹੈ ਕਿ 1979 ਵਿੱਚ ਇਸਦੀ ਸ਼ੁਰੂਆਤ ਤੋਂ ਲੈ ਕੇ ਹੁਣ ਤੱਕ ਇਸ ਵਿੱਚ ਕੁੱਲ ਵਾਧਾ ਹੋਇਆ ਹੈ। ਜਿਸ ਮਿਤੀ 'ਤੇ ਡੇਟਾ ਲਿਆ ਗਿਆ ਹੈ ਉਹ 03 ਜਨਵਰੀ, 2018 ਹੈ। 1979 ਤੋਂ ਹੁਣ ਤੱਕ,ਮਿਸ਼ਰਿਤ ਸਾਲਾਨਾ ਵਿਕਾਸ ਦਰ (ਸੀ.ਏ.ਜੀ.ਆਰ) ਲਗਭਗ 16.39% ਹੈ. ਹਾਲਾਂਕਿ, ਇਸਦਾ ਮਤਲਬ ਇਹ ਨਹੀਂ ਹੈ ਕਿ ਸੈਂਸੈਕਸ ਸਿਰਫ ਉੱਪਰ ਵੱਲ ਵਧਿਆ ਹੈ.ਹਾਲਾਂਕਿ, ਸੈਂਸੈਕਸ ਵਿੱਚ ਸਭ ਤੋਂ ਵੱਡਾ ਵਾਧਾ 1979-1994 ਦੀ ਮਿਆਦ ਦੇ ਵਿਚਕਾਰ ਹੈ ਜਦੋਂ ਬਾਜ਼ਾਰ 100 ਤੋਂ 3,927 ਪੁਆਇੰਟ ਤੱਕ ਵਧਿਆ ਸੀ।. ਜਿਨ੍ਹਾਂ ਲੋਕਾਂ ਨੇ ਇਸ ਸਮੇਂ ਦੌਰਾਨ ਨਿਵੇਸ਼ ਕੀਤਾ ਸੀ, ਉਨ੍ਹਾਂ ਨੂੰ ਕਾਫ਼ੀ ਲਾਭ ਹੋਇਆ ਹੋਵੇਗਾ। ਇਸ ਤੋਂ ਇਲਾਵਾ, ਇਹਨਾਂ ਨਿਵੇਸ਼ਕਾਂ ਨੂੰ ਵੀ ਦੂਜਿਆਂ ਵਾਂਗ ਬਹੁਤ ਜ਼ਿਆਦਾ ਨਕਾਰਾਤਮਕ ਰਿਟਰਨ ਦਾ ਸਾਹਮਣਾ ਨਹੀਂ ਕਰਨਾ ਪਿਆ। ਨਤੀਜੇ ਵਜੋਂ, ਇਹ ਲੋਕ ਯਕੀਨੀ ਤੌਰ 'ਤੇ ਕਮਾਏ ਹੋਣਗੇ.ਦੂਜਾ ਸਭ ਤੋਂ ਵਧੀਆ ਪੜਾਅ 2003-2007 ਦੌਰਾਨ ਨਿਵੇਸ਼ਕਾਂ ਨੇ ਰਿਟਰਨ ਕਮਾਇਆ ਸੀ, ਪਰ ਇਸ ਮਿਆਦ ਦੇ ਦੌਰਾਨ ਵਾਧਾ ਪਹਿਲੇ ਪੜਾਅ ਵਾਂਗ ਪ੍ਰਭਾਵਸ਼ਾਲੀ ਨਹੀਂ ਸੀ।
ਇਸ ਲਈ, ਕੀ ਤੁਸੀਂ ਸੋਚਦੇ ਹੋ ਕਿਬਜ਼ਾਰ ਹਮੇਸ਼ਾ ਇੱਕ ਚੰਗੀ ਗਤੀ ਦੇਖੀ ਹੈ?ਇਸ ਵਿਚ ਗਿਰਾਵਟ ਵੀ ਦੇਖਣ ਨੂੰ ਮਿਲੀ ਹੈ। ਸਤੰਬਰ 1994 - 1999, 2000 - 2003, ਅਤੇ 2008 - 2010 ਦੇ ਦੌਰਾਨ ਸੈਂਸੈਕਸ ਵਿੱਚ ਗਿਰਾਵਟ ਦਿਖਾਉਣ ਵਾਲੇ ਕੁਝ ਸਭ ਤੋਂ ਭੈੜੇ ਸਪੈਲ ਸਨ।. ਕੋਈ ਵੀ ਵਿਅਕਤੀ ਜਿਸ ਨੇ ਇਸ ਮਿਆਦ ਦੇ ਦੌਰਾਨ ਨਿਵੇਸ਼ ਕੀਤਾ ਹੋਵੇਗਾ ਯਕੀਨੀ ਤੌਰ 'ਤੇ ਨਕਾਰਾਤਮਕ ਹੋਵੇਗਾ. ਹਾਲਾਂਕਿ, ਦੁਬਾਰਾ, ਜੇਕਰ ਇਹਨਾਂ ਨਿਵੇਸ਼ਕਾਂ ਨੇ ਆਪਣੇ ਨਿਵੇਸ਼ ਨੂੰ ਲੰਬੇ ਸਮੇਂ ਤੱਕ ਰੱਖਿਆ ਹੁੰਦਾ, ਤਾਂ ਉਹਨਾਂ ਨੇ ਯਕੀਨੀ ਤੌਰ 'ਤੇ ਮੁਨਾਫਾ ਕਮਾਇਆ ਹੁੰਦਾ। ਜਿਵੇਂ ਕਿ ਅਸੀਂ ਨਕਸ਼ੇ ਵਿੱਚ ਦੇਖ ਸਕਦੇ ਹਾਂ, ਗਿਰਾਵਟ ਦੀ ਮਿਆਦ ਬਹੁਤ ਜ਼ਿਆਦਾ ਦਿਖਾਈ ਨਹੀਂ ਦਿੰਦੀ.
ਇਸ ਲਈ, ਇਕੁਇਟੀ ਬਾਰੇ ਮਿੱਥਾਂ ਨੂੰ ਸਮਝਣ ਤੋਂ ਬਾਅਦ, ਆਓ ਹੁਣ ਦੇਖੀਏ ਕਿ ਸਟਾਕਾਂ ਨੂੰ ਕਿਵੇਂ ਚੁਣਨਾ ਹੈ।
ਇਕੁਇਟੀ ਨਿਵੇਸ਼ ਦੇ ਪਿੱਛੇ ਆਮ ਮਿੱਥ
ਜਿਵੇਂ ਕਿ ਪਹਿਲਾਂ ਦੱਸਿਆ ਗਿਆ ਹੈ, ਇਕੁਇਟੀ ਨਿਵੇਸ਼ ਇਸ ਨਾਲ ਜੁੜੀਆਂ ਕਈ ਮਿੱਥਾਂ ਹਨ। ਇਸ ਲਈ, ਆਓ ਇਕੁਇਟੀ ਨਿਵੇਸ਼ ਦੇ ਪਿੱਛੇ ਕੁਝ ਪ੍ਰਚਲਿਤ ਮਿੱਥਾਂ ਨੂੰ ਵੇਖੀਏ.
1. ਜੇਕਰ ਕਿਸੇ ਸਟਾਕ ਨੇ ਅਤੀਤ ਵਿੱਚ ਚੰਗਾ ਪ੍ਰਦਰਸ਼ਨ ਕੀਤਾ ਹੈ, ਤਾਂ ਇਹ ਭਵਿੱਖ ਵਿੱਚ ਵੀ ਚੰਗਾ ਕੰਮ ਕਰੇਗਾ
ਸ਼ੇਅਰਾਂ ਵਿੱਚ ਨਿਵੇਸ਼ ਕਰਨ ਵੇਲੇ ਲੋਕ ਜੋ ਵਿਸ਼ਵਾਸ ਕਰਦੇ ਹਨ ਉਹ ਹੈ; ਜੇਕਰ ਕਿਸੇ ਕੰਪਨੀ ਨੇ ਅਤੀਤ ਵਿੱਚ ਚੰਗਾ ਪ੍ਰਦਰਸ਼ਨ ਕੀਤਾ ਹੈ, ਤਾਂ ਇਹ ਭਵਿੱਖ ਵਿੱਚ ਵੀ ਚੰਗਾ ਪ੍ਰਦਰਸ਼ਨ ਕਰੇਗੀ। ਹਾਲਾਂਕਿ ਇਹ ਵਿਚਾਰ ਅਜੇ ਵੀ ਕੁਝ ਆਰਾਮਦਾਇਕ ਪੱਧਰ ਦੇ ਸਕਦਾ ਹੈ; ਇਹ ਪੂਰੀ ਤਰ੍ਹਾਂ ਸੱਚ ਨਹੀਂ ਹੈ। ਇਹ ਇਸ ਲਈ ਹੈ ਕਿਉਂਕਿ; ਕਿਸੇ ਕੰਪਨੀ ਦੀ ਸਫਲਤਾ ਹਮੇਸ਼ਾ ਉਸ ਮਾਹੌਲ 'ਤੇ ਨਿਰਭਰ ਕਰਦੀ ਹੈ ਜਿਸ ਵਿੱਚ ਇਹ ਪ੍ਰਦਰਸ਼ਨ ਕਰਦੀ ਹੈ ਅਤੇ ਕੀ ਇਹ ਆਪਣੇ ਆਪ ਨੂੰ ਬਦਲਦੀਆਂ ਵਪਾਰਕ ਸਥਿਤੀਆਂ ਅਨੁਸਾਰ ਢਾਲਣ ਦੇ ਯੋਗ ਹੈ ਜਾਂ ਨਹੀਂ। ਜੇ ਇਹ ਅਜਿਹਾ ਕਰਨ ਦੇ ਯੋਗ ਨਹੀਂ ਹੈ; ਕੰਪਨੀ ਭਵਿੱਖ ਵਿੱਚ ਪ੍ਰਦਰਸ਼ਨ ਕਰਨ ਦੀ ਸਥਿਤੀ ਵਿੱਚ ਨਹੀਂ ਹੋਵੇਗੀ।
ਇਸ ਲਈ, ਲੋਕਾਂ ਨੂੰ ਕਿਸੇ ਵੀ ਕੰਪਨੀ ਦੇ ਸ਼ੇਅਰਾਂ ਵਿੱਚ ਨਿਵੇਸ਼ ਕਰਨ ਤੋਂ ਪਹਿਲਾਂ ਸਵੈ-ਵਿਸ਼ਲੇਸ਼ਣ ਕਰਨਾ ਚਾਹੀਦਾ ਹੈ। ਉਹਨਾਂ ਨੂੰ ਕੰਪਨੀ ਦੀ ਪਿਛਲੀ ਕਾਰਗੁਜ਼ਾਰੀ, ਇਸ ਦੀਆਂ ਭਵਿੱਖ ਦੀਆਂ ਸੰਭਾਵਨਾਵਾਂ, ਉਦਯੋਗ ਦੀਆਂ ਸਥਿਤੀਆਂ ਜਿਸ ਵਿੱਚ ਇਹ ਪ੍ਰਦਰਸ਼ਨ ਕਰਦੀ ਹੈ, ਅਤੇ ਹੋਰ ਸਬੰਧਤ ਮਾਪਦੰਡਾਂ ਦੀ ਜਾਂਚ ਕਰਨੀ ਚਾਹੀਦੀ ਹੈ।
2. ਮੈਂ ਇਕੁਇਟੀਜ਼ ਦੁਆਰਾ ਤੇਜ਼ੀ ਨਾਲ ਰਿਟਰਨ ਕਮਾਉਣ ਦੇ ਯੋਗ ਨਹੀਂ ਹਾਂ ਕਿਉਂਕਿ ਇਹ ਪੂਰੀ ਕਿਸਮਤ ਹੈ
ਦੂਜੀ ਧਾਰਨਾ ਲੋਕ ਮਹਿਸੂਸ ਕਰਦੇ ਹਨ ਕਿ ਉਹ ਇਕੁਇਟੀ ਨਿਵੇਸ਼ ਦੁਆਰਾ ਕਮਾਈ ਨਹੀਂ ਕਰ ਸਕਦੇ ਕਿਉਂਕਿ ਇਹ ਪੂਰੀ ਕਿਸਮਤ 'ਤੇ ਅਧਾਰਤ ਹੈ। ਹਾਲਾਂਕਿ, ਜਿਵੇਂ ਕਿ ਪਿਛਲੇ ਪੈਰੇ ਵਿੱਚ ਦੱਸਿਆ ਗਿਆ ਹੈ, ਲੋਕਾਂ ਨੂੰ ਇਹ ਸਮਝਣ ਦੀ ਜ਼ਰੂਰਤ ਹੈ ਕਿ ਔਸਤ ਰਿਟਰਨ ਦੀ ਪਰਿਵਰਤਨ ਹੋਲਡਿੰਗ ਦੇ ਕਾਰਜਕਾਲ ਵਿੱਚ ਵਾਧੇ ਦੇ ਨਾਲ ਘੱਟ ਜਾਂਦੀ ਹੈ। ਇਹ ਇਸ ਲਈ ਹੈ ਕਿਉਂਕਿ, ਲੰਬੇ ਸਮੇਂ ਵਿੱਚ, ਥੋੜ੍ਹੇ ਸਮੇਂ ਦੀ ਅਸਥਿਰਤਾ ਦਾ ਉਤਰਾਅ-ਚੜ੍ਹਾਅ ਘੱਟ ਜਾਂਦਾ ਹੈ ਅਤੇ ਨੁਕਸਾਨ ਹੋਣ ਦੀ ਸੰਭਾਵਨਾ ਵੀ ਘੱਟ ਹੁੰਦੀ ਹੈ। ਨਤੀਜੇ ਵਜੋਂ, ਵਿੱਚ ਭਿੰਨਤਾਵਾਂਕਮਾਈਆਂ ਕਾਰਜਕਾਲ ਵਿੱਚ ਵਾਧੇ ਦੇ ਨਾਲ ਘਟਣਾ ਸ਼ੁਰੂ ਹੋ ਜਾਂਦਾ ਹੈ। ਇਸ ਸੰਕਲਪ ਨੂੰ ਹੇਠਾਂ ਦਿੱਤੀ ਗਈ ਸਾਰਣੀ ਦੀ ਮਦਦ ਨਾਲ ਸਮਝਾਇਆ ਗਿਆ ਹੈ।
| ਨਿਵੇਸ਼ ਦਾ ਕਾਰਜਕਾਲ | ਔਸਤ ਰਿਟਰਨ (%) | ਔਸਤ (%) ਤੋਂ ਵਾਪਸੀ ਦਾ ਵਿਵਹਾਰ |
|---|---|---|
| 1 ਸਾਲ | 18 | ± 34 |
| 3 ਸਾਲ | 13 | ± 16% |
| 5 ਸਾਲ | 13 | ± 13% |
| 7 ਸਾਲ | 13 | ± 10% |
| 10 ਸਾਲ | 13 | ± 9% |
| 12 ਸਾਲ | 13 | ± 8% |
| 14 ਸਾਲ | 12 | ± 7% |
3. ਸ਼ੇਅਰ ਬਾਜ਼ਾਰਾਂ ਵਿੱਚ ਕੁਝ ਹੀ ਕਮਾਈ ਕਰ ਰਹੇ ਹਨ ਕਿਉਂਕਿ ਇਕੁਇਟੀ ਬਾਜ਼ਾਰ ਅਸਥਿਰ ਹਨ
ਇਹ ਵਿਅਕਤੀਆਂ ਵਿੱਚ ਪ੍ਰਚਲਿਤ ਮਿੱਥਾਂ ਵਿੱਚੋਂ ਇੱਕ ਹੈ। ਬਹੁਤ ਸਾਰੇ ਲੋਕ ਮਹਿਸੂਸ ਕਰਦੇ ਹਨ ਕਿ ਉਹ ਸ਼ੇਅਰਾਂ ਵਿੱਚ ਨਿਵੇਸ਼ ਕਰਕੇ ਕਮਾਈ ਨਹੀਂ ਕਰ ਸਕਦੇ। ਬਹੁਤ ਸਾਰੇ ਮਾਮਲਿਆਂ ਵਿੱਚ ਵਿਅਕਤੀ ਮਹਿਸੂਸ ਕਰਦੇ ਹਨ; ਹਾਲਾਂਕਿ ਸ਼ੇਅਰ ਬਾਜ਼ਾਰਾਂ ਵਿੱਚ ਤੇਜ਼ੀ ਦਿਖਾਈ ਦੇ ਰਹੀ ਹੈ; ਫਿਰ ਵੀ ਮੈਂ ਆਪਣੀ ਕਿਸਮਤ ਬਣਾਉਣ ਦੇ ਯੋਗ ਨਹੀਂ ਹਾਂ। ਹਾਲਾਂਕਿ, ਇਹ ਸੱਚ ਨਹੀਂ ਹੈ।
*ਇੱਕ ਨੂੰ ਸਮਝਣਾ ਪਵੇਗਾ ਕਿ ਇਕੁਇਟੀ ਨਿਵੇਸ਼ ਇੱਕ ਜ਼ੀਰੋ-ਸਮ ਗੇਮ ਹੈ। ਇਸ ਲਈ, ਇੱਕ ਵਿਅਕਤੀ ਦਾ ਲਾਭ ਦੂਜੇ ਵਿਅਕਤੀ ਦਾ ਨੁਕਸਾਨ ਹੈ। ਹਾਲਾਂਕਿ, ਇਸ ਗੱਲ ਦਾ ਨਤੀਜਾ ਕਿ ਕੀ ਤੁਸੀਂ ਲਾਭ ਕਮਾਇਆ ਹੈ ਜਾਂ ਨੁਕਸਾਨ ਵਿੱਚ ਖਤਮ ਹੋਇਆ ਹੈ, ਉਸ ਸਮੇਂ ਦਾ ਫੈਸਲਾ ਕੀਤਾ ਜਾਂਦਾ ਹੈ ਜਦੋਂ ਤੁਸੀਂ ਮਾਰਕੀਟ ਵਿੱਚ ਦਾਖਲ ਹੁੰਦੇ ਹੋ ਅਤੇ ਬਾਹਰ ਜਾਂਦੇ ਹੋ। *
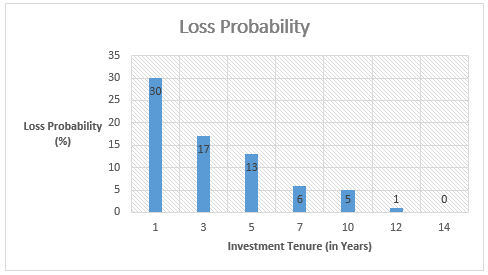
ਇਹ ਦੁਬਾਰਾ ਦੁਹਰਾਇਆ ਜਾਵੇਗਾ ਕਿ, ਇਕੁਇਟੀ ਨਿਵੇਸ਼ਾਂ ਵਿੱਚ ਸਫਲਤਾ ਦੀ ਕੁੰਜੀ ਇਸਦੀ ਲੰਮੀ ਮਿਆਦ ਦੀ ਹੋਲਡਿੰਗ ਹੈ। ਦੁਨੀਆ ਦੇ ਮਸ਼ਹੂਰਾਂ ਵਿੱਚੋਂ ਇੱਕਨਿਵੇਸ਼ਕ ਵਾਰੇਨ ਬਫੇ ਨੇ ਆਪਣਾ ਸਾਮਰਾਜ ਸਿਰਫ਼ ਨਿਵੇਸ਼ ਕਰਕੇ ਨਹੀਂ ਬਣਾਇਆ। ਇਸ ਦੀ ਬਜਾਏ, ਉਸਨੇ ਲੰਬੇ ਸਮੇਂ ਲਈ ਨਿਵੇਸ਼ਾਂ ਨੂੰ ਰੱਖਣ ਦੇ ਕਾਰਨ ਦੌਲਤ ਕਮਾਈ ਹੈ। ਲੰਬੇ ਸਮੇਂ ਦੇ ਨਿਵੇਸ਼ ਦੇ ਮਾਮਲੇ ਵਿੱਚ, ਨਿਵੇਸ਼ ਕੀਤੀ ਗਈ ਥੋੜ੍ਹੀ ਜਿਹੀ ਰਕਮ ਵੀ ਇੱਕ ਵੱਡੀ ਵਾਪਸੀ ਦਿੰਦੀ ਹੈ। ਜਿਹੜੇ ਲੋਕ ਬਹੁਤ ਲੰਬੇ ਸਮੇਂ ਲਈ ਨਿਵੇਸ਼ ਕਰਦੇ ਰਹਿੰਦੇ ਹਨ ਉਹ ਥੋੜ੍ਹੇ ਜਿਹੇ ਨਿਵੇਸ਼ ਨਾਲ ਵੀ ਕਿਸਮਤ ਕਮਾ ਸਕਦੇ ਹਨ। ਹੇਠਾਂ ਦਿੱਤਾ ਗ੍ਰਾਫ ਦਿਖਾਉਂਦਾ ਹੈ ਕਿ ਨਿਵੇਸ਼ ਦੀ ਮਿਆਦ ਵਿੱਚ ਵਾਧੇ ਦੇ ਨਾਲ ਨੁਕਸਾਨ ਦੀ ਸੰਭਾਵਨਾ ਕਿਵੇਂ ਘਟਦੀ ਹੈ।
Talk to our investment specialist
ਇਕੁਇਟੀਜ਼ ਵਿੱਚ ਨਿਵੇਸ਼ ਕਿਵੇਂ ਕਰਨਾ ਹੈ
ਇਹ ਸਭ ਤੋਂ ਮਹੱਤਵਪੂਰਨ ਕਦਮ ਹੈ। ਇਕੁਇਟੀ ਵਿਚ ਨਿਵੇਸ਼ ਕਰਦੇ ਸਮੇਂ ਲੋਕਾਂ ਨੂੰ ਕੁਝ ਬੁਨਿਆਦੀ ਨਿਯਮਾਂ ਦੀ ਪਾਲਣਾ ਕਰਨ ਦੀ ਲੋੜ ਹੁੰਦੀ ਹੈ। ਇਹਨਾਂ ਵਿੱਚੋਂ ਕੁਝ ਨਿਯਮ ਹੇਠਾਂ ਦਿੱਤੇ ਅਨੁਸਾਰ ਸੂਚੀਬੱਧ ਕੀਤੇ ਗਏ ਹਨ।
ਇਸਦੇ ਸੰਪੂਰਨ ਵਿਸ਼ਲੇਸ਼ਣ ਤੋਂ ਬਾਅਦ ਸਟਾਕਾਂ ਵਿੱਚ ਨਿਵੇਸ਼ ਕਰੋ ਅਤੇ ਝੁੰਡ ਦੇ ਵਿਵਹਾਰ ਦੀ ਪਾਲਣਾ ਨਾ ਕਰੋ
ਨਿਵੇਸ਼ ਦਾ ਪ੍ਰਾਇਮਰੀ ਨਿਯਮ ਹੈ; ਉਹਨਾਂ ਵਿੱਤੀ ਸਾਧਨਾਂ ਵਿੱਚ ਨਿਵੇਸ਼ ਕਰੋ ਜਿਹਨਾਂ ਨੂੰ ਤੁਸੀਂ ਸਮਝਦੇ ਹੋ ਅਤੇ ਉਹਨਾਂ ਵਿੱਚ ਨਹੀਂ ਜੋ ਤੁਸੀਂ ਨਹੀਂ ਸਮਝਦੇ। ਇਸ ਲਈ, ਲੋਕਾਂ ਨੂੰ ਉਹਨਾਂ ਸ਼ੇਅਰਾਂ ਦਾ ਪੂਰਾ ਵਿਸ਼ਲੇਸ਼ਣ ਕਰਨਾ ਚਾਹੀਦਾ ਹੈ ਜਿਸ ਵਿੱਚ ਉਹ ਨਿਵੇਸ਼ ਕਰਨਾ ਚਾਹੁੰਦੇ ਹਨ। ਉਨ੍ਹਾਂ ਨੂੰ ਇਸ ਦੀਆਂ ਸਾਲਾਨਾ ਰਿਪੋਰਟਾਂ ਵਿੱਚੋਂ ਲੰਘਣਾ ਚਾਹੀਦਾ ਹੈ, ਇਸ ਦੀਆਂ ਭਵਿੱਖ ਦੀਆਂ ਸੰਭਾਵਨਾਵਾਂ ਦੀ ਜਾਂਚ ਕਰਨੀ ਚਾਹੀਦੀ ਹੈ। ਇਸ ਤੋਂ ਇਲਾਵਾ, ਕਿਸੇ ਨੂੰ ਆਪਣੀ ਸਟਾਕ ਚੋਣ ਪ੍ਰਕਿਰਿਆ ਵਿੱਚ ਪੱਖਪਾਤੀ ਨਹੀਂ ਹੋਣਾ ਚਾਹੀਦਾ। ਇਸ ਤੋਂ ਇਲਾਵਾ, ਨਿਵੇਸ਼ ਕਰਨ ਦੀ ਗੱਲ ਆਉਂਦੀ ਹੈ ਤਾਂ ਬਹੁਤ ਸਾਰੇ ਲੋਕ ਝੁੰਡ ਦੇ ਵਿਵਹਾਰ ਦੀ ਪਾਲਣਾ ਕਰਦੇ ਹਨ, ਜੋ ਕਿ ਅਜਿਹਾ ਨਹੀਂ ਹੋਣਾ ਚਾਹੀਦਾ ਹੈ। ਇਹ ਇੱਕ ਚੰਗਾ ਵਿਚਾਰ ਨਹੀਂ ਹੈ। ਝੁੰਡ ਦਾ ਹਿੱਸਾ ਬਣਨ ਵਾਲੇ ਲੋਕ, ਜਦੋਂ ਬਾਜ਼ਾਰ ਆਪਣੇ ਸਿਖਰ 'ਤੇ ਹੁੰਦਾ ਹੈ ਤਾਂ ਦਾਖਲ ਹੁੰਦੇ ਹਨ ਅਤੇ ਜਦੋਂ ਇਹ ਹੇਠਾਂ ਬਣਦਾ ਹੈ ਤਾਂ ਵੇਚਦੇ ਹਨ। ਇਸ ਲਈ, ਸਾਵਧਾਨ ਰਹੋ ਕਿ ਤੁਸੀਂ ਸ਼ੇਅਰ ਨਾ ਖਰੀਦੋ ਜਦੋਂ ਸਾਰੇ ਇੱਕ ਖਰੀਦ ਵਿੱਚ ਦਾਖਲ ਹੁੰਦੇ ਹਨਕਾਲ ਕਰੋ ਅਤੇ ਨਾ ਵੇਚੋ ਜਦੋਂ ਹਰ ਕੋਈ ਵੇਚਣ ਦੀ ਦੌੜ 'ਤੇ ਜਾਂਦਾ ਹੈ।
ਵਿਭਿੰਨਤਾ ਸਫਲਤਾ ਦੀ ਕੁੰਜੀ ਹੈ
ਨਿਵੇਸ਼ ਦੇ ਮਾਮਲੇ ਵਿੱਚ ਮਹੱਤਵਪੂਰਨ ਭੂਮਿਕਾ ਵਿਭਿੰਨਤਾ ਹੈ, ਜੋ ਕਿ ਸਫਲਤਾ ਦੀ ਕੁੰਜੀ ਹੈ ਕਿਉਂਕਿ ਇਹ ਜੋਖਮ ਦੇ ਪੱਧਰ ਨੂੰ ਘਟਾਉਣ ਵਿੱਚ ਮਦਦ ਕਰਦੀ ਹੈ। ਜਿਵੇਂ ਕਿ ਸਹੀ ਹਵਾਲਾ ਦਿੱਤਾ ਗਿਆ ਹੈ"ਆਪਣੇ ਸਾਰੇ ਅੰਡੇ ਇੱਕ ਟੋਕਰੀ ਵਿੱਚ ਨਾ ਪਾਓ;" ਇਸੇ ਤਰ੍ਹਾਂ ਤੁਹਾਡੇ ਨਿਵੇਸ਼ ਨੂੰ ਪਹਿਲਾਂ ਤੋਂ ਪਰਿਭਾਸ਼ਿਤ ਅਨੁਪਾਤ ਵਿੱਚ ਕਈ ਸਟਾਕਾਂ ਵਿੱਚ ਵੰਡਿਆ ਜਾਣਾ ਚਾਹੀਦਾ ਹੈ। ਵਿਭਿੰਨਤਾ, ਇਸ ਸੰਦਰਭ ਵਿੱਚ, ਦਾ ਮਤਲਬ ਹੈ ਕਿ ਲੋਕ ਪੂੰਜੀਕਰਣ, ਸੈਕਟਰਾਂ ਅਤੇ ਹੋਰ ਮਾਪਦੰਡਾਂ ਦੇ ਸਬੰਧ ਵਿੱਚ ਵੱਖ-ਵੱਖ ਕੰਪਨੀਆਂ ਦੇ ਵੱਖ-ਵੱਖ ਸ਼ੇਅਰਾਂ ਵਿੱਚ ਕਾਰਪਸ ਦਾ ਨਿਵੇਸ਼ ਕਰਦੇ ਹਨ। ਇਹ ਇਸ ਲਈ ਹੈ ਕਿਉਂਕਿ ਅਜਿਹੀਆਂ ਸਥਿਤੀਆਂ ਹਨ ਜਿੱਥੇਮਿਡ-ਕੈਪ ਸ਼ੇਅਰ ਵੱਡੇ-ਕੈਪ ਸ਼ੇਅਰਾਂ ਨੂੰ ਪਛਾੜਦੇ ਹਨ। ਇਸ ਲਈ, ਕਿਸੇ ਨੂੰ ਇਸ ਗੱਲ 'ਤੇ ਲਗਾਤਾਰ ਨਜ਼ਰ ਰੱਖਣ ਦੀ ਜ਼ਰੂਰਤ ਹੁੰਦੀ ਹੈ ਕਿ ਸ਼ੇਅਰ ਕਿਵੇਂ ਪ੍ਰਦਰਸ਼ਨ ਕਰ ਰਿਹਾ ਹੈ।
ਆਪਣੇ ਪੋਰਟਫੋਲੀਓ ਨੂੰ ਸਮੇਂ ਸਿਰ ਮੁੜ ਸੰਤੁਲਿਤ ਕਰੋ
ਇਹ ਸਹੀ ਕਿਹਾ ਗਿਆ ਹੈ ਕਿ, ਗਲਤੀ ਕਰਨਾ ਮਨੁੱਖ ਹੈ. ਇਸੇ ਤਰ੍ਹਾਂ, ਸਟਾਕ ਮਾਰਕੀਟ ਵਿੱਚ ਨਿਵੇਸ਼ ਕਰਦੇ ਸਮੇਂ, ਬਹੁਤ ਸਾਰੇ ਲੋਕ ਗਲਤੀਆਂ ਕਰਦੇ ਹਨ. ਇਸ ਸੰਦਰਭ ਵਿੱਚ ਗਲਤੀ ਉਹਨਾਂ ਸ਼ੇਅਰਾਂ ਵਿੱਚ ਨਿਵੇਸ਼ ਕਰਨਾ ਹੈ ਜਿੱਥੇ ਤੁਹਾਡੇ ਕੋਲ ਮਾੜੇ ਸੌਦੇ ਹਨ। ਹਾਲਾਂਕਿ, ਸਭ ਤੋਂ ਮਹੱਤਵਪੂਰਨ ਹਿੱਸਾ ਤੁਹਾਡੇ ਪੋਰਟਫੋਲੀਓ ਨੂੰ ਮੁੜ ਸੰਤੁਲਿਤ ਕਰਕੇ ਗਲਤ ਨਿਵੇਸ਼ ਨੂੰ ਠੀਕ ਕਰਨਾ ਹੈ। ਸਮੇਂ ਸਿਰ ਤੁਹਾਡੇ ਇਕੁਇਟੀ ਨਿਵੇਸ਼ ਦੀ ਨਿਗਰਾਨੀ ਕਰਨਾ ਮਹੱਤਵਪੂਰਨ ਹੈ। ਇਹ ਇਹ ਪਛਾਣ ਕਰਨ ਵਿੱਚ ਮਦਦ ਕਰੇਗਾ ਕਿ ਕਿਹੜੇ ਸਟਾਕਾਂ ਨੂੰ ਵੇਚਣਾ ਹੈ ਅਤੇ ਕਿਹੜੇ ਨੂੰ ਬਰਕਰਾਰ ਰੱਖਣਾ ਹੈ। ਪੋਰਟਫੋਲੀਓ ਨੂੰ ਮੁੜ ਸੰਤੁਲਿਤ ਕਰਨਾ ਹਮੇਸ਼ਾ ਖਰਾਬ ਸਟਾਕਾਂ ਤੋਂ ਛੁਟਕਾਰਾ ਪਾਉਣ ਵਿੱਚ ਮਦਦ ਕਰਦਾ ਹੈ ਅਤੇ ਇਸ ਤਰ੍ਹਾਂ ਲੋਕ ਜ਼ਿਆਦਾ ਕਮਾਈ ਕਰ ਸਕਦੇ ਹਨਆਮਦਨ.
ਇਸ ਤਰ੍ਹਾਂ, ਉਪਰੋਕਤ ਪੁਆਇੰਟਰਾਂ ਤੋਂ, ਇਹ ਕਿਹਾ ਜਾ ਸਕਦਾ ਹੈ ਕਿ ਜਦੋਂ ਵੀ ਤੁਸੀਂ ਇਕੁਇਟੀ ਵਿੱਚ ਨਿਵੇਸ਼ ਕਰਨ ਦੀ ਚੋਣ ਕਰਦੇ ਹੋ, ਤਾਂ ਤੁਹਾਨੂੰ ਮਾਰਕੀਟ ਦੇ ਸਮੇਂ ਦੀ ਬਜਾਏ ਸ਼ੇਅਰ ਬਾਜ਼ਾਰਾਂ ਵਿੱਚ ਬਹੁਤ ਸਾਰਾ ਸਮਾਂ ਬਿਤਾਉਣ ਦੀ ਜ਼ਰੂਰਤ ਹੁੰਦੀ ਹੈ। ਨਾਲ ਹੀ, ਲੋਕਾਂ ਨੂੰ ਕੰਪਨੀ ਦੇ ਸ਼ੇਅਰਾਂ ਵਿੱਚ ਨਿਵੇਸ਼ ਕਰਨ ਤੋਂ ਪਹਿਲਾਂ ਹਮੇਸ਼ਾਂ ਸਮਝਣਾ ਚਾਹੀਦਾ ਹੈ ਤਾਂ ਜੋ ਉਨ੍ਹਾਂ ਦਾ ਨਿਵੇਸ਼ ਪੈਸਾ ਸੁਰੱਖਿਅਤ ਰਹੇ ਅਤੇ ਦੌਲਤ ਸਿਰਜਣ ਲਈ ਰਾਹ ਪੱਧਰਾ ਹੋ ਸਕੇ।
ਲੰਬੀ ਮਿਆਦ ਦੇ ਨਿਵੇਸ਼ਾਂ ਲਈ ਚੋਟੀ ਦੇ 10 ਇਕੁਇਟੀ ਮਿਉਚੁਅਲ ਫੰਡ
* ਲਈ ਸੰਪਤੀਆਂ ਦਾ ਪ੍ਰਬੰਧਨ ਕਰਨ ਵਾਲੇ ਚੋਟੀ ਦੇ ਫੰਡਾਂ ਦੀ ਸੂਚੀ5 ਸਾਲ ਉਪਰੋਕਤ ਵਿੱਚੋਂ ਅਤੇ ਸਭ ਤੋਂ ਵਧੀਆ ਸਾਲਾਨਾ ਰਿਟਰਨ (CAGR) ਵਾਪਸ ਕੀਤੇ ਹਨ।
(Erstwhile Sundaram Select Midcap Fund) To achieve capital appreciation by investing
in diversified stocks that are generally termed
as mid-caps. Below is the key information for Sundaram Mid Cap Fund Returns up to 1 year are on To generate long term capital appreciation from a portfolio that is predominantly in equity and equity related instruments Research Highlights for HDFC Long Term Advantage Fund Below is the key information for HDFC Long Term Advantage Fund Returns up to 1 year are on An Open-ended growth scheme with the objective of long term growth of capital, through a portfolio with a target allocation of 90% equity and 10% debt and money market securities. Research Highlights for Aditya Birla Sun Life Equity Fund Below is the key information for Aditya Birla Sun Life Equity Fund Returns up to 1 year are on An Open ended Growth Scheme with the objective to achieve long term growth of capital at controlled level of risk by investing primarily in ‘Mid-Cap’ Stocks. The level of risk is somewhat higher than a fund focused on large and liquid stocks. Concomitantly, the aim is to generate higher returns than a fund focused on large and liquid stocks. Research Highlights for Aditya Birla Sun Life Midcap Fund Below is the key information for Aditya Birla Sun Life Midcap Fund Returns up to 1 year are on (Erstwhile Motilal Oswal MOSt Focused Midcap 30 Fund) The investment objective of the Scheme is to achieve long term capital appreciation by investing in a maximum of 30 quality mid-cap companies having long-term competitive advantages and potential for growth. However, there can be no assurance or guarantee that the investment objective of the Scheme would be achieved. Research Highlights for Motilal Oswal Midcap 30 Fund Below is the key information for Motilal Oswal Midcap 30 Fund Returns up to 1 year are on The primary objective for Franklin IndiaTaxshield is to provide medium to long term growth of capital along with income tax rebate Research Highlights for Franklin India Taxshield Below is the key information for Franklin India Taxshield Returns up to 1 year are on The primary investment objective of the scheme is to seek to generate consistent returns by investing in equity and equity related or fixed income securities of Pharma and other associated companies. Research Highlights for Nippon India Pharma Fund Below is the key information for Nippon India Pharma Fund Returns up to 1 year are on The primary investment objective of the scheme is to generate long term capital appreciation by investing predominantly in equity and equity related instruments of small cap companies and the secondary objective is to generate consistent returns by investing in debt and money market securities. Research Highlights for Nippon India Small Cap Fund Below is the key information for Nippon India Small Cap Fund Returns up to 1 year are on The primary investment objective of the Scheme is to seek to generate continuous returns by actively investing in equity and equity related securities of
companies in the Banking Sector and companies engaged in allied activities related to Banking Sector. The AMC will have the discretion to completely or
partially invest in any of the type of securities stated above with a view to maximize the returns or on defensive considerations. However, there can be no
assurance that the investment objective of the Scheme will be realized, as actual market movements may be at variance with anticipated trends. Research Highlights for Nippon India Banking Fund Below is the key information for Nippon India Banking Fund Returns up to 1 year are on To generate returns through a combination of dividend income and capital appreciation by investing primarily in a well-diversified portfolio of value stocks. Value stocks are those, which have attractive valuations in relation to earnings or book value or current and/or future dividends. Research Highlights for ICICI Prudential Value Discovery Fund Below is the key information for ICICI Prudential Value Discovery Fund Returns up to 1 year are on 1. Sundaram Mid Cap Fund
Sundaram Mid Cap Fund
Growth Launch Date 30 Jul 02 NAV (21 Oct 26) ₹1,370.83 ↓ -15.77 (-1.14 %) Net Assets (Cr) ₹13,854 on 30 Sep 26 Category Equity - Mid Cap AMC Sundaram Asset Management Company Ltd Rating ☆☆☆☆ Risk Moderately High Expense Ratio 1.74 Sharpe Ratio -0.01 Information Ratio 0.52 Alpha Ratio -1.1 Min Investment 5,000 Min SIP Investment 100 Exit Load 0-12 Months (1%),12 Months and above(NIL) Growth of 10,000 investment over the years.
Date Value 30 Sep 21 ₹10,000 30 Sep 22 ₹10,517 30 Sep 23 ₹12,999 30 Sep 24 ₹20,296 30 Sep 25 ₹19,378 30 Sep 26 ₹20,063 Returns for Sundaram Mid Cap Fund
absolute basis & more than 1 year are on CAGR (Compound Annual Growth Rate) basis. as on 21 Oct 26 Duration Returns 1 Month -7.3% 3 Month -8.8% 6 Month -4.2% 1 Year -3.8% 3 Year 14.7% 5 Year 13.9% 10 Year 15 Year Since launch 22.5% Historical performance (Yearly) on absolute basis
Year Returns 2025 4.1% 2024 32% 2023 40.4% 2022 4.8% 2021 37.5% 2020 11.8% 2019 -0.3% 2018 -15.4% 2017 40.8% 2016 11.3% Fund Manager information for Sundaram Mid Cap Fund
Name Since Tenure S. Bharath 24 Feb 21 5.52 Yr. Shalav Saket 31 Dec 25 0.67 Yr. Data below for Sundaram Mid Cap Fund as on 30 Sep 26
Equity Sector Allocation
Sector Value Financial Services 23.8% Industrials 18.32% Consumer Cyclical 16.81% Health Care 9.76% Technology 9.14% Basic Materials 8.37% Consumer Defensive 3.26% Real Estate 2.8% Utility 1.93% Communication Services 1.35% Energy 1.16% Asset Allocation
Asset Class Value Cash 3.19% Equity 96.7% Debt 0.1% Other 0% Top Securities Holdings / Portfolio
Name Holding Value Quantity Mahindra & Mahindra Financial Services Ltd (Financial Services)
Equity, Since 31 Jan 24 | M&MFIN3% ₹436 Cr 11,700,000 Kalyan Jewellers India Ltd (Consumer Cyclical)
Equity, Since 31 Mar 21 | KALYANKJIL3% ₹388 Cr 6,450,835 Cummins India Ltd (Industrials)
Equity, Since 31 Dec 17 | 5004802% ₹369 Cr 722,000 The Federal Bank Ltd (Financial Services)
Equity, Since 31 Dec 18 | FEDERALBNK2% ₹367 Cr 10,300,000
↓ -662,188 Coforge Ltd (Technology)
Equity, Since 31 May 23 | COFORGE2% ₹334 Cr 1,680,000
↓ -25,000 Coromandel International Ltd (Basic Materials)
Equity, Since 30 Nov 10 | 5063952% ₹331 Cr 1,735,153 IDFC First Bank Ltd (Financial Services)
Equity, Since 30 Jun 25 | IDFCFIRSTB2% ₹329 Cr 38,278,844 GE Vernova T&D India Ltd (Industrials)
Equity, Since 30 Sep 24 | 5222752% ₹311 Cr 700,000 Max Financial Services Ltd (Financial Services)
Equity, Since 30 Jun 16 | 5002712% ₹284 Cr 1,805,000 IndusInd Bank Ltd (Financial Services)
Equity, Since 30 Nov 25 | INDUSINDBK2% ₹280 Cr 2,755,000
↑ 155,000 2. HDFC Long Term Advantage Fund
HDFC Long Term Advantage Fund
Growth Launch Date 2 Jan 01 NAV (14 Jan 22) ₹595.168 ↑ 0.28 (0.05 %) Net Assets (Cr) ₹1,318 on 30 Nov 21 Category Equity - ELSS AMC HDFC Asset Management Company Limited Rating ☆☆☆ Risk Moderately High Expense Ratio 2.25 Sharpe Ratio 2.27 Information Ratio -0.15 Alpha Ratio 1.75 Min Investment 500 Min SIP Investment 500 Exit Load NIL Growth of 10,000 investment over the years.
Date Value
Purchase not allowed Returns for HDFC Long Term Advantage Fund
absolute basis & more than 1 year are on CAGR (Compound Annual Growth Rate) basis. as on 21 Oct 26 Duration Returns 1 Month 4.4% 3 Month 1.2% 6 Month 15.4% 1 Year 35.5% 3 Year 20.6% 5 Year 17.4% 10 Year 15 Year Since launch 21.4% Historical performance (Yearly) on absolute basis
Year Returns 2025 2024 2023 2022 2021 2020 2019 2018 2017 2016 Fund Manager information for HDFC Long Term Advantage Fund
Name Since Tenure Data below for HDFC Long Term Advantage Fund as on 30 Nov 21
Equity Sector Allocation
Sector Value Asset Allocation
Asset Class Value Top Securities Holdings / Portfolio
Name Holding Value Quantity 3. Aditya Birla Sun Life Equity Fund
Aditya Birla Sun Life Equity Fund
Growth Launch Date 27 Aug 98 NAV (21 Oct 26) ₹1,855.85 ↓ -19.40 (-1.03 %) Net Assets (Cr) ₹27,982 on 30 Sep 26 Category Equity - Multi Cap AMC Birla Sun Life Asset Management Co Ltd Rating ☆☆☆☆ Risk Moderately High Expense Ratio 1.67 Sharpe Ratio 0.12 Information Ratio 1.49 Alpha Ratio 7.66 Min Investment 1,000 Min SIP Investment 100 Exit Load 0-365 Days (1%),365 Days and above(NIL) Growth of 10,000 investment over the years.
Date Value 30 Sep 21 ₹10,000 30 Sep 22 ₹9,415 30 Sep 23 ₹11,168 30 Sep 24 ₹15,764 30 Sep 25 ₹15,189 30 Sep 26 ₹16,129 Returns for Aditya Birla Sun Life Equity Fund
absolute basis & more than 1 year are on CAGR (Compound Annual Growth Rate) basis. as on 21 Oct 26 Duration Returns 1 Month -4% 3 Month -3.9% 6 Month -0.1% 1 Year -0.1% 3 Year 13% 5 Year 9.3% 10 Year 15 Year Since launch 20.4% Historical performance (Yearly) on absolute basis
Year Returns 2025 11.2% 2024 18.5% 2023 26% 2022 -1.1% 2021 30.3% 2020 16.1% 2019 8.5% 2018 -4.1% 2017 33.5% 2016 15.2% Fund Manager information for Aditya Birla Sun Life Equity Fund
Name Since Tenure Harish Krishnan 3 Nov 23 2.83 Yr. Dhaval Joshi 21 Nov 22 3.78 Yr. Data below for Aditya Birla Sun Life Equity Fund as on 30 Sep 26
Equity Sector Allocation
Sector Value Financial Services 29.79% Industrials 13.82% Consumer Cyclical 12.11% Basic Materials 11.33% Health Care 9.17% Technology 7.88% Consumer Defensive 7.39% Energy 3.58% Communication Services 1.85% Utility 1.1% Real Estate 0.42% Asset Allocation
Asset Class Value Cash 1.55% Equity 98.45% Top Securities Holdings / Portfolio
Name Holding Value Quantity ICICI Bank Ltd (Financial Services)
Equity, Since 30 Nov 16 | ICICIBANK6% ₹1,723 Cr 11,849,171 HDFC Bank Ltd (Financial Services)
Equity, Since 31 Jul 08 | HDFCBANK3% ₹998 Cr 14,082,465
↑ 2,082,465 Kotak Mahindra Bank Ltd (Financial Services)
Equity, Since 28 Feb 19 | KOTAKBANK3% ₹979 Cr 23,350,000 Reliance Industries Ltd (Energy)
Equity, Since 31 May 19 | RELIANCE3% ₹729 Cr 5,706,067 State Bank of India (Financial Services)
Equity, Since 28 Feb 21 | SBIN2% ₹647 Cr 6,105,500 Infosys Ltd (Technology)
Equity, Since 30 Apr 05 | INFY2% ₹642 Cr 5,662,517 Ather Energy Ltd (Consumer Cyclical)
Equity, Since 30 Apr 25 | ATHERENERG2% ₹601 Cr 3,500,000 Bharat Forge Ltd (Industrials)
Equity, Since 30 Jun 17 | 5004932% ₹589 Cr 2,800,000 Sona BLW Precision Forgings Ltd (Consumer Cyclical)
Equity, Since 30 Sep 24 | SONACOMS2% ₹545 Cr 6,700,000 HCL Technologies Ltd (Technology)
Equity, Since 30 Nov 11 | HCLTECH2% ₹538 Cr 4,103,703 4. Aditya Birla Sun Life Midcap Fund
Aditya Birla Sun Life Midcap Fund
Growth Launch Date 3 Oct 02 NAV (21 Oct 26) ₹784.28 ↓ -14.71 (-1.84 %) Net Assets (Cr) ₹6,550 on 30 Sep 26 Category Equity - Mid Cap AMC Birla Sun Life Asset Management Co Ltd Rating ☆☆☆ Risk Moderately High Expense Ratio 1.88 Sharpe Ratio 0.11 Information Ratio -0.23 Alpha Ratio 1.18 Min Investment 1,000 Min SIP Investment 1,000 Exit Load 0-365 Days (1%),365 Days and above(NIL) Growth of 10,000 investment over the years.
Date Value 30 Sep 21 ₹10,000 30 Sep 22 ₹10,098 30 Sep 23 ₹12,403 30 Sep 24 ₹18,315 30 Sep 25 ₹16,746 30 Sep 26 ₹17,712 Returns for Aditya Birla Sun Life Midcap Fund
absolute basis & more than 1 year are on CAGR (Compound Annual Growth Rate) basis. as on 21 Oct 26 Duration Returns 1 Month -6.9% 3 Month -7.4% 6 Month -2.1% 1 Year -1.6% 3 Year 11.7% 5 Year 10.6% 10 Year 15 Year Since launch 19.9% Historical performance (Yearly) on absolute basis
Year Returns 2025 4.4% 2024 22% 2023 39.9% 2022 -5.3% 2021 50.4% 2020 15.5% 2019 -3.7% 2018 -16% 2017 44.8% 2016 5.7% Fund Manager information for Aditya Birla Sun Life Midcap Fund
Name Since Tenure Vishal Gajwani 31 Oct 24 1.84 Yr. Data below for Aditya Birla Sun Life Midcap Fund as on 30 Sep 26
Equity Sector Allocation
Sector Value Financial Services 26.52% Industrials 18.73% Basic Materials 12.33% Consumer Cyclical 12.11% Health Care 11.36% Technology 7.39% Consumer Defensive 4.43% Real Estate 3.37% Utility 1.82% Asset Allocation
Asset Class Value Cash 1.37% Equity 98.62% Top Securities Holdings / Portfolio
Name Holding Value Quantity The Federal Bank Ltd (Financial Services)
Equity, Since 31 Mar 12 | FEDERALBNK3% ₹237 Cr 6,656,540
↓ -386,891 AU Small Finance Bank Ltd (Financial Services)
Equity, Since 30 Nov 19 | 5406113% ₹211 Cr 1,940,849 APL Apollo Tubes Ltd (Basic Materials)
Equity, Since 31 Aug 24 | APLAPOLLO3% ₹200 Cr 901,080 Billionbrains Garage Ventures Ltd (Financial Services)
Equity, Since 30 Nov 25 | GROWW3% ₹196 Cr 10,223,440 Max Financial Services Ltd (Financial Services)
Equity, Since 28 Feb 17 | 5002713% ₹181 Cr 1,151,200 Navin Fluorine International Ltd (Basic Materials)
Equity, Since 31 Jan 25 | NAVINFLUOR3% ₹177 Cr 204,519 JK Cement Ltd (Basic Materials)
Equity, Since 31 Jan 24 | JKCEMENT3% ₹176 Cr 342,940 Ajanta Pharma Ltd (Healthcare)
Equity, Since 31 Jul 24 | 5323312% ₹171 Cr 473,984 Thermax Ltd (Industrials)
Equity, Since 31 Oct 19 | THERMAX2% ₹169 Cr 434,194 PB Fintech Ltd (Financial Services)
Equity, Since 31 Oct 25 | POLICYBZR2% ₹166 Cr 885,592 5. Motilal Oswal Midcap 30 Fund
Motilal Oswal Midcap 30 Fund
Growth Launch Date 24 Feb 14 NAV (21 Oct 26) ₹96.9986 ↓ -1.47 (-1.50 %) Net Assets (Cr) ₹40,208 on 30 Sep 26 Category Equity - Mid Cap AMC Motilal Oswal Asset Management Co. Ltd Rating ☆☆☆ Risk Moderately High Expense Ratio 1.56 Sharpe Ratio -0.12 Information Ratio 0.24 Alpha Ratio -3.81 Min Investment 5,000 Min SIP Investment 500 Exit Load 0-1 Years (1%),1 Years and above(NIL) Growth of 10,000 investment over the years.
Date Value 30 Sep 21 ₹10,000 30 Sep 22 ₹12,302 30 Sep 23 ₹14,891 30 Sep 24 ₹25,582 30 Sep 25 ₹23,487 30 Sep 26 ₹23,526 Returns for Motilal Oswal Midcap 30 Fund
absolute basis & more than 1 year are on CAGR (Compound Annual Growth Rate) basis. as on 21 Oct 26 Duration Returns 1 Month -6.3% 3 Month -2.2% 6 Month 4% 1 Year -7.4% 3 Year 15.6% 5 Year 17.6% 10 Year 15 Year Since launch 19.7% Historical performance (Yearly) on absolute basis
Year Returns 2025 -12.1% 2024 57.1% 2023 41.7% 2022 10.7% 2021 55.8% 2020 9.3% 2019 9.7% 2018 -12.7% 2017 30.8% 2016 5.2% Fund Manager information for Motilal Oswal Midcap 30 Fund
Name Since Tenure Varun Sharma 21 Jan 26 0.61 Yr. Swapnil Mayekar 18 Nov 25 0.79 Yr. Ajay Khandelwal 1 Oct 24 1.92 Yr. Ankit Agarwal 21 Jan 26 0.61 Yr. Rakesh Shetty 22 Nov 22 3.78 Yr. Data below for Motilal Oswal Midcap 30 Fund as on 30 Sep 26
Equity Sector Allocation
Sector Value Technology 29.51% Financial Services 26.92% Consumer Cyclical 16.81% Industrials 13.61% Health Care 3.55% Real Estate 2.37% Communication Services 2.27% Energy 0.81% Consumer Defensive 0.52% Asset Allocation
Asset Class Value Cash 3.64% Equity 96.36% Top Securities Holdings / Portfolio
Name Holding Value Quantity One97 Communications Ltd (Technology)
Equity, Since 30 Sep 24 | PAYTM9% ₹3,886 Cr 22,630,476
↓ -1,470,000 Kalyan Jewellers India Ltd (Consumer Cyclical)
Equity, Since 29 Feb 24 | KALYANKJIL8% ₹3,486 Cr 58,000,000 Eternal Ltd (Consumer Cyclical)
Equity, Since 31 Aug 25 | ETERNAL6% ₹2,769 Cr 84,386,866 Coforge Ltd (Technology)
Equity, Since 31 Mar 23 | COFORGE6% ₹2,479 Cr 12,488,926
↓ -500,000 KEI Industries Ltd (Industrials)
Equity, Since 30 Nov 24 | KEI5% ₹2,210 Cr 3,850,000 Aditya Birla Capital Ltd (Financial Services)
Equity, Since 30 Jun 25 | ABCAPITAL5% ₹2,088 Cr 51,000,000
↓ -500,000 Persistent Systems Ltd (Technology)
Equity, Since 31 Jan 23 | PERSISTENT4% ₹1,888 Cr 3,375,000
↓ -50,000 Shriram Finance Ltd (Financial Services)
Equity, Since 31 Jan 26 | SHRIRAMFIN4% ₹1,568 Cr 14,128,296
↓ -200,000 Dixon Technologies (India) Ltd (Technology)
Equity, Since 31 Mar 23 | DIXON3% ₹1,474 Cr 992,735 Billionbrains Garage Ventures Ltd (Financial Services)
Equity, Since 31 Jan 26 | GROWW3% ₹1,471 Cr 76,595,094
↓ -7,500,000 6. Franklin India Taxshield
Franklin India Taxshield
Growth Launch Date 10 Apr 99 NAV (21 Oct 26) ₹1,342.41 ↓ -10.40 (-0.77 %) Net Assets (Cr) ₹5,839 on 30 Sep 26 Category Equity - ELSS AMC Franklin Templeton Asst Mgmt(IND)Pvt Ltd Rating ☆☆ Risk Moderately High Expense Ratio 1.81 Sharpe Ratio -0.64 Information Ratio -0.32 Alpha Ratio -5.27 Min Investment 500 Min SIP Investment 500 Exit Load NIL Growth of 10,000 investment over the years.
Date Value 30 Sep 21 ₹10,000 30 Sep 22 ₹10,149 30 Sep 23 ₹12,410 30 Sep 24 ₹17,999 30 Sep 25 ₹16,914 30 Sep 26 ₹15,877 Returns for Franklin India Taxshield
absolute basis & more than 1 year are on CAGR (Compound Annual Growth Rate) basis. as on 21 Oct 26 Duration Returns 1 Month -4.4% 3 Month -6.3% 6 Month -6.2% 1 Year -10.7% 3 Year 8.1% 5 Year 8.3% 10 Year 15 Year Since launch 19.5% Historical performance (Yearly) on absolute basis
Year Returns 2025 2.1% 2024 22.4% 2023 31.2% 2022 5.4% 2021 36.7% 2020 9.8% 2019 5.1% 2018 -3% 2017 29.1% 2016 4.7% Fund Manager information for Franklin India Taxshield
Name Since Tenure R. Janakiraman 2 May 16 10.34 Yr. Rajasa Kakulavarapu 1 Dec 23 2.75 Yr. Data below for Franklin India Taxshield as on 30 Sep 26
Equity Sector Allocation
Sector Value Financial Services 30.37% Industrials 17% Consumer Cyclical 9.93% Technology 7.85% Basic Materials 6.47% Health Care 5.62% Consumer Defensive 5.25% Energy 4.07% Utility 3.5% Communication Services 3.09% Real Estate 1.08% Asset Allocation
Asset Class Value Cash 5.76% Equity 94.24% Top Securities Holdings / Portfolio
Name Holding Value Quantity ICICI Bank Ltd (Financial Services)
Equity, Since 31 Oct 18 | ICICIBANK8% ₹480 Cr 3,297,903 HDFC Bank Ltd (Financial Services)
Equity, Since 31 Mar 07 | HDFCBANK6% ₹375 Cr 5,285,386
↓ -1,235,448 Axis Bank Ltd (Financial Services)
Equity, Since 30 Jun 14 | 5322155% ₹322 Cr 2,477,634 State Bank of India (Financial Services)
Equity, Since 31 Aug 15 | SBIN5% ₹300 Cr 2,833,344 Larsen & Toubro Ltd (Industrials)
Equity, Since 31 Dec 19 | LT5% ₹290 Cr 717,322 Eternal Ltd (Consumer Cyclical)
Equity, Since 30 Nov 21 | ETERNAL4% ₹246 Cr 7,499,624 Infosys Ltd (Technology)
Equity, Since 29 Feb 12 | INFY3% ₹217 Cr 1,911,441 Kotak Mahindra Bank Ltd (Financial Services)
Equity, Since 30 Nov 17 | KOTAKBANK3% ₹209 Cr 4,981,055 Mahindra & Mahindra Ltd (Consumer Cyclical)
Equity, Since 30 Jun 24 | M&M3% ₹198 Cr 601,937
↑ 45,000 Bharti Airtel Ltd (Communication Services)
Equity, Since 31 Jan 07 | BHARTIARTL3% ₹192 Cr 1,060,541 7. Nippon India Pharma Fund
Nippon India Pharma Fund
Growth Launch Date 5 Jun 04 NAV (21 Oct 26) ₹528.636 ↓ -2.49 (-0.47 %) Net Assets (Cr) ₹9,166 on 30 Sep 26 Category Equity - Sectoral AMC Nippon Life Asset Management Ltd. Rating ☆☆ Risk High Expense Ratio 1.81 Sharpe Ratio 0.57 Information Ratio -1.17 Alpha Ratio -2.12 Min Investment 5,000 Min SIP Investment 100 Exit Load 0-1 Years (1%),1 Years and above(NIL) Growth of 10,000 investment over the years.
Date Value 30 Sep 21 ₹10,000 30 Sep 22 ₹9,173 30 Sep 23 ₹11,457 30 Sep 24 ₹16,998 30 Sep 25 ₹16,124 30 Sep 26 ₹18,200 Returns for Nippon India Pharma Fund
absolute basis & more than 1 year are on CAGR (Compound Annual Growth Rate) basis. as on 21 Oct 26 Duration Returns 1 Month -8.4% 3 Month -7.1% 6 Month 4.8% 1 Year 2.3% 3 Year 15.1% 5 Year 11.8% 10 Year 15 Year Since launch 19.4% Historical performance (Yearly) on absolute basis
Year Returns 2025 -3.3% 2024 34% 2023 39.2% 2022 -9.9% 2021 23.9% 2020 66.4% 2019 1.7% 2018 3.6% 2017 7.6% 2016 -10.6% Fund Manager information for Nippon India Pharma Fund
Name Since Tenure Sailesh Raj Bhan 1 Apr 05 21.43 Yr. Kinjal Desai 25 May 18 8.28 Yr. Amber Singhania 11 Mar 26 0.48 Yr. Data below for Nippon India Pharma Fund as on 30 Sep 26
Equity Sector Allocation
Sector Value Health Care 98% Asset Allocation
Asset Class Value Cash 2% Equity 98% Top Securities Holdings / Portfolio
Name Holding Value Quantity Sun Pharmaceuticals Industries Ltd (Healthcare)
Equity, Since 31 Oct 09 | SUNPHARMA12% ₹1,172 Cr 5,906,349
↓ -300,000 Divi's Laboratories Ltd (Healthcare)
Equity, Since 31 Mar 12 | DIVISLAB7% ₹663 Cr 700,754
↓ -50,000 Lupin Ltd (Healthcare)
Equity, Since 31 Aug 08 | 5002576% ₹609 Cr 2,783,991 Cipla Ltd (Healthcare)
Equity, Since 31 May 08 | 5000876% ₹577 Cr 4,095,054
↑ 300,000 Apollo Hospitals Enterprise Ltd (Healthcare)
Equity, Since 30 Sep 20 | APOLLOHOSP5% ₹488 Cr 548,795 Dr Reddy's Laboratories Ltd (Healthcare)
Equity, Since 30 Jun 11 | DRREDDY5% ₹468 Cr 4,049,746 Mankind Pharma Ltd (Healthcare)
Equity, Since 30 Apr 23 | MANKIND4% ₹388 Cr 1,603,562
↑ 199,133 Sai Life Sciences Ltd (Healthcare)
Equity, Since 31 Dec 24 | SAILIFE4% ₹373 Cr 2,555,745 Ajanta Pharma Ltd (Healthcare)
Equity, Since 30 Apr 22 | 5323313% ₹329 Cr 913,918 GlaxoSmithKline Pharmaceuticals Ltd (Healthcare)
Equity, Since 31 Aug 22 | GLAXO3% ₹314 Cr 1,029,460
↑ 100,619 8. Nippon India Small Cap Fund
Nippon India Small Cap Fund
Growth Launch Date 16 Sep 10 NAV (21 Oct 26) ₹172.904 ↓ -3.96 (-2.24 %) Net Assets (Cr) ₹80,906 on 30 Sep 26 Category Equity - Small Cap AMC Nippon Life Asset Management Ltd. Rating ☆☆☆☆ Risk Moderately High Expense Ratio 1.41 Sharpe Ratio 0.25 Information Ratio -0.03 Alpha Ratio 1.8 Min Investment 5,000 Min SIP Investment 100 Exit Load 0-1 Years (1%),1 Years and above(NIL) Growth of 10,000 investment over the years.
Date Value 30 Sep 21 ₹10,000 30 Sep 22 ₹11,169 30 Sep 23 ₹15,121 30 Sep 24 ₹22,454 30 Sep 25 ₹20,439 30 Sep 26 ₹22,312 Returns for Nippon India Small Cap Fund
absolute basis & more than 1 year are on CAGR (Compound Annual Growth Rate) basis. as on 21 Oct 26 Duration Returns 1 Month -6.7% 3 Month -4.3% 6 Month 2.2% 1 Year 1.7% 3 Year 11.7% 5 Year 16.1% 10 Year 15 Year Since launch 19.4% Historical performance (Yearly) on absolute basis
Year Returns 2025 -4.7% 2024 26.1% 2023 48.9% 2022 6.5% 2021 74.3% 2020 29.2% 2019 -2.5% 2018 -16.7% 2017 63% 2016 5.6% Fund Manager information for Nippon India Small Cap Fund
Name Since Tenure Samir Rachh 2 Jan 17 9.67 Yr. Kinjal Desai 25 May 18 8.28 Yr. Amber Singhania 11 Mar 26 0.48 Yr. Data below for Nippon India Small Cap Fund as on 30 Sep 26
Equity Sector Allocation
Sector Value Industrials 23.06% Financial Services 16.23% Consumer Cyclical 15.15% Basic Materials 10.92% Health Care 9.29% Consumer Defensive 8.8% Technology 7.61% Utility 3.4% Communication Services 1.13% Energy 0.86% Real Estate 0.82% Asset Allocation
Asset Class Value Cash 2.73% Equity 97.27% Top Securities Holdings / Portfolio
Name Holding Value Quantity Bharat Heavy Electricals Ltd (Industrials)
Equity, Since 30 Sep 22 | 5001032% ₹1,528 Cr 34,508,595 TD Power Systems Ltd (Industrials)
Equity, Since 31 Dec 15 | TDPOWERSYS2% ₹1,500 Cr 19,307,704 Apar Industries Ltd (Industrials)
Equity, Since 31 Mar 17 | APARINDS2% ₹1,431 Cr 808,204
↓ -32,551 HDFC Bank Ltd (Financial Services)
Equity, Since 30 Apr 22 | HDFCBANK2% ₹1,415 Cr 19,954,929 Karur Vysya Bank Ltd (Financial Services)
Equity, Since 28 Feb 17 | 5900031% ₹1,109 Cr 31,907,252 State Bank of India (Financial Services)
Equity, Since 31 Oct 19 | SBIN1% ₹1,060 Cr 10,000,000 Sundaram Fasteners Ltd (Consumer Cyclical)
Equity, Since 30 Apr 24 | SUNDRMFAST1% ₹1,026 Cr 8,522,020
↑ 288,665 ACME Solar Holdings Ltd (Utilities)
Equity, Since 30 Nov 24 | ACMESOLAR1% ₹984 Cr 24,487,415 Sai Life Sciences Ltd (Healthcare)
Equity, Since 31 Dec 24 | SAILIFE1% ₹958 Cr 6,563,832 Multi Commodity Exchange of India Ltd (Financial Services)
Equity, Since 28 Feb 21 | MCX1% ₹952 Cr 2,800,000 9. Nippon India Banking Fund
Nippon India Banking Fund
Growth Launch Date 26 May 03 NAV (21 Oct 26) ₹602.709 ↓ -7.16 (-1.17 %) Net Assets (Cr) ₹7,367 on 30 Sep 26 Category Equity - Sectoral AMC Nippon Life Asset Management Ltd. Rating ☆☆☆ Risk High Expense Ratio 1.84 Sharpe Ratio -0.21 Information Ratio 0.17 Alpha Ratio 3.21 Min Investment 5,000 Min SIP Investment 100 Exit Load 0-1 Years (1%),1 Years and above(NIL) Growth of 10,000 investment over the years.
Date Value 30 Sep 21 ₹10,000 30 Sep 22 ₹10,526 30 Sep 23 ₹13,047 30 Sep 24 ₹16,815 30 Sep 25 ₹17,286 30 Sep 26 ₹17,067 Returns for Nippon India Banking Fund
absolute basis & more than 1 year are on CAGR (Compound Annual Growth Rate) basis. as on 21 Oct 26 Duration Returns 1 Month -5.7% 3 Month -7.5% 6 Month -7% 1 Year -7.2% 3 Year 9.3% 5 Year 9.9% 10 Year 15 Year Since launch 19.1% Historical performance (Yearly) on absolute basis
Year Returns 2025 17.4% 2024 10.3% 2023 24.2% 2022 20.7% 2021 29.7% 2020 -10.6% 2019 10.7% 2018 -1.2% 2017 44.1% 2016 11.5% Fund Manager information for Nippon India Banking Fund
Name Since Tenure Vinay Sharma 9 Apr 18 8.4 Yr. Kinjal Desai 25 May 18 8.28 Yr. Bhavik Dave 18 Jun 21 5.21 Yr. Amber Singhania 11 Mar 26 0.48 Yr. Data below for Nippon India Banking Fund as on 30 Sep 26
Equity Sector Allocation
Sector Value Financial Services 92.96% Technology 5.58% Asset Allocation
Asset Class Value Cash 1.46% Equity 98.54% Top Securities Holdings / Portfolio
Name Holding Value Quantity ICICI Bank Ltd (Financial Services)
Equity, Since 31 Oct 09 | ICICIBANK14% ₹1,074 Cr 7,388,887
↓ -150,000 HDFC Bank Ltd (Financial Services)
Equity, Since 31 Jul 08 | HDFCBANK12% ₹970 Cr 13,679,320 Axis Bank Ltd (Financial Services)
Equity, Since 30 Jun 17 | 5322159% ₹703 Cr 5,408,065 State Bank of India (Financial Services)
Equity, Since 31 Mar 14 | SBIN6% ₹452 Cr 4,265,352 Kotak Mahindra Bank Ltd (Financial Services)
Equity, Since 31 Jul 23 | KOTAKBANK4% ₹301 Cr 7,172,870 Bajaj Finserv Ltd (Financial Services)
Equity, Since 31 Oct 23 | 5329783% ₹258 Cr 1,275,773 SBI Cards and Payment Services Ltd Ordinary Shares (Financial Services)
Equity, Since 31 Jul 20 | SBICARD3% ₹251 Cr 3,893,792 IndusInd Bank Ltd (Financial Services)
Equity, Since 31 May 19 | INDUSINDBK3% ₹220 Cr 2,164,124 HDFC Asset Management Co Ltd (Financial Services)
Equity, Since 28 Feb 25 | HDFCAMC3% ₹201 Cr 766,488
↑ 100,000 Aye Finance Ltd (Financial Services)
Equity, Since 28 Feb 26 | AYE2% ₹195 Cr 10,854,762
↑ 1,450,000 10. ICICI Prudential Value Discovery Fund
ICICI Prudential Value Discovery Fund
Growth Launch Date 16 Aug 04 NAV (21 Oct 26) ₹439.8 ↓ -0.64 (-0.15 %) Net Assets (Cr) ₹57,250 on 30 Sep 26 Category Equity - Value AMC ICICI Prudential Asset Management Company Limited Rating ☆☆ Risk Moderately High Expense Ratio 1.5 Sharpe Ratio -0.78 Information Ratio 0.06 Alpha Ratio -6.84 Min Investment 1,000 Min SIP Investment 100 Exit Load 0-12 Months (1%),12 Months and above(NIL) Growth of 10,000 investment over the years.
Date Value 30 Sep 21 ₹10,000 30 Sep 22 ₹10,504 30 Sep 23 ₹13,427 30 Sep 24 ₹19,350 30 Sep 25 ₹19,070 30 Sep 26 ₹17,795 Returns for ICICI Prudential Value Discovery Fund
absolute basis & more than 1 year are on CAGR (Compound Annual Growth Rate) basis. as on 21 Oct 26 Duration Returns 1 Month -1.9% 3 Month -5% 6 Month -6.7% 1 Year -9.1% 3 Year 10.4% 5 Year 11.8% 10 Year 15 Year Since launch 18.6% Historical performance (Yearly) on absolute basis
Year Returns 2025 13.8% 2024 20% 2023 31.4% 2022 15% 2021 38.5% 2020 22.9% 2019 0.6% 2018 -4.2% 2017 23.8% 2016 4.6% Fund Manager information for ICICI Prudential Value Discovery Fund
Name Since Tenure Sankaran Naren 18 Jan 21 5.62 Yr. Dharmesh Kakkad 18 Jan 21 5.62 Yr. Sharmila D'Silva 30 Jun 22 4.18 Yr. Masoomi Jhurmarvala 4 Nov 24 1.82 Yr. Data below for ICICI Prudential Value Discovery Fund as on 30 Sep 26
Equity Sector Allocation
Sector Value Financial Services 40.56% Consumer Cyclical 9.8% Consumer Defensive 8.56% Health Care 8.49% Technology 8.01% Energy 7.59% Basic Materials 6.41% Communication Services 2.45% Utility 2.36% Industrials 2.34% Asset Allocation
Asset Class Value Cash 3.67% Equity 96.33% Top Securities Holdings / Portfolio
Name Holding Value Quantity ICICI Bank Ltd (Financial Services)
Equity, Since 28 Feb 21 | ICICIBANK9% ₹5,649 Cr 38,848,273
↓ -2,752,648 HDFC Bank Ltd (Financial Services)
Equity, Since 30 Jun 21 | HDFCBANK9% ₹5,236 Cr 73,851,397 Life Insurance Corporation of India (Financial Services)
Equity, Since 31 May 22 | LICI6% ₹3,536 Cr 84,585,693
↑ 66,302,335 Reliance Industries Ltd (Energy)
Equity, Since 31 Jan 23 | RELIANCE5% ₹3,066 Cr 24,007,674 Sun Pharmaceuticals Industries Ltd (Healthcare)
Equity, Since 31 May 16 | SUNPHARMA5% ₹2,733 Cr 13,769,894 Infosys Ltd (Technology)
Equity, Since 30 Sep 14 | INFY5% ₹2,710 Cr 23,906,059
↓ -232,313 ITC Ltd (Consumer Defensive)
Equity, Since 30 Sep 17 | ITC4% ₹2,513 Cr 98,371,855 Maruti Suzuki India Ltd (Consumer Cyclical)
Equity, Since 31 Dec 22 | MARUTI3% ₹2,050 Cr 1,513,196 Axis Bank Ltd (Financial Services)
Equity, Since 31 Aug 20 | 5322153% ₹1,780 Cr 13,691,763 Tata Consultancy Services Ltd (Technology)
Equity, Since 28 Feb 25 | TCS3% ₹1,728 Cr 7,201,306
ਇਹ ਯਕੀਨੀ ਬਣਾਉਣ ਲਈ ਸਾਰੇ ਯਤਨ ਕੀਤੇ ਗਏ ਹਨ ਕਿ ਇੱਥੇ ਦਿੱਤੀ ਗਈ ਜਾਣਕਾਰੀ ਸਹੀ ਹੈ। ਹਾਲਾਂਕਿ, ਡੇਟਾ ਦੀ ਸ਼ੁੱਧਤਾ ਬਾਰੇ ਕੋਈ ਗਾਰੰਟੀ ਨਹੀਂ ਦਿੱਤੀ ਗਈ ਹੈ। ਕਿਰਪਾ ਕਰਕੇ ਕੋਈ ਵੀ ਨਿਵੇਸ਼ ਕਰਨ ਤੋਂ ਪਹਿਲਾਂ ਸਕੀਮ ਜਾਣਕਾਰੀ ਦਸਤਾਵੇਜ਼ ਨਾਲ ਤਸਦੀਕ ਕਰੋ।









AMFI Registration No. 112358 | CIN: U74999MH2016PTC282153
Shepard Technologies Pvt. Ltd. (with ARN code 112358) makes no warranties or representations, express or implied, on products offered through the platform. It accepts no liability for any damages or losses, however caused, in connection with the use of, or on the reliance of its product or related services. Terms and conditions of the website are applicable.
©2026 Shepard Technologies Private Limited. All Rights Reserved
Research Highlights for Sundaram Mid Cap Fund