మ్యూచువల్ ఫండ్స్లో ఒకే మొత్తంలో పెట్టుబడి పెట్టడం వల్ల కలిగే ప్రయోజనాలు
ఏకమొత్త పెట్టుబడిని సూచిస్తుందిపెట్టుబడి పెడుతున్నారు మ్యూచువల్ ఫండ్ పథకంలో గణనీయమైన మొత్తం. ఏకమొత్తం పెట్టుబడిలో, డబ్బు వన్-టైమ్ డౌన్ పేమెంట్గా జమ చేయబడుతుంది. పెద్ద మొత్తంలో ఉన్న వ్యక్తులు మ్యూచువల్ ఫండ్లో గణనీయమైన నిష్పత్తిని డిపాజిట్ చేయవచ్చు. మొత్తం పెట్టుబడి విధానం సిస్టమాటిక్కు వ్యతిరేకంపెట్టుబడి ప్రణాళిక లేదాSIP మోడ్. స్థిరంగా గాని ఏకమొత్తంలో పెట్టుబడి పెట్టవచ్చుఆదాయం లేదాఈక్విటీ ఫండ్స్ వారి రిస్క్-ఆకలి, పెట్టుబడి పదవీకాలం మరియు పెట్టుబడి లక్ష్యం ఆధారంగా. చాలా మంది వ్యక్తులు ఇష్టపడతారుమ్యూచువల్ ఫండ్స్లో పెట్టుబడి పెట్టడం SIP ద్వారా ఇంకా, ఏకమొత్తంలో పెట్టుబడి పెట్టడం వల్ల కొన్ని ప్రయోజనాలు ఉన్నాయి. కాబట్టి, ఒకేసారి పెట్టుబడి పెట్టడం వల్ల కలిగే ప్రయోజనాలను మనం అర్థం చేసుకుందాంమ్యూచువల్ ఫండ్స్.
లంప్ సమ్ ఇన్వెస్టింగ్ యొక్క ప్రయోజనాలు
మ్యూచువల్ ఫండ్స్లో ఒకేసారి పెట్టుబడి పెట్టడం వల్ల కలిగే కొన్ని ప్రయోజనాలు క్రింది విధంగా ఉన్నాయి:
పెద్ద మొత్తంలో పెట్టుబడి
లంప్ సమ్ మోడ్ ఎంపిక ద్వారా, వ్యక్తులు మ్యూచువల్ ఫండ్లలో గణనీయమైన మొత్తాన్ని పెట్టుబడి పెట్టవచ్చు. పర్యవసానంగా, ఎప్పుడుసంత వృద్ధి కాలాన్ని చూపుతుంది, అప్పుడు పెట్టుబడి విలువ కూడా విలువతో పోలిస్తే చాలా వరకు పెరుగుతుందిSIP పెట్టుబడి.
దీర్ఘకాలిక పదవీకాలానికి అనువైనది
దీర్ఘకాలిక పెట్టుబడిని ఇష్టపడే వ్యక్తులకు ఏకమొత్తం పెట్టుబడి అనుకూలంగా ఉంటుంది. ఏకమొత్తం పెట్టుబడి విషయంలో దీర్ఘ-కాల పెట్టుబడిని సుమారుగా 10 సంవత్సరాలు లేదా అంతకంటే ఎక్కువ పెట్టుబడి కాలానికి పరిగణించవచ్చు. అయితే, ఏకమొత్తంలో పెట్టుబడి కోసంరుణ నిధి, వ్యక్తులు మీడియం-టర్మ్ పదవీకాలం కోసం పెట్టుబడి పెట్టడానికి కూడా ఎంచుకోవచ్చు.
సౌలభ్యం
పెద్ద మొత్తంలో ఉన్న వ్యక్తులు తమ పెట్టుబడులను విస్తరించవచ్చు కాబట్టి లంప్ సమ్ మోడ్ సాధారణంగా వ్యక్తులకు సౌకర్యవంతంగా ఉంటుంది. అయితే, పెట్టుబడిని SIP మోడ్ ద్వారా చేసినట్లయితే, వారు ఆ మొత్తాన్ని క్రమ వ్యవధిలో పెట్టుబడి పెట్టేలా జాగ్రత్త వహించాలి.
టైమింగ్ కోసం పెట్టుబడి పెట్టండి
పెట్టుబడిదారులు దీర్ఘకాలిక పెట్టుబడిని ఎంచుకున్నప్పుడు, వారు ఎల్లప్పుడూ మార్కెట్ టైమింగ్ కోసం వెతకాలి. మార్కెట్లు ఇప్పటికే తిరోగమనంలో ఉన్నప్పుడు మరియు వృద్ధి సామర్థ్యాలను చూపుతున్నప్పుడు వ్యక్తులు సాధారణంగా పెట్టుబడి పెట్టాలని ఎంచుకోవాలి. ఈ పరిస్థితిలో, వ్యక్తులు SIP మోడ్తో పోలిస్తే ఏకమొత్తం మోడ్ ద్వారా అధిక రాబడిని పొందవచ్చు. అయితే, మార్కెట్లు ఇప్పటికే గరిష్ట స్థాయికి చేరుకున్నప్పుడు ఏకమొత్తంలో పెట్టుబడి పెడితే, ఆ సందర్భంలో, వ్యక్తులు నష్టాలతో ముగియవచ్చు.

Talk to our investment specialist
2022లో అత్యుత్తమ పనితీరు కనబరుస్తున్న లంప్ సమ్ ఫండ్లు
ఏకమొత్తం పెట్టుబడి దీర్ఘకాలిక పదవీకాలం కోసం చేయబడుతుంది కాబట్టి, పర్యవసానంగా, మనం ప్రత్యేకంగా ఈక్విటీ కేటగిరీలో పెట్టుబడి పెట్టడాన్ని ఎంచుకోవచ్చులార్జ్ క్యాప్ ఫండ్స్. కాబట్టి, లంప్ సమ్ మోడ్ ద్వారా దీర్ఘకాలిక పెట్టుబడి కోసం ఎంచుకోగల కొన్ని ఉత్తమ పనితీరు గల లార్జ్ క్యాప్ మ్యూచువల్ ఫండ్ పథకాలను చూద్దాం.
Fund NAV Net Assets (Cr) Min Investment 3 MO (%) 6 MO (%) 1 YR (%) 3 YR (%) 5 YR (%) 2024 (%) IDBI India Top 100 Equity Fund Growth ₹44.16
↑ 0.05 ₹655 5,000 9.2 12.5 15.4 21.9 12.6 Invesco India Largecap Fund Growth ₹72.47
↑ 0.57 ₹1,847 5,000 7.5 5 5.9 13.5 12.1 5.5 JM Core 11 Fund Growth ₹20.2837
↑ 0.17 ₹286 5,000 6.5 6.1 4.7 12.9 14.1 -1.9 Bandhan Large Cap Fund Growth ₹78.741
↑ 0.25 ₹2,061 5,000 4.3 1.2 2.5 12.5 11.7 8.2 ICICI Prudential Bluechip Fund Growth ₹109.76
↑ 0.34 ₹79,421 5,000 2.9 -1.8 0 12.1 13.2 11.3 Note: Returns up to 1 year are on absolute basis & more than 1 year are on CAGR basis. as on 28 Jul 23 Research Highlights & Commentary of 5 Funds showcased
Commentary IDBI India Top 100 Equity Fund Invesco India Largecap Fund JM Core 11 Fund Bandhan Large Cap Fund ICICI Prudential Bluechip Fund Point 1 Bottom quartile AUM (₹655 Cr). Lower mid AUM (₹1,847 Cr). Bottom quartile AUM (₹286 Cr). Upper mid AUM (₹2,061 Cr). Highest AUM (₹79,421 Cr). Point 2 Established history (14+ yrs). Established history (16+ yrs). Established history (18+ yrs). Oldest track record among peers (20 yrs). Established history (18+ yrs). Point 3 Rating: 3★ (lower mid). Rating: 3★ (bottom quartile). Top rated. Rating: 2★ (bottom quartile). Rating: 4★ (upper mid). Point 4 Risk profile: Moderately High. Risk profile: Moderately High. Risk profile: High. Risk profile: Moderately High. Risk profile: Moderately High. Point 5 5Y return: 12.61% (lower mid). 5Y return: 12.12% (bottom quartile). 5Y return: 14.15% (top quartile). 5Y return: 11.66% (bottom quartile). 5Y return: 13.21% (upper mid). Point 6 3Y return: 21.88% (top quartile). 3Y return: 13.55% (upper mid). 3Y return: 12.88% (lower mid). 3Y return: 12.50% (bottom quartile). 3Y return: 12.13% (bottom quartile). Point 7 1Y return: 15.39% (top quartile). 1Y return: 5.93% (upper mid). 1Y return: 4.68% (lower mid). 1Y return: 2.51% (bottom quartile). 1Y return: -0.01% (bottom quartile). Point 8 Alpha: 2.11 (bottom quartile). Alpha: 3.75 (top quartile). Alpha: 2.17 (lower mid). Alpha: 2.34 (upper mid). Alpha: -1.21 (bottom quartile). Point 9 Sharpe: 1.09 (top quartile). Sharpe: -0.25 (lower mid). Sharpe: -0.23 (upper mid). Sharpe: -0.35 (bottom quartile). Sharpe: -0.55 (bottom quartile). Point 10 Information ratio: 0.14 (bottom quartile). Information ratio: 0.82 (upper mid). Information ratio: 0.15 (bottom quartile). Information ratio: 0.63 (lower mid). Information ratio: 0.85 (top quartile). IDBI India Top 100 Equity Fund
Invesco India Largecap Fund
JM Core 11 Fund
Bandhan Large Cap Fund
ICICI Prudential Bluechip Fund
లంప్ సమ్ పైన AUM/నికర ఆస్తులను కలిగి ఉన్న నిధులు100 కోట్లు. క్రమబద్ధీకరించబడిందిగత 3 సంవత్సరాల రిటర్న్.
The Investment objective of the Scheme is to provide investors with the opportunities for long-term capital appreciation by investing predominantly in Equity and Equity related Instruments of Large Cap companies. However
there can be no assurance that the investment objective under the Scheme will be realized. Below is the key information for IDBI India Top 100 Equity Fund Returns up to 1 year are on (Erstwhile Invesco India Business Leaders Fund) To generate long term capital appreciation by investing in equity and equity related instruments including equity derivatives of companies which in our opinion are leaders in their respective industry or industry segment. However, there is no assurance or guarantee that the investment objective of the Scheme will be achieved. The Scheme does not assure or guarantee any returns. Research Highlights for Invesco India Largecap Fund Below is the key information for Invesco India Largecap Fund Returns up to 1 year are on The investment objective of the Scheme is to provide long-term growth by investing predominantly in a concentrated portfolio of equity / equity related instruments of companies. Research Highlights for JM Core 11 Fund Below is the key information for JM Core 11 Fund Returns up to 1 year are on (Erstwhile IDFC Equity Fund) The investment objective of the scheme is to seek to generate
capital growth from a portfolio of predominantly equity and equity
related instruments (including Equity Derivatives). The scheme
may also invest in debt & money market instruments to generate
reasonable income. However there is no assurance or guarantee that the objectives of the scheme will be realized. Research Highlights for Bandhan Large Cap Fund Below is the key information for Bandhan Large Cap Fund Returns up to 1 year are on (Erstwhile ICICI Prudential Focused Bluechip Equity Fund) To generate long-term capital appreciation and income distribution to unit holders from a portfolio that is invested in equity and equity related securities of about 20 companies belonging to the large cap domain and the balance in debt securities and money market instruments. The Fund Manager will always select stocks for investment from among Top 200 stocks in terms of market capitalization on the National Stock Exchange of India Ltd. If the total assets under management under this scheme goes above Rs. 1,000 crores the Fund
Manager reserves the right to increase the number of companies to more than 20. Research Highlights for ICICI Prudential Bluechip Fund Below is the key information for ICICI Prudential Bluechip Fund Returns up to 1 year are on 1. IDBI India Top 100 Equity Fund
IDBI India Top 100 Equity Fund
Growth Launch Date 15 May 12 NAV (28 Jul 23) ₹44.16 ↑ 0.05 (0.11 %) Net Assets (Cr) ₹655 on 30 Jun 23 Category Equity - Large Cap AMC IDBI Asset Management Limited Rating ☆☆☆ Risk Moderately High Expense Ratio 2.47 Sharpe Ratio 1.09 Information Ratio 0.14 Alpha Ratio 2.11 Min Investment 5,000 Min SIP Investment 500 Exit Load 0-1 Years (1%),1 Years and above(NIL) Growth of 10,000 investment over the years.
Date Value Returns for IDBI India Top 100 Equity Fund
absolute basis & more than 1 year are on CAGR (Compound Annual Growth Rate) basis. as on 28 Jul 23 Duration Returns 1 Month 3% 3 Month 9.2% 6 Month 12.5% 1 Year 15.4% 3 Year 21.9% 5 Year 12.6% 10 Year 15 Year Since launch 14.2% Historical performance (Yearly) on absolute basis
Year Returns 2024 2023 2022 2021 2020 2019 2018 2017 2016 2015 Fund Manager information for IDBI India Top 100 Equity Fund
Name Since Tenure Data below for IDBI India Top 100 Equity Fund as on 30 Jun 23
Equity Sector Allocation
Sector Value Asset Allocation
Asset Class Value Top Securities Holdings / Portfolio
Name Holding Value Quantity 2. Invesco India Largecap Fund
Invesco India Largecap Fund
Growth Launch Date 21 Aug 09 NAV (31 Jul 26) ₹72.47 ↑ 0.57 (0.79 %) Net Assets (Cr) ₹1,847 on 30 Jun 26 Category Equity - Large Cap AMC Invesco Asset Management (India) Private Ltd Rating ☆☆☆ Risk Moderately High Expense Ratio 2.1 Sharpe Ratio -0.25 Information Ratio 0.82 Alpha Ratio 3.75 Min Investment 5,000 Min SIP Investment 100 Exit Load 0-1 Years (1%),1 Years and above(NIL) Growth of 10,000 investment over the years.
Date Value 31 Jul 21 ₹10,000 31 Jul 22 ₹10,413 31 Jul 23 ₹12,103 31 Jul 24 ₹16,763 31 Jul 25 ₹16,726 31 Jul 26 ₹17,719 Returns for Invesco India Largecap Fund
absolute basis & more than 1 year are on CAGR (Compound Annual Growth Rate) basis. as on 28 Jul 23 Duration Returns 1 Month 2.6% 3 Month 7.5% 6 Month 5% 1 Year 5.9% 3 Year 13.5% 5 Year 12.1% 10 Year 15 Year Since launch 12.4% Historical performance (Yearly) on absolute basis
Year Returns 2024 5.5% 2023 20% 2022 27.8% 2021 -3% 2020 32.5% 2019 14.1% 2018 10.5% 2017 -0.4% 2016 28.3% 2015 2.8% Fund Manager information for Invesco India Largecap Fund
Name Since Tenure Hiten Jain 1 Dec 23 2.58 Yr. Data below for Invesco India Largecap Fund as on 30 Jun 26
Equity Sector Allocation
Sector Value Financial Services 32.99% Industrials 20.35% Consumer Cyclical 14.78% Technology 10.22% Health Care 8.14% Basic Materials 6.02% Communication Services 3.35% Real Estate 2.12% Consumer Defensive 1.19% Utility 0.59% Asset Allocation
Asset Class Value Cash 0.25% Equity 99.75% Top Securities Holdings / Portfolio
Name Holding Value Quantity ICICI Bank Ltd (Financial Services)
Equity, Since 30 Sep 19 | ICICIBANK7% ₹122 Cr 969,443 ICICI Prudential Asset Management Co Ltd (Financial Services)
Equity, Since 31 Dec 25 | ICICIAMC6% ₹105 Cr 296,370 HDFC Bank Ltd (Financial Services)
Equity, Since 30 Sep 09 | HDFCBANK6% ₹103 Cr 1,384,844 Infosys Ltd (Technology)
Equity, Since 30 Apr 18 | INFY4% ₹75 Cr 646,679 Larsen & Toubro Ltd (Industrials)
Equity, Since 31 Oct 25 | LT4% ₹71 Cr 173,437 Bajaj Finance Ltd (Financial Services)
Equity, Since 28 Feb 25 | BAJFINANCE3% ₹61 Cr 671,135 Bharti Airtel Ltd (Communication Services)
Equity, Since 31 Dec 19 | BHARTIARTL3% ₹59 Cr 320,404 Eternal Ltd (Consumer Cyclical)
Equity, Since 31 Aug 23 | ETERNAL3% ₹58 Cr 2,302,684 Tech Mahindra Ltd (Technology)
Equity, Since 31 May 23 | TECHM3% ₹55 Cr 370,579 Axis Bank Ltd (Financial Services)
Equity, Since 31 Jan 26 | AXISBANK3% ₹52 Cr 406,975 3. JM Core 11 Fund
JM Core 11 Fund
Growth Launch Date 5 Mar 08 NAV (31 Jul 26) ₹20.2837 ↑ 0.17 (0.86 %) Net Assets (Cr) ₹286 on 30 Jun 26 Category Equity - Large Cap AMC JM Financial Asset Management Limited Rating ☆☆☆☆ Risk High Expense Ratio 2.38 Sharpe Ratio -0.23 Information Ratio 0.15 Alpha Ratio 2.17 Min Investment 5,000 Min SIP Investment 500 Exit Load 0-60 Days (1%),60 Days and above(NIL) Growth of 10,000 investment over the years.
Date Value 31 Jul 21 ₹10,000 31 Jul 22 ₹10,880 31 Jul 23 ₹13,474 31 Jul 24 ₹19,877 31 Jul 25 ₹18,512 31 Jul 26 ₹19,378 Returns for JM Core 11 Fund
absolute basis & more than 1 year are on CAGR (Compound Annual Growth Rate) basis. as on 28 Jul 23 Duration Returns 1 Month 2.5% 3 Month 6.5% 6 Month 6.1% 1 Year 4.7% 3 Year 12.9% 5 Year 14.1% 10 Year 15 Year Since launch 3.9% Historical performance (Yearly) on absolute basis
Year Returns 2024 -1.9% 2023 24.3% 2022 32.9% 2021 7.1% 2020 16.3% 2019 6.3% 2018 10.6% 2017 -5% 2016 43.1% 2015 11.1% Fund Manager information for JM Core 11 Fund
Name Since Tenure Satish Ramanathan 1 Oct 24 1.75 Yr. Asit Bhandarkar 25 Feb 09 17.36 Yr. Ruchi Fozdar 4 Oct 24 1.74 Yr. Deepak Gupta 11 Apr 25 1.22 Yr. Data below for JM Core 11 Fund as on 30 Jun 26
Equity Sector Allocation
Sector Value Financial Services 23.84% Consumer Cyclical 23.45% Industrials 17.21% Technology 14.07% Health Care 7.8% Basic Materials 6.35% Utility 3.2% Communication Services 2.95% Asset Allocation
Asset Class Value Cash 1.13% Equity 98.87% Top Securities Holdings / Portfolio
Name Holding Value Quantity Ujjivan Small Finance Bank Ltd Ordinary Shares (Financial Services)
Equity, Since 31 May 25 | 5429045% ₹15 Cr 2,671,722
↓ -130,000 Larsen & Toubro Ltd (Industrials)
Equity, Since 31 Oct 11 | LT5% ₹14 Cr 34,507
↓ -2,000 Amber Enterprises India Ltd Ordinary Shares (Consumer Cyclical)
Equity, Since 31 Mar 23 | AMBER5% ₹14 Cr 18,050 OneSource Specialty Pharma Ltd (Healthcare)
Equity, Since 31 Jan 25 | ONESOURCE4% ₹12 Cr 65,637 Bajaj Finance Ltd (Financial Services)
Equity, Since 31 Jan 25 | BAJFINANCE4% ₹12 Cr 131,500
↓ -8,000 One97 Communications Ltd (Technology)
Equity, Since 31 May 25 | PAYTM4% ₹12 Cr 105,000 Premier Energies Ltd (Technology)
Equity, Since 31 Mar 26 | PREMIERENE4% ₹12 Cr 110,000
↑ 10,000 Adani Ports & Special Economic Zone Ltd (Industrials)
Equity, Since 31 May 25 | ADANIPORTS4% ₹12 Cr 64,000 Eternal Ltd (Consumer Cyclical)
Equity, Since 30 Nov 23 | ETERNAL4% ₹12 Cr 460,000 IDFC First Bank Ltd (Financial Services)
Equity, Since 30 Apr 25 | IDFCFIRSTB4% ₹11 Cr 1,600,000 4. Bandhan Large Cap Fund
Bandhan Large Cap Fund
Growth Launch Date 9 Jun 06 NAV (31 Jul 26) ₹78.741 ↑ 0.25 (0.32 %) Net Assets (Cr) ₹2,061 on 30 Jun 26 Category Equity - Large Cap AMC IDFC Asset Management Company Limited Rating ☆☆ Risk Moderately High Expense Ratio 2.07 Sharpe Ratio -0.35 Information Ratio 0.63 Alpha Ratio 2.34 Min Investment 5,000 Min SIP Investment 100 Exit Load 0-365 Days (1%),365 Days and above(NIL) Growth of 10,000 investment over the years.
Date Value 31 Jul 21 ₹10,000 31 Jul 22 ₹10,690 31 Jul 23 ₹12,190 31 Jul 24 ₹16,673 31 Jul 25 ₹16,930 31 Jul 26 ₹17,355 Returns for Bandhan Large Cap Fund
absolute basis & more than 1 year are on CAGR (Compound Annual Growth Rate) basis. as on 28 Jul 23 Duration Returns 1 Month 3% 3 Month 4.3% 6 Month 1.2% 1 Year 2.5% 3 Year 12.5% 5 Year 11.7% 10 Year 15 Year Since launch 10.8% Historical performance (Yearly) on absolute basis
Year Returns 2024 8.2% 2023 18.7% 2022 26.8% 2021 -2.3% 2020 26.8% 2019 17.4% 2018 10.6% 2017 -4.2% 2016 34.2% 2015 5.3% Fund Manager information for Bandhan Large Cap Fund
Name Since Tenure Manish Gunwani 2 Dec 24 1.58 Yr. Prateek Poddar 2 Dec 24 1.58 Yr. Ritika Behera 7 Oct 23 2.73 Yr. Gaurav Satra 7 Jun 24 2.07 Yr. Data below for Bandhan Large Cap Fund as on 30 Jun 26
Equity Sector Allocation
Sector Value Financial Services 31.37% Consumer Cyclical 14.89% Technology 8.69% Basic Materials 7.9% Industrials 7.81% Health Care 7.05% Energy 6.25% Consumer Defensive 5.02% Utility 4.61% Communication Services 3.01% Real Estate 1.8% Asset Allocation
Asset Class Value Cash 0.43% Equity 99.57% Top Securities Holdings / Portfolio
Name Holding Value Quantity ICICI Bank Ltd (Financial Services)
Equity, Since 31 Oct 18 | ICICIBANK8% ₹168 Cr 1,338,506
↑ 83,326 HDFC Bank Ltd (Financial Services)
Equity, Since 28 Feb 07 | HDFCBANK7% ₹147 Cr 1,978,408
↑ 6,494 Reliance Industries Ltd (Energy)
Equity, Since 28 Feb 07 | RELIANCE6% ₹118 Cr 890,095
↓ -8,990 Infosys Ltd (Technology)
Equity, Since 31 Aug 11 | INFY4% ₹84 Cr 721,653
↓ -7,289 NTPC Ltd (Utilities)
Equity, Since 31 Dec 24 | NTPC4% ₹84 Cr 2,162,368
↑ 28,879 State Bank of India (Financial Services)
Equity, Since 31 Dec 24 | SBIN4% ₹74 Cr 768,824
↑ 29,946 Larsen & Toubro Ltd (Industrials)
Equity, Since 31 Jan 19 | LT3% ₹67 Cr 163,216
↓ -1,648 Bharti Airtel Ltd (Communication Services)
Equity, Since 30 Apr 24 | BHARTIARTL3% ₹60 Cr 329,763
↓ -3,330 Mahindra & Mahindra Ltd (Consumer Cyclical)
Equity, Since 30 Apr 24 | M&M3% ₹59 Cr 193,611
↑ 7,133 Sun Pharmaceuticals Industries Ltd (Healthcare)
Equity, Since 31 Aug 24 | SUNPHARMA3% ₹57 Cr 314,202
↓ -3,173 5. ICICI Prudential Bluechip Fund
ICICI Prudential Bluechip Fund
Growth Launch Date 23 May 08 NAV (31 Jul 26) ₹109.76 ↑ 0.34 (0.31 %) Net Assets (Cr) ₹79,421 on 30 Jun 26 Category Equity - Large Cap AMC ICICI Prudential Asset Management Company Limited Rating ☆☆☆☆ Risk Moderately High Expense Ratio 1.46 Sharpe Ratio -0.55 Information Ratio 0.85 Alpha Ratio -1.21 Min Investment 5,000 Min SIP Investment 100 Exit Load 0-1 Years (1%),1 Years and above(NIL) Growth of 10,000 investment over the years.
Date Value 31 Jul 21 ₹10,000 31 Jul 22 ₹11,027 31 Jul 23 ₹13,192 31 Jul 24 ₹18,392 31 Jul 25 ₹18,599 31 Jul 26 ₹18,597 Returns for ICICI Prudential Bluechip Fund
absolute basis & more than 1 year are on CAGR (Compound Annual Growth Rate) basis. as on 28 Jul 23 Duration Returns 1 Month 2% 3 Month 2.9% 6 Month -1.8% 1 Year 0% 3 Year 12.1% 5 Year 13.2% 10 Year 15 Year Since launch 14.1% Historical performance (Yearly) on absolute basis
Year Returns 2024 11.3% 2023 16.9% 2022 27.4% 2021 6.9% 2020 29.2% 2019 13.5% 2018 9.8% 2017 -0.8% 2016 32.7% 2015 7.7% Fund Manager information for ICICI Prudential Bluechip Fund
Name Since Tenure Sankaran Naren 5 Feb 26 0.4 Yr. Vaibhav Dusad 18 Jan 21 5.45 Yr. Sharmila D'Silva 31 Jul 22 3.92 Yr. Data below for ICICI Prudential Bluechip Fund as on 30 Jun 26
Equity Sector Allocation
Sector Value Financial Services 28.98% Consumer Cyclical 13.83% Industrials 11.11% Energy 7.43% Basic Materials 6.68% Consumer Defensive 5.84% Health Care 5.11% Communication Services 4.85% Technology 4.81% Utility 4.4% Real Estate 1.32% Asset Allocation
Asset Class Value Cash 5.23% Equity 94.77% Top Securities Holdings / Portfolio
Name Holding Value Quantity ICICI Bank Ltd (Financial Services)
Equity, Since 30 Jun 08 | ICICIBANK9% ₹6,650 Cr 52,926,976 HDFC Bank Ltd (Financial Services)
Equity, Since 31 Dec 10 | HDFCBANK8% ₹6,458 Cr 86,741,473 Reliance Industries Ltd (Energy)
Equity, Since 30 Jun 08 | RELIANCE5% ₹4,125 Cr 31,220,500
↑ 1,500,000 Larsen & Toubro Ltd (Industrials)
Equity, Since 31 Jan 12 | LT5% ₹4,107 Cr 10,075,656
↓ -594,718 Axis Bank Ltd (Financial Services)
Equity, Since 31 Mar 14 | AXISBANK5% ₹3,562 Cr 27,689,059
↑ 100,000 Bharti Airtel Ltd (Communication Services)
Equity, Since 31 Aug 09 | BHARTIARTL4% ₹3,311 Cr 18,104,129
↑ 337,869 Infosys Ltd (Technology)
Equity, Since 30 Nov 10 | INFY4% ₹2,747 Cr 23,662,450
↓ -1,575,000 Maruti Suzuki India Ltd (Consumer Cyclical)
Equity, Since 30 Apr 16 | MARUTI4% ₹2,712 Cr 2,065,675
↓ -79,950 UltraTech Cement Ltd (Basic Materials)
Equity, Since 30 Sep 17 | ULTRACEMCO3% ₹2,050 Cr 1,785,267
↓ -50,000 Sun Pharmaceuticals Industries Ltd (Healthcare)
Equity, Since 31 Jul 15 | SUNPHARMA3% ₹2,024 Cr 11,249,940
లంప్ సమ్ కాలిక్యులేటర్
లంప్ సమ్ కాలిక్యులేటర్ అనేది వ్యక్తులు తమ విలువ ఎంత ఉంటుందో అర్థం చేసుకోవడానికి సహాయపడే పరికరంమ్యూచువల్ ఫండ్స్లో మొత్తం మొత్తం పెట్టుబడి పెట్టుబడి వ్యవధి ముగింపులో. కాలిక్యులేటర్లో ఫీడ్ చేయాల్సిన ఇన్పుట్ డేటాలో ఏకమొత్త పెట్టుబడి కాలం, మొత్తం పెట్టుబడి మొత్తం, ఈక్విటీ మార్కెట్లలో దీర్ఘకాల వృద్ధి రేటు అంచనా, దీర్ఘకాలిక అంచనాద్రవ్యోల్బణం రేటు. కాబట్టి, ఒక మొత్తం కాలిక్యులేటర్ను ఎలా ఉపయోగించాలో అనే భావనను మనం అర్థం చేసుకుందాం.
మొత్తం మొత్తం పెట్టుబడి: INR 35,000
పెట్టుబడి కాలవ్యవధి: 20 సంవత్సరాల
దీర్ఘకాలిక వృద్ధి రేటు (సుమారుగా): 15%
దీర్ఘకాలిక ద్రవ్యోల్బణం రేటు (సుమారుగా): 4%
లంప్ సమ్ కాలిక్యులేటర్ ప్రకారం ఆశించిన రాబడులు: INR 2,82,181
పెట్టుబడిపై నికర లాభం: INR 2,47,181
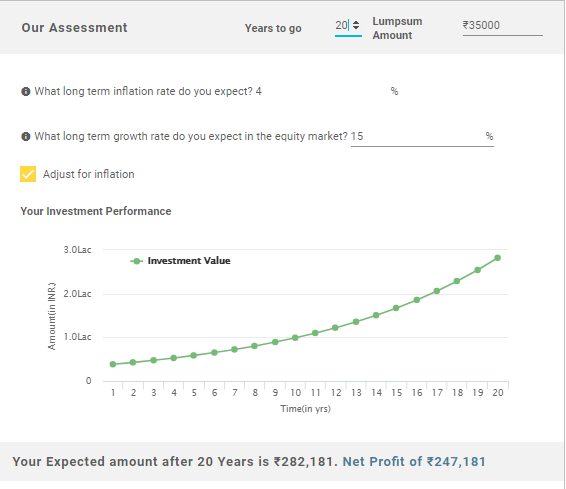
ఈ విధంగా, పై లెక్కింపు మీ పెట్టుబడిపై పెట్టుబడిపై నికర లాభం INR 2,47,181 అయితే మీ పెట్టుబడి మొత్తం విలువ INR 2,82,181 అని చూపిస్తుంది..
అందువల్ల, పై పాయింటర్ల నుండి, పెట్టుబడి యొక్క మొత్తం మోడ్ కూడా దాని ప్రయోజనాలను కలిగి ఉందని చెప్పవచ్చు. అయితే, వ్యక్తులు మొత్తం పెట్టుబడి విధానాన్ని ఎంచుకునేటప్పుడు జాగ్రత్తగా ఉండాలి. అలాంటి మోడ్ వారికి అనుకూలంగా ఉందో లేదో వారు తనిఖీ చేయాలి. వ్యక్తులు లంప్ సమ్ మోడ్తో చాలా సౌకర్యంగా లేకుంటే, వారు STP కోసం ఎంచుకోవచ్చు లేదాక్రమబద్ధమైన బదిలీ ప్రణాళిక దీనిలో వారు మొదట ఏకమొత్తంలో పెట్టుబడి పెట్టండి aలిక్విడ్ ఫండ్ ఆపై దానిని క్రమమైన వ్యవధిలో ఈక్విటీ ఫండ్కి క్రమపద్ధతిలో బదిలీ చేయండి.
ఇక్కడ అందించిన సమాచారం ఖచ్చితమైనదని నిర్ధారించడానికి అన్ని ప్రయత్నాలు చేయబడ్డాయి. అయినప్పటికీ, డేటా యొక్క ఖచ్చితత్వానికి సంబంధించి ఎటువంటి హామీలు ఇవ్వబడవు. దయచేసి ఏదైనా పెట్టుబడి పెట్టే ముందు పథకం సమాచార పత్రంతో ధృవీకరించండి.
AMFI Registration No. 112358 | CIN: U74999MH2016PTC282153
Shepard Technologies Pvt. Ltd. (with ARN code 112358) makes no warranties or representations, express or implied, on products offered through the platform. It accepts no liability for any damages or losses, however caused, in connection with the use of, or on the reliance of its product or related services. Terms and conditions of the website are applicable.
©2026 Shepard Technologies Private Limited. All Rights Reserved
Research Highlights for IDBI India Top 100 Equity Fund