మనీ మార్కెట్ మ్యూచువల్ ఫండ్స్
మనీ మార్కెట్ ఫండ్స్ అంటే ఏమిటి?
ఒక డబ్బుసంత ఫండ్ (MMF) అనేది ఒక రకమైన స్థిరమైనదిఆదాయం డెట్ సెక్యూరిటీలలో పెట్టుబడి పెట్టే మ్యూచువల్ ఫండ్. కానీ, మనం మనీ మార్కెట్ ఫండ్స్తో ప్రారంభించే ముందు, స్థిర ఆదాయ సాధనం అంటే ఏమిటో అర్థం చేసుకోవడం ముఖ్యం? బాగా, పేరు సూచించినట్లుగా, స్థిర ఆదాయ సాధనం అనేది ఒక నిర్దిష్ట వ్యవధిలో నిర్దిష్ట మొత్తంలో ఆదాయాన్ని ఉత్పత్తి చేస్తుంది. దిపెట్టుబడిదారుడు జారీచేసేవారు కలిగి ఉన్న ఆస్తులపై స్థిరమైన దావా ఇవ్వబడుతుంది, స్థిర ఆదాయ సాధనాలు తక్కువ-రిస్క్ మరియు తక్కువ-దిగుబడి పెట్టుబడులుగా పరిగణించబడతాయి.
ముఖ్యంగా, స్థిర ఆదాయ సాధనాలు మరేమీ కాదు, కానీ నిధులను అరువుగా తీసుకునే మార్గం (ఇక్కడ జారీ చేసినవారు రుణం తీసుకుంటారు).
స్థిర ఆదాయం Vs స్టాక్స్
బాగా స్టార్టర్స్ కోసం స్థిర ఆదాయం హోల్డర్కు ఆర్థిక హక్కులను ఇస్తుంది, ఇందులో వడ్డీ చెల్లింపులను స్వీకరించే హక్కు మరియు మొత్తం లేదా కొంత భాగాన్ని తిరిగి పొందే హక్కు ఉంటుంది.రాజధాని ఇచ్చిన తేదీలో పెట్టుబడి పెట్టారు. దీనికి విరుద్ధంగా, దివాటాదారు (స్టాక్ యజమాని) జారీచేసేవారి నుండి డివిడెండ్లను అందుకుంటారు, అయితే డివిడెండ్లను చెల్లించడానికి కంపెనీ ఏ చట్టానికి కట్టుబడి ఉండదు. అలాగే, మరొక ముఖ్యమైన వ్యత్యాసం ఏమిటంటే, స్థిర ఆదాయ హోల్డర్ సెక్యూరిటీని జారీ చేసే కంపెనీకి రుణదాత, అయితే వాటాదారు భాగస్వామి, క్యాపిటల్ స్టాక్లో కొంత భాగాన్ని కలిగి ఉంటారు. కంపెనీ పతనమైతే, రుణదాతలకు (బాండ్ హోల్డర్లు) వాటాదారుల (ఈక్విటీ హోల్డర్లు) కంటే ప్రాధాన్యత ఉంటుందని ఇక్కడ అర్థం చేసుకోవడం ముఖ్యం.
స్థిర ఆదాయ సాధనాల రకాలు
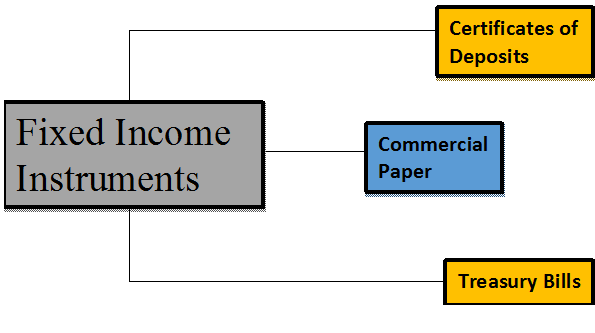
మనీ మార్కెట్ సాధనాల పరిధిలోకి వచ్చే వివిధ స్థిర ఆదాయ సాధనాలు ఉన్నాయి, వాటిలో కొన్నింటికి పేరు పెట్టడానికి:
డిపాజిట్ల సర్టిఫికెట్లు (CDలు)
టర్మ్ డిపాజిట్లు వంటి టైమ్ డిపాజిట్లు సాధారణంగా బ్యాంకులు (షెడ్యూల్డ్ కమర్షియల్ బ్యాంకులు) & ఆల్ ఇండియా ఫైనాన్షియల్ సంస్థల ద్వారా వినియోగదారులకు అందించబడతాయి. a లో టర్మ్ డిపాజిట్ మరియు దీనికి మధ్య వ్యత్యాసంబ్యాంక్ అంటే CDలను ఉపసంహరించుకోలేము.
కమర్షియల్ పేపర్ (CPs)
కమర్షియల్ పేపర్లను సాధారణంగా ప్రామిసరీ నోట్లుగా పిలుస్తారు, ఇవి అసురక్షితమైనవి మరియు సాధారణంగా కంపెనీలు మరియు ఆర్థిక సంస్థలచే వాటి నుండి తగ్గింపు రేటుతో జారీ చేయబడతాయి.ముఖ విలువ. కమర్షియల్ పేపర్ల స్థిర మెచ్యూరిటీ 1 నుండి 270 రోజులు. అవి జారీ చేయబడిన ప్రయోజనాల కోసం - ఇన్వెంటరీ ఫైనాన్సింగ్, ఖాతాల కోసంస్వీకరించదగినవి, మరియు స్వల్పకాలిక బాధ్యతలు లేదా రుణాలను పరిష్కరించడం.
Talk to our investment specialist
ట్రెజరీ బిల్లులు (టి-బిల్లులు)
ట్రెజరీ బిల్లులను 1917లో భారత ప్రభుత్వం మొదటిసారిగా జారీ చేసింది. ట్రెజరీ బిల్లులు దేశంలోని సెంట్రల్ బ్యాంక్ జారీ చేసే స్వల్పకాలిక ఆర్థిక సాధనాలు. పెట్టుబడులపై రాబడి అంత పెద్దది కానప్పటికీ (రిస్క్ సార్వభౌమాధికారం లేదా ఈ సందర్భంలో భారత ప్రభుత్వం కాబట్టి) మార్కెట్ రిస్క్లు లేని కారణంగా ఇది సురక్షితమైన మనీ మార్కెట్ సాధనాల్లో ఒకటి. ట్రెజరీ బిల్లులు ప్రాథమిక మరియు ద్వితీయ మార్కెట్ల ద్వారా పంపిణీ చేయబడతాయి. ట్రెజరీ బిల్లుల మెచ్యూరిటీ కాలాలు వరుసగా 3 నెలలు, 6 నెలలు మరియు 1 సంవత్సరం.
భారతీయ స్థిర ఆదాయ మార్కెట్లో కూడా తిరిగి కొనుగోలు ఒప్పందాలు (రెపోలు), అసెట్-బ్యాక్డ్ సెక్యూరిటీలు మొదలైన అనేక ఇతర స్థిర ఆదాయ సాధనాలు ఉన్నాయి, అయితే పైన పేర్కొన్నవి చాలా సాధారణమైనవి.
మనీ మార్కెట్ మ్యూచువల్ ఫండ్స్లో ఎందుకు పెట్టుబడి పెట్టాలి?
- మనీ మార్కెట్లోని సెక్యూరిటీలు సాపేక్షంగా తక్కువ రిస్క్ని కలిగి ఉంటాయి.
- మనీ మార్కెట్ ఫండ్లు అన్ని మ్యూచువల్ ఫండ్ పెట్టుబడులకు సురక్షితమైనవి మరియు సురక్షితమైనవిగా పరిగణించబడతాయి.
- మనీ మార్కెట్ నిధులను పరిగణనలోకి తీసుకుంటే, మనీ మార్కెట్ ఖాతాలో పెట్టుబడి పెట్టడం సులభం.పెట్టుబడి పెడుతున్నారు ద్వారామ్యూచువల్ ఫండ్స్ పెట్టుబడిదారులు తమ సౌలభ్యం మేరకు ఖాతా తెరవగలరు, డిపాజిట్లు మరియు ఉపసంహరణలు చేయవచ్చు.
- మనీ మార్కెట్ ఫండ్స్ అన్ని మ్యూచువల్ ఫండ్ ఇన్వెస్ట్మెంట్లలో అతి తక్కువ అస్థిర రకాల్లో ఒకటిగా పరిగణించబడతాయి.
- మనీ మార్కెట్ ఫండ్స్ పనితీరు భారతీయ రిజర్వ్ బ్యాంక్ నిర్ణయించిన వడ్డీ రేట్లతో ముడిపడి ఉంది.సెంట్రల్ బ్యాంక్ ఆఫ్ ఇండియా. కాబట్టి, RBI మార్కెట్లో రేట్లు పెంచినప్పుడు, దిగుబడి పెరుగుతుంది మరియు మనీ మార్కెట్ నిధులు మంచి రాబడిని ఇవ్వగలవు.
మనీ మార్కెట్ సాధనాలు & బాండ్లు: తేడా
బాండ్లు ఒక సంవత్సరం కంటే ఎక్కువ మెచ్యూరిటీ వ్యవధిని కలిగి ఉంటుంది, ఇది వాణిజ్య పత్రాలు, ట్రెజరీ బిల్లులు మరియు ఇతర మనీ మార్కెట్ సాధనాల వంటి ఇతర రుణ సెక్యూరిటీల నుండి భిన్నంగా ఉంటుంది, ఇవి సాధారణంగా ఒక సంవత్సరం కంటే తక్కువ మెచ్యూరిటీ వ్యవధిని కలిగి ఉంటాయి.
మనీ మార్కెట్ అంటే ఏమిటి?
మనీ మార్కెట్ సాధారణంగా ఆర్థిక మార్కెట్లోని ఒక విభాగాన్ని సూచిస్తుంది, ఇక్కడ చిన్న మెచ్యూరిటీలు (సంవత్సరం కంటే తక్కువ) మరియు ఎక్కువ ఉన్న ఆర్థిక సాధనాలు.ద్రవ్యత వర్తకం చేస్తారు. భారతదేశంలో చాలా చురుకైన ద్రవ్య మార్కెట్ ఉంది, ఇక్కడ అనేక సాధనాలు వర్తకం చేయబడతాయి. ఇక్కడ మీరు మ్యూచువల్ ఫండ్ కంపెనీలు, ప్రభుత్వ బ్యాంకులు మరియు అనేక ఇతర పెద్ద దేశీయ సంస్థలు పాల్గొంటాయి. వాణిజ్య పత్రాలు మరియు ట్రెజరీ బిల్లులు వంటి స్వల్పకాలిక సెక్యూరిటీల కొనుగోలు మరియు అమ్మకం కోసం ద్రవ్య మార్కెట్ ఆర్థిక మార్కెట్లో ఒక భాగం అయింది.
మనీ మార్కెట్ రేట్లు
మనీ మార్కెట్ రేట్లు స్వల్పకాలిక మనీ మార్కెట్ సాధనాలు అందించే వడ్డీ రేట్లు. ఈ సాధనాల పరిపక్వత 1 రోజు నుండి ఒక సంవత్సరం వరకు ఉంటుంది. ట్రెజరీ బిల్లులు వంటి అనేక సంక్లిష్ట సాధనాలపై ద్రవ్య మార్కెట్ రేట్లు మారుతూ ఉంటాయి,కాల్ చేయండి డబ్బు,కమర్షియల్ పేపర్ (CP), డిపాజిట్ల సర్టిఫికేట్లు (CDలు), రెపోలు మొదలైనవి. భారతీయ రిజర్వ్ బ్యాంక్ (RBI) ఎక్కువగా ద్రవ్య మార్కెట్లపై అధికారాన్ని కలిగి ఉంటుంది.
28 ఫిబ్రవరి 2017 నాటికి RBI సైట్లో ఇచ్చిన వివిధ సాధనాల ద్రవ్య మార్కెట్ రేట్ల ఉదాహరణ సూచన కోసం దిగువన ఉంది.
| వాల్యూమ్ (ఒక కాలు) | వెయిటెడ్ సగటు రేటు | పరిధి | |
|---|---|---|---|
| ఎ. ఓవర్నైట్ సెగ్మెంట్ (I+II+III+IV) | 4,00,659.36 | 3.25 | 0.01-5.30 |
| I. కాల్ మనీ | 12,671.70 | 3.23 | 1.90-3.50 |
| II. త్రిపార్టీ రేపో | 2,79,349.70 | 3.26 | 2.00-3.45 |
| III. మార్కెట్ రెపో | 1,07,582.96 | 3.25 | 0.01-3.50 |
| IV. కార్పొరేట్ బాండ్లో రెపో | 1,055.00 | 3.56 | 3.40-5.30 |
| బి. టర్మ్ సెగ్మెంట్ | |||
| I. నోటీసు డబ్బు** | 45.00 | 2.97 | 2.65-3.50 |
| II. టర్మ్ మనీ@@ | 311.00 | - | 3.15-3.45 |
| III. త్రిపార్టీ రేపో | 1,493.00 | 3.30 | 3.30-3.35 |
| IV. మార్కెట్ రెపో | 5,969.10 | 3.37 | 0.01-3.60 |
| కార్పొరేట్ బాండ్లో వి. రేపో | 0.00 | - | - |
మూలం: మనీ మార్కెట్ కార్యకలాపాలు, RBI తేదీ- తేదీ: 30 మార్చి 2021
మనీ మార్కెట్ ఫండ్లను అందిస్తున్న మ్యూచువల్ ఫండ్ కంపెనీలు
పైన పేర్కొన్న వివిధ రకాల సాధనాల గురించి మనం తెలుసుకున్నట్లుగా, మనీ మార్కెట్ ఫండ్స్లో పెట్టుబడిదారుడు ఎలా పెట్టుబడి పెట్టవచ్చో తెలుసుకోవడం కూడా అంతే ముఖ్యం. 44 ఉన్నాయిAMCలు (అసెట్ మేనేజ్మెంట్ కంపెనీలు) భారతదేశంలో, వాటిలో చాలా వరకు ఉన్నాయిసమర్పణ మనీ మార్కెట్ ఫండ్స్ (ప్రధానంగాలిక్విడ్ ఫండ్స్ మరియు పెట్టుబడిదారుల కోసం అల్ట్రా-షార్ట్ ఫండ్స్). పెట్టుబడిదారులు బ్యాంకులు మరియు బ్రోకర్లు వంటి పంపిణీదారుల ద్వారా కూడా పెట్టుబడి పెట్టవచ్చు. మనీ మార్కెట్ ఫండ్స్లో ఇన్వెస్ట్ చేయడానికి సంబంధిత విధానాన్ని మరియు సంబంధిత అప్లికేషన్లను అనుసరించడం అవసరం. డెట్ మ్యూచువల్ ఫండ్స్ యొక్క నిబంధనలు & షరతులు మారవచ్చు, కాబట్టి, మొత్తం జ్ఞానాన్ని పొందడం మరియు మీ అవసరాలకు తగినదాన్ని ఎంచుకోవడం చాలా ముఖ్యం. అంతేకాకుండా, ఏదైనా మనీ మార్కెట్ మ్యూచువల్ ఫండ్స్లో పెట్టుబడి పెట్టే ముందు దాని పెట్టుబడి లక్ష్యాలు, నష్టాలు, రాబడి మరియు ఖర్చులను జాగ్రత్తగా పరిశీలించండి.
పరిగణించవలసిన అంశాలు
భారతదేశంలో మనీ మార్కెట్ ఫండ్స్లో పెట్టుబడి పెట్టే ముందు మీరు తప్పనిసరిగా పరిగణించవలసిన కొన్ని ముఖ్యమైన అంశాలు ఇక్కడ ఉన్నాయి:
a. ప్రమాదాలు మరియు రాబడి
మనీ మార్కెట్ ఫండ్స్రుణ నిధి అందువల్ల వడ్డీ రేటు రిస్క్ మరియు క్రెడిట్ రిస్క్ వంటి డెట్ ఫండ్లకు వర్తించే అన్ని నష్టాలను తీసుకువెళ్లండి. అదనంగా, ఫండ్ మేనేజర్ రాబడిని పెంచడానికి కొంచెం ఎక్కువ రిస్క్ కాంపోనెంట్తో ఇన్స్ట్రుమెంట్స్లో ఇన్వెస్ట్ చేయవచ్చు. సాధారణంగా, మనీ మార్కెట్ ఫండ్స్ రెగ్యులర్ కంటే మెరుగైన రాబడిని అందిస్తాయిపొదుపు ఖాతా. నికర ఆస్తి విలువ లేదాకాదు వడ్డీ రేటు విధానంలో మార్పుతో ఈ ఫండ్స్ మారుతాయి.
బి. ఖర్చు నిష్పత్తి
రాబడి చాలా ఎక్కువగా లేనందున, ఖర్చు నిష్పత్తి మీని నిర్ణయించడంలో ముఖ్యమైన పాత్ర పోషిస్తుందిసంపాదన మనీ మార్కెట్ ఫండ్ నుండి. ఖర్చు నిష్పత్తి అనేది ఫండ్ నిర్వహణ సేవలకు సంబంధించి ఫండ్ హౌస్ ద్వారా వసూలు చేయబడిన ఫండ్ యొక్క మొత్తం ఆస్తులలో ఒక చిన్న శాతం.
ఆదర్శవంతంగా, మీరు మీ రాబడిని పెంచుకోవడానికి తక్కువ వ్యయ నిష్పత్తితో నిధుల కోసం వెతకాలి.
సి. మీ పెట్టుబడి ప్రణాళిక ప్రకారం పెట్టుబడి పెట్టండి
సాధారణంగా, మనీ మార్కెట్ నిధులు 90-365 రోజుల పెట్టుబడి హోరిజోన్తో పెట్టుబడిదారులకు సిఫార్సు చేయబడతాయి. ఈ పథకాలు మీ పోర్ట్ఫోలియోను వైవిధ్యపరచడంలో మీకు సహాయపడతాయి మరియు లిక్విడిటీని కొనసాగించేటప్పుడు మిగులు నగదును పెట్టుబడి పెట్టడంలో సహాయపడతాయి. మీరు మీ ప్రకారం పెట్టుబడి పెట్టారని నిర్ధారించుకోండిపెట్టుబడి ప్రణాళిక.
డి. పన్ను విధింపు
మనీ మార్కెట్ ఫండ్స్ విషయంలో, పన్ను నియమాలు క్రింది విధంగా ఉన్నాయి:
క్యాపిటల్ గెయిన్స్ ట్యాక్స్
మీరు స్కీమ్ యొక్క యూనిట్లను మూడేళ్ల వరకు కలిగి ఉంటే, అప్పుడు దిమూలధన లాభాలు మీరు సంపాదించిన వాటిని స్వల్పకాలిక మూలధన లాభాలు లేదా STCG అంటారు. STCG మీకు జోడించబడిందిపన్ను పరిధిలోకి వచ్చే ఆదాయం మరియు వర్తించే విధంగా పన్ను విధించబడుతుందిఆదాయ పన్ను పలక.
మీరు మూడు సంవత్సరాల కంటే ఎక్కువ కాలం పాటు పథకం యొక్క యూనిట్లను కలిగి ఉన్నట్లయితే, మీరు సంపాదించిన మూలధన లాభాలను దీర్ఘకాలిక మూలధన లాభాలు లేదా LTCG అంటారు. ఇండెక్సేషన్ ప్రయోజనాలతో దీనికి 20% పన్ను విధించబడుతుంది.
FY 22 - 23లో పెట్టుబడి పెట్టడానికి ఉత్తమ మనీ మార్కెట్ ఫండ్లు
భారతదేశంలోని కొన్ని ఉత్తమ మనీ మార్కెట్ ఫండ్లు క్రింది విధంగా ఉన్నాయి-Fund NAV Net Assets (Cr) 3 MO (%) 6 MO (%) 1 YR (%) 3 YR (%) 2025 (%) Debt Yield (YTM) Mod. Duration Eff. Maturity UTI Money Market Fund Growth ₹3,303.01
↑ 1.20 ₹17,557 1.8 3.4 6.2 7.3 7.5 7.58% 6M 20D 6M 20D Tata Money Market Fund Growth ₹5,055.78
↑ 1.69 ₹32,150 1.8 3.4 6.2 7.3 7.4 7.79% 7M 1D 7M 1D Aditya Birla Sun Life Money Manager Fund Growth ₹396.157
↑ 0.14 ₹27,383 1.8 3.4 6.2 7.3 7.4 6.95% 6M 25D 6M 29D Kotak Money Market Scheme Growth ₹4,807.74
↑ 1.76 ₹28,762 1.8 3.4 6.2 7.2 7.4 7.71% 7M 6D 7M 6D Franklin India Savings Fund Growth ₹53.704
↑ 0.02 ₹3,920 1.8 3.3 6.2 7.2 7.4 7.76% 4M 28D 6M 25D Note: Returns up to 1 year are on absolute basis & more than 1 year are on CAGR basis. as on 31 Jul 26 Research Highlights & Commentary of 5 Funds showcased
Commentary UTI Money Market Fund Tata Money Market Fund Aditya Birla Sun Life Money Manager Fund Kotak Money Market Scheme Franklin India Savings Fund Point 1 Bottom quartile AUM (₹17,557 Cr). Highest AUM (₹32,150 Cr). Lower mid AUM (₹27,383 Cr). Upper mid AUM (₹28,762 Cr). Bottom quartile AUM (₹3,920 Cr). Point 2 Established history (17+ yrs). Established history (23+ yrs). Established history (20+ yrs). Established history (23+ yrs). Oldest track record among peers (24 yrs). Point 3 Rating: 4★ (upper mid). Rating: 3★ (bottom quartile). Top rated. Rating: 4★ (lower mid). Rating: 3★ (bottom quartile). Point 4 Risk profile: Low. Risk profile: Low. Risk profile: Low. Risk profile: Low. Risk profile: Moderately Low. Point 5 1Y return: 6.24% (top quartile). 1Y return: 6.21% (upper mid). 1Y return: 6.21% (lower mid). 1Y return: 6.20% (bottom quartile). 1Y return: 6.18% (bottom quartile). Point 6 1M return: 0.49% (bottom quartile). 1M return: 0.49% (lower mid). 1M return: 0.50% (upper mid). 1M return: 0.49% (bottom quartile). 1M return: 0.50% (top quartile). Point 7 Sharpe: 0.81 (upper mid). Sharpe: 0.82 (top quartile). Sharpe: 0.69 (bottom quartile). Sharpe: 0.75 (bottom quartile). Sharpe: 0.76 (lower mid). Point 8 Information ratio: 0.00 (top quartile). Information ratio: 0.00 (upper mid). Information ratio: 0.00 (lower mid). Information ratio: 0.00 (bottom quartile). Information ratio: 0.00 (bottom quartile). Point 9 Yield to maturity (debt): 7.58% (bottom quartile). Yield to maturity (debt): 7.79% (top quartile). Yield to maturity (debt): 6.95% (bottom quartile). Yield to maturity (debt): 7.71% (lower mid). Yield to maturity (debt): 7.76% (upper mid). Point 10 Modified duration: 0.56 yrs (upper mid). Modified duration: 0.59 yrs (bottom quartile). Modified duration: 0.57 yrs (lower mid). Modified duration: 0.60 yrs (bottom quartile). Modified duration: 0.41 yrs (top quartile). UTI Money Market Fund
Tata Money Market Fund
Aditya Birla Sun Life Money Manager Fund
Kotak Money Market Scheme
Franklin India Savings Fund
To provide highest possible current income consistent with preservation of capital and providing liquidity from investing in a diversified portfolio of short term money market securities. Below is the key information for UTI Money Market Fund Returns up to 1 year are on (Erstwhile Tata Liquid Fund) To create a highly liquid portfolio of good quality debt as well as money market instruments so as to provide reasonable returns and high liquidity to the unitholders. Research Highlights for Tata Money Market Fund Below is the key information for Tata Money Market Fund Returns up to 1 year are on (Erstwhile Aditya Birla Sun Life Floating Rate Fund - Short Term) The primary objective of the schemes is to generate regular income through investment in a portfolio comprising substantially of floating rate debt / money market instruments. The schemes may invest a portion of its net assets in fixed rate debt securities and money market instruments. Research Highlights for Aditya Birla Sun Life Money Manager Fund Below is the key information for Aditya Birla Sun Life Money Manager Fund Returns up to 1 year are on (Erstwhile Kotak Floater Short Term Fund) To reduce the interest rate risk associated with investments in fixed rate instruments by investing predominantly in floating rate securities, money market instruments and using appropriate derivatives. Research Highlights for Kotak Money Market Scheme Below is the key information for Kotak Money Market Scheme Returns up to 1 year are on (Erstwhile Franklin India Savings Plus Fund Retail Option) Aims to provide income consistent with the prudent risk from a portfolio comprising substantially of floating rate debt instruments, fixed rate debt instruments swapped for floating rate returns, and also fixed rate instruments and money market instruments. Research Highlights for Franklin India Savings Fund Below is the key information for Franklin India Savings Fund Returns up to 1 year are on 1. UTI Money Market Fund
UTI Money Market Fund
Growth Launch Date 13 Jul 09 NAV (31 Jul 26) ₹3,303.01 ↑ 1.20 (0.04 %) Net Assets (Cr) ₹17,557 on 30 Jun 26 Category Debt - Money Market AMC UTI Asset Management Company Ltd Rating ☆☆☆☆ Risk Low Expense Ratio 0.25 Sharpe Ratio 0.81 Information Ratio 0 Alpha Ratio 0 Min Investment 10,000 Min SIP Investment 500 Exit Load NIL Yield to Maturity 7.58% Effective Maturity 6 Months 20 Days Modified Duration 6 Months 20 Days Growth of 10,000 investment over the years.
Date Value 31 Jul 21 ₹10,000 31 Jul 22 ₹10,385 31 Jul 23 ₹11,121 31 Jul 24 ₹11,962 31 Jul 25 ₹12,929 31 Jul 26 ₹13,736 Returns for UTI Money Market Fund
absolute basis & more than 1 year are on CAGR (Compound Annual Growth Rate) basis. as on 31 Jul 26 Duration Returns 1 Month 0.5% 3 Month 1.8% 6 Month 3.4% 1 Year 6.2% 3 Year 7.3% 5 Year 6.6% 10 Year 15 Year Since launch 7.3% Historical performance (Yearly) on absolute basis
Year Returns 2025 7.5% 2024 7.7% 2023 7.4% 2022 4.9% 2021 3.7% 2020 6% 2019 8% 2018 7.8% 2017 6.7% 2016 7.7% Fund Manager information for UTI Money Market Fund
Name Since Tenure Anurag Mittal 1 Dec 21 4.58 Yr. Amit Sharma 7 Jul 17 8.99 Yr. Data below for UTI Money Market Fund as on 30 Jun 26
Asset Allocation
Asset Class Value Cash 86.17% Debt 13.52% Other 0.31% Debt Sector Allocation
Sector Value Corporate 46.48% Cash Equivalent 35.25% Government 17.97% Credit Quality
Rating Value AAA 100% Top Securities Holdings / Portfolio
Name Holding Value Quantity India (Republic of)
- | -4% ₹654 Cr 6,629,850,000 Indusind Bank Ltd.
Debentures | -2% ₹338 Cr 3,500,000,000
↑ 3,500,000,000 Tbill
Sovereign Bonds | -2% ₹297 Cr 3,000,000,000 Tbill
Sovereign Bonds | -2% ₹296 Cr 3,000,000,000 5.74% Govt Stock 2026
Sovereign Bonds | -2% ₹280 Cr 2,800,000,000 Tbill
Sovereign Bonds | -1% ₹248 Cr 2,500,000,000 Tbill
Sovereign Bonds | -1% ₹198 Cr 2,000,000,000 Indian Bank
Domestic Bonds | -1% ₹195 Cr 2,000,000,000 Axis Bank Ltd.
Debentures | -1% ₹191 Cr 2,000,000,000
↑ 2,000,000,000 Indian Overseas Bank
Debentures | -1% ₹190 Cr 2,000,000,000 2. Tata Money Market Fund
Tata Money Market Fund
Growth Launch Date 22 May 03 NAV (31 Jul 26) ₹5,055.78 ↑ 1.69 (0.03 %) Net Assets (Cr) ₹32,150 on 30 Jun 26 Category Debt - Money Market AMC Tata Asset Management Limited Rating ☆☆☆ Risk Low Expense Ratio 0.44 Sharpe Ratio 0.82 Information Ratio 0 Alpha Ratio 0 Min Investment 5,000 Min SIP Investment 500 Exit Load NIL Yield to Maturity 7.79% Effective Maturity 7 Months 1 Day Modified Duration 7 Months 1 Day Growth of 10,000 investment over the years.
Date Value 31 Jul 21 ₹10,000 31 Jul 22 ₹10,375 31 Jul 23 ₹11,103 31 Jul 24 ₹11,944 31 Jul 25 ₹12,900 31 Jul 26 ₹13,701 Returns for Tata Money Market Fund
absolute basis & more than 1 year are on CAGR (Compound Annual Growth Rate) basis. as on 31 Jul 26 Duration Returns 1 Month 0.5% 3 Month 1.8% 6 Month 3.4% 1 Year 6.2% 3 Year 7.3% 5 Year 6.5% 10 Year 15 Year Since launch 6.8% Historical performance (Yearly) on absolute basis
Year Returns 2025 7.4% 2024 7.7% 2023 7.4% 2022 4.8% 2021 3.9% 2020 6.4% 2019 8.1% 2018 -0.1% 2017 6.7% 2016 7.6% Fund Manager information for Tata Money Market Fund
Name Since Tenure Amit Somani 16 Oct 13 12.71 Yr. Harsh Dave 1 Jun 26 0.08 Yr. Data below for Tata Money Market Fund as on 30 Jun 26
Asset Allocation
Asset Class Value Cash 87.56% Debt 12.11% Other 0.32% Debt Sector Allocation
Sector Value Corporate 46.25% Cash Equivalent 37.93% Government 15.5% Credit Quality
Rating Value AAA 100% Top Securities Holdings / Portfolio
Name Holding Value Quantity India (Republic of)
- | -3% ₹1,000 Cr 100,000,000
↑ 100,000,000 Indian Bank
Domestic Bonds | -3% ₹958 Cr 19,500 Indian Overseas Bank
Debentures | -2% ₹666 Cr 14,000 Equitas Small Finance Bank Ltd.
Debentures | -2% ₹567 Cr 12,000 India (Republic of)
- | -2% ₹527 Cr 53,000,000 7.86% Karnataka Sdl 2027
Sovereign Bonds | -2% ₹491 Cr 48,500,000
↑ 48,500,000 Karur Vysya Bank Ltd.
Debentures | -2% ₹491 Cr 10,000 Tbill
Sovereign Bonds | -1% ₹445 Cr 45,000,000 India (Republic of)
- | -1% ₹400 Cr 40,500,000 India (Republic of)
- | -1% ₹302 Cr 30,500,000
↓ -25,000,000 3. Aditya Birla Sun Life Money Manager Fund
Aditya Birla Sun Life Money Manager Fund
Growth Launch Date 13 Oct 05 NAV (31 Jul 26) ₹396.157 ↑ 0.14 (0.04 %) Net Assets (Cr) ₹27,383 on 30 Jun 26 Category Debt - Money Market AMC Birla Sun Life Asset Management Co Ltd Rating ☆☆☆☆☆ Risk Low Expense Ratio 0.35 Sharpe Ratio 0.69 Information Ratio 0 Alpha Ratio 0 Min Investment 1,000 Min SIP Investment 1,000 Exit Load NIL Yield to Maturity 6.95% Effective Maturity 6 Months 29 Days Modified Duration 6 Months 25 Days Growth of 10,000 investment over the years.
Date Value 31 Jul 21 ₹10,000 31 Jul 22 ₹10,381 31 Jul 23 ₹11,117 31 Jul 24 ₹11,961 31 Jul 25 ₹12,918 31 Jul 26 ₹13,720 Returns for Aditya Birla Sun Life Money Manager Fund
absolute basis & more than 1 year are on CAGR (Compound Annual Growth Rate) basis. as on 31 Jul 26 Duration Returns 1 Month 0.5% 3 Month 1.8% 6 Month 3.4% 1 Year 6.2% 3 Year 7.3% 5 Year 6.5% 10 Year 15 Year Since launch 6.8% Historical performance (Yearly) on absolute basis
Year Returns 2025 7.4% 2024 7.8% 2023 7.4% 2022 4.8% 2021 3.8% 2020 6.6% 2019 8% 2018 7.9% 2017 6.8% 2016 7.7% Fund Manager information for Aditya Birla Sun Life Money Manager Fund
Name Since Tenure Kaustubh Gupta 15 Jul 11 14.97 Yr. Anuj Jain 22 Mar 21 5.28 Yr. Mohit Sharma 1 Apr 17 9.25 Yr. Data below for Aditya Birla Sun Life Money Manager Fund as on 30 Jun 26
Asset Allocation
Asset Class Value Cash 69.19% Debt 30.52% Other 0.29% Debt Sector Allocation
Sector Value Corporate 51.26% Cash Equivalent 33.61% Government 14.84% Credit Quality
Rating Value AAA 100% Top Securities Holdings / Portfolio
Name Holding Value Quantity Indusind Bank Ltd.
Debentures | -5% ₹1,383 Cr 29,000 Axis Bank Ltd.
Debentures | -3% ₹917 Cr 19,000 Federal Bank Ltd.
Debentures | -3% ₹905 Cr 19,000 Gujarat State Development Loans
Sovereign Bonds | -3% ₹797 Cr 79,327,600 Karur Vysya Bank Ltd.
Debentures | -2% ₹475 Cr 10,000 Tbill
Sovereign Bonds | -1% ₹394 Cr 40,000,000 7.49% Gujarat Sgs 2026
Sovereign Bonds | -1% ₹327 Cr 32,500,000 7.43% Gujarat Sgs 2027
Sovereign Bonds | -1% ₹247 Cr 24,500,000 Tbill
Sovereign Bonds | -1% ₹245 Cr 25,000,000 Karur Vysya Bank Ltd.
Debentures | -1% ₹242 Cr 5,000 4. Kotak Money Market Scheme
Kotak Money Market Scheme
Growth Launch Date 14 Jul 03 NAV (31 Jul 26) ₹4,807.74 ↑ 1.76 (0.04 %) Net Assets (Cr) ₹28,762 on 30 Jun 26 Category Debt - Money Market AMC Kotak Mahindra Asset Management Co Ltd Rating ☆☆☆☆ Risk Low Expense Ratio 0.36 Sharpe Ratio 0.75 Information Ratio 0 Alpha Ratio 0 Min Investment 5,000 Min SIP Investment 1,000 Exit Load NIL Yield to Maturity 7.71% Effective Maturity 7 Months 6 Days Modified Duration 7 Months 6 Days Growth of 10,000 investment over the years.
Date Value 31 Jul 21 ₹10,000 31 Jul 22 ₹10,386 31 Jul 23 ₹11,108 31 Jul 24 ₹11,943 31 Jul 25 ₹12,897 31 Jul 26 ₹13,697 Returns for Kotak Money Market Scheme
absolute basis & more than 1 year are on CAGR (Compound Annual Growth Rate) basis. as on 31 Jul 26 Duration Returns 1 Month 0.5% 3 Month 1.8% 6 Month 3.4% 1 Year 6.2% 3 Year 7.2% 5 Year 6.5% 10 Year 15 Year Since launch 7.1% Historical performance (Yearly) on absolute basis
Year Returns 2025 7.4% 2024 7.7% 2023 7.3% 2022 4.9% 2021 3.7% 2020 5.7% 2019 8% 2018 7.7% 2017 6.7% 2016 7.7% Fund Manager information for Kotak Money Market Scheme
Name Since Tenure Deepak Agrawal 1 Nov 06 19.67 Yr. Manu Sharma 1 Nov 22 3.66 Yr. Data below for Kotak Money Market Scheme as on 30 Jun 26
Asset Allocation
Asset Class Value Cash 87.94% Debt 11.75% Other 0.31% Debt Sector Allocation
Sector Value Corporate 46.99% Cash Equivalent 33.44% Government 19.26% Credit Quality
Rating Value AAA 100% Top Securities Holdings / Portfolio
Name Holding Value Quantity India (Republic of)
- | -4% ₹1,332 Cr 135,000,000 Tbill
Sovereign Bonds | -3% ₹988 Cr 100,000,000 Tbill
Sovereign Bonds | -2% ₹742 Cr 75,000,000 Indusind Bank Ltd.
Debentures | -2% ₹715 Cr 75,000 Punjab National Bank
Debentures | -2% ₹478 Cr 50,000 06/08/2026 Maturing 182 DTB
Sovereign Bonds | -1% ₹397 Cr 40,000,000
↓ -25,000,000 Tbill
Sovereign Bonds | -1% ₹371 Cr 37,500,000 Federal Bank Ltd.
Debentures | -1% ₹359 Cr 37,500 India (Republic of)
- | -1% ₹248 Cr 25,000,000
↓ -15,000,000 Karur Vysya Bank Ltd.
Debentures | -1% ₹238 Cr 25,000 5. Franklin India Savings Fund
Franklin India Savings Fund
Growth Launch Date 11 Feb 02 NAV (31 Jul 26) ₹53.704 ↑ 0.02 (0.03 %) Net Assets (Cr) ₹3,920 on 30 Jun 26 Category Debt - Money Market AMC Franklin Templeton Asst Mgmt(IND)Pvt Ltd Rating ☆☆☆ Risk Moderately Low Expense Ratio 0.3 Sharpe Ratio 0.76 Information Ratio 0 Alpha Ratio 0 Min Investment 10,000 Min SIP Investment 500 Exit Load NIL Yield to Maturity 7.76% Effective Maturity 6 Months 25 Days Modified Duration 4 Months 28 Days Growth of 10,000 investment over the years.
Date Value 31 Jul 21 ₹10,000 31 Jul 22 ₹10,347 31 Jul 23 ₹11,051 31 Jul 24 ₹11,873 31 Jul 25 ₹12,831 31 Jul 26 ₹13,624 Returns for Franklin India Savings Fund
absolute basis & more than 1 year are on CAGR (Compound Annual Growth Rate) basis. as on 31 Jul 26 Duration Returns 1 Month 0.5% 3 Month 1.8% 6 Month 3.3% 1 Year 6.2% 3 Year 7.2% 5 Year 6.4% 10 Year 15 Year Since launch 7.1% Historical performance (Yearly) on absolute basis
Year Returns 2025 7.4% 2024 7.7% 2023 7.3% 2022 4.4% 2021 3.6% 2020 6% 2019 8.5% 2018 7.5% 2017 7.2% 2016 8.1% Fund Manager information for Franklin India Savings Fund
Name Since Tenure Rahul Goswami 6 Oct 23 2.73 Yr. Rohan Maru 10 Oct 24 1.72 Yr. Chandni Gupta 30 Apr 24 2.17 Yr. Data below for Franklin India Savings Fund as on 30 Jun 26
Asset Allocation
Asset Class Value Cash 97.16% Debt 2.57% Other 0.27% Debt Sector Allocation
Sector Value Cash Equivalent 45.27% Corporate 37.49% Government 16.97% Credit Quality
Rating Value AAA 100% Top Securities Holdings / Portfolio
Name Holding Value Quantity Axis Bank Ltd.
Debentures | -2% ₹96 Cr 2,000 India (Republic of)
- | -1% ₹50 Cr 5,000,000 Corporate Debt Market Development Fund Class A2
- | -0% ₹11 Cr 8,992 6.88% Westbengal Sdl 2026
Sovereign Bonds | -0% ₹5 Cr 500,000 Call, Cash & Other Assets
CBLO | -13% ₹510 Cr Bajaj Housing Finance Ltd.
Commercial Paper | -7% ₹285 Cr 6,000 Piramal Finance Limited
Commercial Paper | -7% ₹257 Cr 5,300 HDFC Bank Ltd
Certificate of Deposit | -6% ₹238 Cr 5,000 National Bank For Agriculture And Rural Development
Certificate of Deposit | -6% ₹220 Cr 4,600 Canara Bank
Certificate of Deposit | -5% ₹190 Cr 4,000
ముగింపు
మనీ మార్కెట్ సాధనాల గురించి మనం తెలుసుకున్నప్పుడు డెట్ మ్యూచువల్ ఫండ్స్, వాటి రకాలు మరియు వర్గీకరణల గురించి తెలుసుకోవడం కూడా చాలా ముఖ్యం. బాగా, డెట్ మ్యూచువల్ ఫండ్స్ లిక్విడ్ ఫండ్స్, అల్ట్రా వంటి సాధారణ విస్తృత వర్గాలుగా వర్గీకరించబడ్డాయిస్వల్పకాలిక నిధులు, షార్ట్ టర్మ్ ఫండ్స్, లాంగ్ టర్మ్ ఇన్కమ్ ఫండ్స్ మరియుగిల్ట్ ఫండ్స్.
అయితే, మనీ మార్కెట్ ఫండ్లలో పెట్టుబడి పెట్టడానికి, పరిస్థితిని అర్థం చేసుకోవడం చాలా ముఖ్యంఆర్థిక వ్యవస్థ, వడ్డీ రేట్ల దిశ, మరియు పెట్టుబడి పెట్టేటప్పుడు కార్పొరేట్ రుణం అలాగే ప్రభుత్వ రుణాలలో దిగుబడుల కదలిక యొక్క అంచనా దిశ.
ఇక్కడ అందించిన సమాచారం ఖచ్చితమైనదని నిర్ధారించడానికి అన్ని ప్రయత్నాలు చేయబడ్డాయి. అయినప్పటికీ, డేటా యొక్క ఖచ్చితత్వానికి సంబంధించి ఎటువంటి హామీలు ఇవ్వబడవు. దయచేసి ఏదైనా పెట్టుబడి పెట్టే ముందు పథకం సమాచార పత్రంతో ధృవీకరించండి.


?")


AMFI Registration No. 112358 | CIN: U74999MH2016PTC282153
Shepard Technologies Pvt. Ltd. (with ARN code 112358) makes no warranties or representations, express or implied, on products offered through the platform. It accepts no liability for any damages or losses, however caused, in connection with the use of, or on the reliance of its product or related services. Terms and conditions of the website are applicable.
©2026 Shepard Technologies Private Limited. All Rights Reserved
Research Highlights for UTI Money Market Fund