سال کے دوران بی ایس ای سینسیکس کی نمو
ایکویٹیز طویل مدتی کے لیے کیوں اچھی ہیں؟
جب بھی ہم ایکویٹی انویسٹمنٹ کے بارے میں سنتے ہیں، سب سے پہلی چیز جو ہم سنتے ہیں وہ یہ ہے کہ ایکویٹی طویل مدتی سرمایہ کاری کے لیے اچھی ہوتی ہے۔ تاہم، مختلف لوگ ایکویٹی سرمایہ کاری کے حوالے سے منفی خیالات رکھتے ہیں۔ لہذا، آئیے یہ سمجھتے ہیں کہ ایکویٹی طویل مدتی کے لیے کیوں اور کیسے اچھی سرمایہ کاری ہے، ایکویٹی سرمایہ کاری کے پیچھے کی خرافات، اور پیرامیٹرز کی جانچ پڑتال کے دورانسرمایہ کاری مساوات اور تصور میںایکویٹی فنڈز.
سینسیکس کی ماضی کی کارکردگی کو سمجھنا
اب، آئیے ذیل میں دیے گئے گراف کی مدد سے سینسیکس کی شروعات سے لے کر اب تک کی کارکردگی پر توجہ مرکوز کریں۔
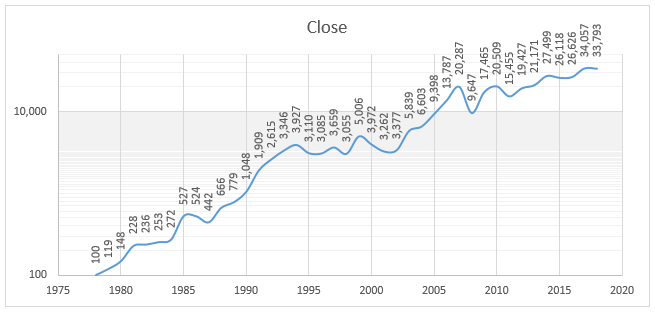
(3 جنوری 2018 تک، ماخذ- بی ایس ای لمیٹڈ)
سینسیکس کا دیا گیا گراف ظاہر کرتا ہے کہ 1979 میں اس کے قیام کے بعد سے اس میں مجموعی طور پر اضافہ ہوا ہے۔ جس تاریخ پر ڈیٹا لیا گیا ہے وہ 03 جنوری 2018 ہے۔ 1979 سے اب تک،مرکب سالانہ ترقی کی شرح (سی اے جی آر) تقریباً 16.39 فیصد ہے. تاہم، اس کا مطلب یہ نہیں ہے کہ سینسیکس نے صرف اوپر کی حرکت دیکھی ہے۔تاہم، سینسیکس نے جو سب سے بڑی ترقی دیکھی ہے وہ 1979-1994 کی مدت کے درمیان ہے جب مارکیٹ 100 سے بڑھ کر 3,927 پوائنٹس تک پہنچ گئی تھی۔. جن لوگوں نے اس عرصے میں سرمایہ کاری کی تھی وہ کافی منافع کما چکے ہوں گے۔ اس کے علاوہ، ان سرمایہ کاروں کو بھی دوسروں کی طرح زیادہ منفی منافع کا سامنا نہیں کرنا پڑا۔ نتیجتاً ان لوگوں نے ضرور کمایا ہوگا۔دوسرا بہترین مرحلہ جس میں سرمایہ کاروں نے منافع کمایا وہ 2003-2007 کے دوران تھا۔لیکن اس عرصے کے دوران اضافہ پہلے مرحلے کی طرح موثر نہیں تھا۔
تو، کیا آپ کو لگتا ہے کہمارکیٹ ہمیشہ ایک اچھی رفتار کا مشاہدہ کیا ہے؟اس میں مندی بھی دیکھی گئی ہے۔ ستمبر 1994 - 1999، 2000 - 2003 اور 2008 - 2010 کے دوران کچھ بدترین منتر جہاں سینسیکس میں مندی دکھائی دے رہی تھی. کوئی بھی فرد جس نے اس مدت کے دوران سرمایہ کاری کی ہوگی وہ یقینی طور پر منفی ہوگا۔ تاہم، ایک بار پھر، اگر یہ سرمایہ کار اپنی سرمایہ کاری کو زیادہ دیر تک روکے رکھتے، تو وہ یقینی طور پر منافع کماتے۔ جیسا کہ ہم نقشے میں دیکھ سکتے ہیں، مندی کا دورانیہ زیادہ نظر نہیں آتا۔
لہذا، ایکویٹی کے بارے میں خرافات کو سمجھنے کے بعد، آئیے اب دیکھتے ہیں کہ اسٹاک کا انتخاب کیسے کریں۔
ایکویٹی سرمایہ کاری کے پیچھے عام خرافات
جیسا کہ پہلے ذکر کیا گیا ہے، ایکویٹی انویسٹمنٹ کے ساتھ متعدد خرافات وابستہ ہیں۔ لہذا، آئیے ایکویٹی سرمایہ کاری کے پیچھے کچھ مروجہ خرافات کو دیکھتے ہیں۔
1. اگر کسی اسٹاک نے ماضی میں اچھا کام کیا ہے، تو یہ مستقبل میں بھی اچھا کام کرے گا۔
حصص میں سرمایہ کاری کرتے وقت سب سے پہلا افسانہ جس پر لوگ یقین کرتے ہیں۔ اگر کسی کمپنی نے ماضی میں اچھا کام کیا ہے تو وہ مستقبل میں بھی اچھا کام کرے گی۔ اگرچہ یہ سوچ ابھی تک کچھ سکون کی سطح دے سکتی ہے۔ یہ مکمل طور پر سچ نہیں ہے. یہ اس لئے کیوں کے؛ کسی کمپنی کی کامیابی کا انحصار ہمیشہ اس ماحول پر ہوتا ہے جس میں وہ کارکردگی دکھاتی ہے اور کیا وہ بدلتے ہوئے کاروباری حالات کے مطابق خود کو ڈھالنے کے قابل ہے۔ اگر ایسا کرنے کے قابل نہیں ہے تو؛ کمپنی مستقبل میں کارکردگی کا مظاہرہ کرنے کی پوزیشن میں نہیں ہوگی۔
اس لیے لوگوں کو کسی بھی کمپنی کے شیئرز میں سرمایہ کاری کرنے سے پہلے خود تجزیہ کرنا چاہیے۔ انہیں کمپنی کی ماضی کی کارکردگی، اس کے مستقبل کے امکانات، صنعت کے حالات جن میں یہ کارکردگی دکھاتی ہے، اور دیگر متعلقہ پیرامیٹرز کو چیک کرنا چاہیے۔
2. میں ایکویٹیز کے ذریعے تیزی سے منافع کمانے کے قابل نہیں ہوں کیونکہ یہ سراسر قسمت ہے
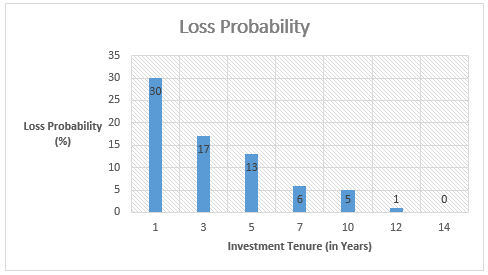
دوسرا قیاس جو لوگ محسوس کرتے ہیں وہ یہ ہے کہ وہ ایکویٹی سرمایہ کاری سے کما نہیں سکتے کیونکہ یہ سراسر قسمت پر مبنی ہے۔ تاہم، جیسا کہ پہلے پیراگراف میں ذکر کیا گیا ہے، لوگوں کو یہ سمجھنے کی ضرورت ہے کہ ہولڈنگ کی مدت میں اضافے کے ساتھ اوسط منافع کا تغیر کم ہوجاتا ہے۔ اس کی وجہ یہ ہے کہ طویل مدتی میں، قلیل مدتی اتار چڑھاؤ میں کمی آتی ہے اور نقصانات کے امکانات بھی کم ہوتے ہیں۔ نتیجتاً، میں تغیراتکمائی مدت میں اضافے کے ساتھ کم ہونا شروع ہو جاتا ہے۔ اس تصور کی وضاحت ذیل میں دی گئی جدول کی مدد سے کی گئی ہے۔
| سرمایہ کاری کی مدت | اوسط منافع (%) | اوسط سے واپسیوں کا انحراف (%) |
|---|---|---|
| 1 سال | 18 | ±34 |
| 3 سال | 13 | ± 16% |
| 5 سال | 13 | ± 13% |
| 7 سال | 13 | ± 10% |
| 10 سال | 13 | ± 9% |
| 12 سال | 13 | ± 8% |
| 14 سال | 12 | ± 7% |
3. شیئر مارکیٹس میں صرف چند ہی کمائی کر رہے ہیں کیونکہ ایکویٹی مارکیٹیں غیر مستحکم ہیں۔
یہ افراد کے درمیان مروجہ خرافات میں سے ایک ہے۔ بہت سے لوگوں کو لگتا ہے کہ وہ حصص میں سرمایہ کاری کرکے کما نہیں سکتے۔ بہت سے واقعات میں افراد محسوس کرتے ہیں؛ اگرچہ حصص بازاروں میں تیزی کا رجحان دکھائی دے رہا ہے۔ ابھی تک میں اپنی قسمت بنانے کے قابل نہیں ہوں۔ تاہم، یہ سچ نہیں ہے.
*کسی کو سمجھنا ہوگا کہ ایکویٹی سرمایہ کاری ایک صفر رقم کا کھیل ہے۔ اس لیے ایک شخص کا نفع دوسرے کا نقصان ہے۔ تاہم، اس بات کا نتیجہ کہ آپ نے منافع کمایا یا نقصان میں ختم ہونے کا فیصلہ اس وقت ہوتا ہے جب آپ مارکیٹ میں داخل ہوتے اور باہر نکلتے ہیں۔ *
ایک بار پھر اس بات کا اعادہ کیا جائے گا کہ، ایکویٹی سرمایہ کاری میں کامیابی کی کلید اس کا طویل مدتی انعقاد ہے۔ دنیا کی مشہور شخصیات میں سے ایکسرمایہ کار وارن بفے نے اپنی سلطنت صرف سرمایہ کاری کی وجہ سے نہیں بنائی۔ اس کے بجائے، اس نے سرمایہ کاری کو طویل مدت تک رکھنے کی وجہ سے دولت کمائی ہے۔ طویل مدتی سرمایہ کاری کی صورت میں، سرمایہ کاری کی گئی تھوڑی سی رقم بھی زیادہ منافع دیتی ہے۔ وہ لوگ جو بہت لمبے عرصے تک سرمایہ کاری میں رہتے ہیں وہ تھوڑی سی سرمایہ کاری کے باوجود بھی دولت کما سکتے ہیں۔ مندرجہ ذیل گراف دکھاتا ہے کہ سرمایہ کاری کی مدت میں اضافے کے ساتھ نقصانات کا امکان کیسے کم ہوتا ہے۔
Talk to our investment specialist
ایکویٹیز میں سرمایہ کاری کیسے کریں۔
یہ سب سے اہم قدم ہے۔ ایکویٹی میں سرمایہ کاری کرتے وقت لوگوں کو کچھ بنیادی اصولوں پر قائم رہنے کی ضرورت ہوتی ہے۔ ان میں سے کچھ قواعد درج ذیل ہیں۔
اسٹاک میں اس کے مکمل تجزیہ کے بعد سرمایہ کاری کریں اور ریوڑ کے رویے کی پیروی نہ کریں۔
سرمایہ کاری کا بنیادی اصول ہے؛ ان مالیاتی آلات میں سرمایہ کاری کریں جنہیں آپ سمجھتے ہیں نہ کہ ان میں جو آپ نہیں سمجھتے۔ لہذا، لوگوں کو ان حصص کا مکمل تجزیہ کرنا چاہئے جس میں وہ سرمایہ کاری کرنا چاہتے ہیں۔ انہیں اس کی سالانہ رپورٹس پر غور کرنا چاہیے، اس کے مستقبل کے امکانات وغیرہ کو دیکھنا چاہیے۔ مزید برآں، کسی کو اپنے سٹاک کے انتخاب کے عمل میں متعصب نہیں ہونا چاہیے۔ اس کے علاوہ، بہت سے لوگ جب سرمایہ کاری کی بات آتی ہے تو ریوڑ کے رویے کی پیروی کرتے ہیں، جو ایسا نہیں ہونا چاہیے۔ یہ ایک اچھا خیال نہیں ہے۔ ریوڑ کا حصہ بننے والے لوگ، اس وقت داخل ہوتے ہیں جب بازار اپنے عروج پر ہوتا ہے اور جب نیچے ہوتا ہے تو فروخت کرتے ہیں۔ لہٰذا، محتاط رہیں کہ جب سب خرید رہے ہوں تو آپ حصص نہ خریدیں۔کال کریں۔ اور فروخت نہ کریں جب ہر کوئی بیچنے کے شوق میں جاتا ہے۔
تنوع کامیابی کی کلید ہے۔
سرمایہ کاری کے معاملے میں اہم کردار تنوع کا ہے، جو کامیابی کی کلید ہے کیونکہ یہ خطرے کی سطح کو کم کرنے میں مدد کرتا ہے۔ جیسا کہ بجا طور پر نقل کیا ہے۔"اپنے تمام انڈے ایک ہی ٹوکری میں نہ نکالیں؛" اسی طرح آپ کی سرمایہ کاری کو پہلے سے طے شدہ تناسب میں متعدد اسٹاکس میں تقسیم کیا جانا چاہیے۔ اس تناظر میں تنوع کا مطلب ہے کہ لوگ سرمایہ کاری، شعبوں اور دیگر پیرامیٹرز کے حوالے سے مختلف کمپنیوں کے مختلف حصص میں سرمایہ کاری کرتے ہیں۔ اس کی وجہ یہ ہے کہ ایسے حالات ہیں جہاںدرمیانی ٹوپی حصص بڑے کیپ کے حصص کو پیچھے چھوڑتے ہیں۔ لہذا، کسی کو اس بات پر مسلسل نظر رکھنے کی ضرورت ہے کہ کوئی حصہ کیسا کارکردگی دکھا رہا ہے۔
اپنے پورٹ فولیو کو بروقت متوازن کریں۔
صحیح کہا ہے کہ غلطی کرنا انسان ہے۔ اسی طرح، اسٹاک مارکیٹ میں سرمایہ کاری کرتے ہوئے، بہت سے لوگ غلطیاں کرتے ہیں۔ اس تناظر میں غلطی ان حصص میں سرمایہ کاری کرنا ہے جہاں آپ کے سودے خراب ہیں۔ تاہم، سب سے اہم حصہ اپنے پورٹ فولیو کو دوبارہ متوازن کرکے غلط سرمایہ کاری کو درست کرنا ہے۔ یہ ضروری ہے کہ آپ اپنی ایکویٹی سرمایہ کاری کی بروقت نگرانی کریں۔ اس سے یہ معلوم کرنے میں مدد ملے گی کہ کون سے اسٹاک کو بیچنا ہے اور کون سے اسٹاک کو برقرار رکھنا ہے۔ پورٹ فولیو کو دوبارہ متوازن کرنے سے ہمیشہ خراب اسٹاک سے چھٹکارا حاصل کرنے میں مدد ملتی ہے اور اس طرح لوگ زیادہ کما سکتے ہیں۔آمدنی.
اس طرح، مندرجہ بالا نکات سے، یہ کہا جا سکتا ہے کہ جب بھی آپ ایکوئٹی میں سرمایہ کاری کرنے کا انتخاب کرتے ہیں، تو آپ کو مارکیٹ کے وقت کے بجائے شیئر مارکیٹوں میں زیادہ وقت گزارنے کی ضرورت ہوتی ہے۔ اس کے علاوہ، لوگوں کو کمپنی کے حصص میں سرمایہ کاری کرنے سے پہلے ہمیشہ اس کو سمجھنا چاہیے تاکہ ان کی سرمایہ کاری کی رقم محفوظ رہے اور دولت کی تخلیق کی راہ ہموار ہو۔
طویل مدتی سرمایہ کاری کے لیے سرفہرست 10 ایکویٹی میوچل فنڈز
*اثاثوں کا انتظام کرنے والے سرفہرست فنڈز کی فہرست5 سال مندرجہ بالا میں سے اور بہترین سالانہ ریٹرن (CAGR) لوٹے ہیں۔
(Erstwhile Sundaram Select Midcap Fund) To achieve capital appreciation by investing
in diversified stocks that are generally termed
as mid-caps. Below is the key information for Sundaram Mid Cap Fund Returns up to 1 year are on To generate long term capital appreciation from a portfolio that is predominantly in equity and equity related instruments Research Highlights for HDFC Long Term Advantage Fund Below is the key information for HDFC Long Term Advantage Fund Returns up to 1 year are on An Open-ended growth scheme with the objective of long term growth of capital, through a portfolio with a target allocation of 90% equity and 10% debt and money market securities. Research Highlights for Aditya Birla Sun Life Equity Fund Below is the key information for Aditya Birla Sun Life Equity Fund Returns up to 1 year are on An Open ended Growth Scheme with the objective to achieve long term growth of capital at controlled level of risk by investing primarily in ‘Mid-Cap’ Stocks. The level of risk is somewhat higher than a fund focused on large and liquid stocks. Concomitantly, the aim is to generate higher returns than a fund focused on large and liquid stocks. Research Highlights for Aditya Birla Sun Life Midcap Fund Below is the key information for Aditya Birla Sun Life Midcap Fund Returns up to 1 year are on (Erstwhile Motilal Oswal MOSt Focused Midcap 30 Fund) The investment objective of the Scheme is to achieve long term capital appreciation by investing in a maximum of 30 quality mid-cap companies having long-term competitive advantages and potential for growth. However, there can be no assurance or guarantee that the investment objective of the Scheme would be achieved. Research Highlights for Motilal Oswal Midcap 30 Fund Below is the key information for Motilal Oswal Midcap 30 Fund Returns up to 1 year are on The primary investment objective of the scheme is to seek to generate consistent returns by investing in equity and equity related or fixed income securities of Pharma and other associated companies. Research Highlights for Nippon India Pharma Fund Below is the key information for Nippon India Pharma Fund Returns up to 1 year are on The primary investment objective of the scheme is to generate long term capital appreciation by investing predominantly in equity and equity related instruments of small cap companies and the secondary objective is to generate consistent returns by investing in debt and money market securities. Research Highlights for Nippon India Small Cap Fund Below is the key information for Nippon India Small Cap Fund Returns up to 1 year are on The primary objective for Franklin IndiaTaxshield is to provide medium to long term growth of capital along with income tax rebate Research Highlights for Franklin India Taxshield Below is the key information for Franklin India Taxshield Returns up to 1 year are on The primary investment objective of the Scheme is to seek to generate continuous returns by actively investing in equity and equity related securities of
companies in the Banking Sector and companies engaged in allied activities related to Banking Sector. The AMC will have the discretion to completely or
partially invest in any of the type of securities stated above with a view to maximize the returns or on defensive considerations. However, there can be no
assurance that the investment objective of the Scheme will be realized, as actual market movements may be at variance with anticipated trends. Research Highlights for Nippon India Banking Fund Below is the key information for Nippon India Banking Fund Returns up to 1 year are on To generate returns through a combination of dividend income and capital appreciation by investing primarily in a well-diversified portfolio of value stocks. Value stocks are those, which have attractive valuations in relation to earnings or book value or current and/or future dividends. Research Highlights for ICICI Prudential Value Discovery Fund Below is the key information for ICICI Prudential Value Discovery Fund Returns up to 1 year are on 1. Sundaram Mid Cap Fund
Sundaram Mid Cap Fund
Growth Launch Date 30 Jul 02 NAV (24 Jul 26) ₹1,473.74 ↓ -6.79 (-0.46 %) Net Assets (Cr) ₹14,026 on 30 Jun 26 Category Equity - Mid Cap AMC Sundaram Asset Management Company Ltd Rating ☆☆☆☆ Risk Moderately High Expense Ratio 1.75 Sharpe Ratio 0.06 Information Ratio 0.32 Alpha Ratio 0.71 Min Investment 5,000 Min SIP Investment 100 Exit Load 0-12 Months (1%),12 Months and above(NIL) Growth of 10,000 investment over the years.
Date Value 30 Jun 21 ₹10,000 30 Jun 22 ₹9,952 30 Jun 23 ₹12,988 30 Jun 24 ₹20,155 30 Jun 25 ₹21,973 30 Jun 26 ₹23,117 Returns for Sundaram Mid Cap Fund
absolute basis & more than 1 year are on CAGR (Compound Annual Growth Rate) basis. as on 24 Jul 26 Duration Returns 1 Month 0.2% 3 Month 4.3% 6 Month 8.7% 1 Year 6% 3 Year 20.3% 5 Year 17.4% 10 Year 15 Year Since launch 23.1% Historical performance (Yearly) on absolute basis
Year Returns 2025 4.1% 2024 32% 2023 40.4% 2022 4.8% 2021 37.5% 2020 11.8% 2019 -0.3% 2018 -15.4% 2017 40.8% 2016 11.3% Fund Manager information for Sundaram Mid Cap Fund
Name Since Tenure S. Bharath 24 Feb 21 5.35 Yr. Shalav Saket 31 Dec 25 0.5 Yr. Data below for Sundaram Mid Cap Fund as on 30 Jun 26
Equity Sector Allocation
Sector Value Financial Services 21.92% Industrials 19.24% Consumer Cyclical 14.17% Health Care 9.9% Basic Materials 8.55% Technology 8.5% Consumer Defensive 5.02% Real Estate 3.11% Utility 3.02% Communication Services 1.96% Energy 1.38% Asset Allocation
Asset Class Value Cash 3.22% Equity 96.76% Other 0% Top Securities Holdings / Portfolio
Name Holding Value Quantity GE Vernova T&D India Ltd (Industrials)
Equity, Since 30 Sep 24 | GVT&D3% ₹463 Cr 900,000
↓ -100,000 Cummins India Ltd (Industrials)
Equity, Since 31 Dec 17 | CUMMINSIND3% ₹441 Cr 750,000
↓ -100,000 BSE Ltd (Financial Services)
Equity, Since 31 May 24 | BSE3% ₹392 Cr 945,165 Mahindra & Mahindra Financial Services Ltd (Financial Services)
Equity, Since 31 Jan 24 | M&MFIN3% ₹349 Cr 11,498,475 Max Financial Services Ltd (Financial Services)
Equity, Since 30 Jun 16 | MFSL2% ₹302 Cr 1,805,000
↑ 130,000 The Federal Bank Ltd (Financial Services)
Equity, Since 31 Dec 18 | FEDERALBNK2% ₹300 Cr 10,399,688 Coromandel International Ltd (Basic Materials)
Equity, Since 30 Nov 10 | COROMANDEL2% ₹288 Cr 1,642,029 Suzlon Energy Ltd (Industrials)
Equity, Since 31 Jul 24 | SUZLON2% ₹287 Cr 50,302,475
↑ 11,730,000 IDFC First Bank Ltd (Financial Services)
Equity, Since 30 Jun 25 | IDFCFIRSTB2% ₹273 Cr 38,278,844 Marico Ltd (Consumer Defensive)
Equity, Since 30 Jun 24 | MARICO2% ₹271 Cr 3,300,000
↓ -95,879 2. HDFC Long Term Advantage Fund
HDFC Long Term Advantage Fund
Growth Launch Date 2 Jan 01 NAV (14 Jan 22) ₹595.168 ↑ 0.28 (0.05 %) Net Assets (Cr) ₹1,318 on 30 Nov 21 Category Equity - ELSS AMC HDFC Asset Management Company Limited Rating ☆☆☆ Risk Moderately High Expense Ratio 2.25 Sharpe Ratio 2.27 Information Ratio -0.15 Alpha Ratio 1.75 Min Investment 500 Min SIP Investment 500 Exit Load NIL Growth of 10,000 investment over the years.
Date Value 30 Jun 21 ₹10,000
Purchase not allowed Returns for HDFC Long Term Advantage Fund
absolute basis & more than 1 year are on CAGR (Compound Annual Growth Rate) basis. as on 24 Jul 26 Duration Returns 1 Month 4.4% 3 Month 1.2% 6 Month 15.4% 1 Year 35.5% 3 Year 20.6% 5 Year 17.4% 10 Year 15 Year Since launch 21.4% Historical performance (Yearly) on absolute basis
Year Returns 2025 2024 2023 2022 2021 2020 2019 2018 2017 2016 Fund Manager information for HDFC Long Term Advantage Fund
Name Since Tenure Data below for HDFC Long Term Advantage Fund as on 30 Nov 21
Equity Sector Allocation
Sector Value Asset Allocation
Asset Class Value Top Securities Holdings / Portfolio
Name Holding Value Quantity 3. Aditya Birla Sun Life Equity Fund
Aditya Birla Sun Life Equity Fund
Growth Launch Date 27 Aug 98 NAV (24 Jul 26) ₹1,905.14 ↓ -1.92 (-0.10 %) Net Assets (Cr) ₹26,727 on 30 Jun 26 Category Equity - Multi Cap AMC Birla Sun Life Asset Management Co Ltd Rating ☆☆☆☆ Risk Moderately High Expense Ratio 1.68 Sharpe Ratio -0.05 Information Ratio 1.19 Alpha Ratio 4.61 Min Investment 1,000 Min SIP Investment 100 Exit Load 0-365 Days (1%),365 Days and above(NIL) Growth of 10,000 investment over the years.
Date Value 30 Jun 21 ₹10,000 30 Jun 22 ₹9,498 30 Jun 23 ₹11,679 30 Jun 24 ₹15,882 30 Jun 25 ₹17,332 30 Jun 26 ₹17,935 Returns for Aditya Birla Sun Life Equity Fund
absolute basis & more than 1 year are on CAGR (Compound Annual Growth Rate) basis. as on 24 Jul 26 Duration Returns 1 Month 0.7% 3 Month 5% 6 Month 4.8% 1 Year 6.2% 3 Year 14.8% 5 Year 12.1% 10 Year 15 Year Since launch 20.7% Historical performance (Yearly) on absolute basis
Year Returns 2025 11.2% 2024 18.5% 2023 26% 2022 -1.1% 2021 30.3% 2020 16.1% 2019 8.5% 2018 -4.1% 2017 33.5% 2016 15.2% Fund Manager information for Aditya Birla Sun Life Equity Fund
Name Since Tenure Harish Krishnan 3 Nov 23 2.66 Yr. Dhaval Joshi 21 Nov 22 3.61 Yr. Data below for Aditya Birla Sun Life Equity Fund as on 30 Jun 26
Equity Sector Allocation
Sector Value Financial Services 29.69% Consumer Cyclical 13.92% Industrials 11.85% Basic Materials 11.8% Health Care 8.93% Technology 8.23% Consumer Defensive 7.38% Energy 4.18% Communication Services 2.18% Real Estate 0.53% Asset Allocation
Asset Class Value Cash 1.33% Equity 98.67% Top Securities Holdings / Portfolio
Name Holding Value Quantity ICICI Bank Ltd (Financial Services)
Equity, Since 30 Nov 16 | ICICIBANK6% ₹1,489 Cr 11,849,171 HDFC Bank Ltd (Financial Services)
Equity, Since 31 Jul 08 | HDFCBANK3% ₹893 Cr 12,000,000 Kotak Mahindra Bank Ltd (Financial Services)
Equity, Since 28 Feb 19 | KOTAKBANK3% ₹887 Cr 23,096,430 Reliance Industries Ltd (Energy)
Equity, Since 31 May 19 | RELIANCE3% ₹754 Cr 5,706,067 Infosys Ltd (Technology)
Equity, Since 30 Apr 05 | INFY3% ₹715 Cr 6,161,817 Hindalco Industries Ltd (Basic Materials)
Equity, Since 31 Mar 17 | HINDALCO2% ₹620 Cr 5,500,000 State Bank of India (Financial Services)
Equity, Since 28 Feb 21 | SBIN2% ₹589 Cr 6,105,500
↓ -394,500 Bharti Airtel Ltd (Communication Services)
Equity, Since 30 Nov 17 | BHARTIARTL2% ₹567 Cr 3,100,000 Bharat Forge Ltd (Consumer Cyclical)
Equity, Since 30 Jun 17 | BHARATFORG2% ₹564 Cr 2,883,624 HCL Technologies Ltd (Technology)
Equity, Since 30 Nov 11 | HCLTECH2% ₹486 Cr 4,103,703 4. Aditya Birla Sun Life Midcap Fund
Aditya Birla Sun Life Midcap Fund
Growth Launch Date 3 Oct 02 NAV (24 Jul 26) ₹829.74 ↑ 1.78 (0.21 %) Net Assets (Cr) ₹6,624 on 30 Jun 26 Category Equity - Mid Cap AMC Birla Sun Life Asset Management Co Ltd Rating ☆☆☆ Risk Moderately High Expense Ratio 1.89 Sharpe Ratio 0.01 Information Ratio -0.44 Alpha Ratio -0.17 Min Investment 1,000 Min SIP Investment 1,000 Exit Load 0-365 Days (1%),365 Days and above(NIL) Growth of 10,000 investment over the years.
Date Value 30 Jun 21 ₹10,000 30 Jun 22 ₹10,374 30 Jun 23 ₹12,605 30 Jun 24 ₹18,783 30 Jun 25 ₹19,896 30 Jun 26 ₹20,698 Returns for Aditya Birla Sun Life Midcap Fund
absolute basis & more than 1 year are on CAGR (Compound Annual Growth Rate) basis. as on 24 Jul 26 Duration Returns 1 Month -0.9% 3 Month 5.1% 6 Month 9.2% 1 Year 3.6% 3 Year 16.6% 5 Year 14.5% 10 Year 15 Year Since launch 20.4% Historical performance (Yearly) on absolute basis
Year Returns 2025 4.4% 2024 22% 2023 39.9% 2022 -5.3% 2021 50.4% 2020 15.5% 2019 -3.7% 2018 -16% 2017 44.8% 2016 5.7% Fund Manager information for Aditya Birla Sun Life Midcap Fund
Name Since Tenure Vishal Gajwani 31 Oct 24 1.67 Yr. Data below for Aditya Birla Sun Life Midcap Fund as on 30 Jun 26
Equity Sector Allocation
Sector Value Financial Services 26.79% Industrials 18.06% Consumer Cyclical 14.29% Basic Materials 13.25% Health Care 8.29% Technology 7.72% Real Estate 4.48% Utility 2.44% Consumer Defensive 2.4% Asset Allocation
Asset Class Value Cash 1.36% Equity 98.62% Top Securities Holdings / Portfolio
Name Holding Value Quantity Thermax Ltd (Industrials)
Equity, Since 31 Oct 19 | THERMAX3% ₹207 Cr 414,874
↓ -87,098 Max Financial Services Ltd (Financial Services)
Equity, Since 28 Feb 17 | MFSL3% ₹205 Cr 1,225,565 The Federal Bank Ltd (Financial Services)
Equity, Since 31 Mar 12 | FEDERALBNK3% ₹204 Cr 7,043,431 AU Small Finance Bank Ltd (Financial Services)
Equity, Since 30 Nov 19 | AUBANK3% ₹191 Cr 1,940,849
↓ -70,318 Billionbrains Garage Ventures Ltd (Financial Services)
Equity, Since 30 Nov 25 | GROWW3% ₹182 Cr 9,857,530
↑ 6,322,938 JK Cement Ltd (Basic Materials)
Equity, Since 31 Jan 24 | JKCEMENT3% ₹177 Cr 342,940 APL Apollo Tubes Ltd (Basic Materials)
Equity, Since 31 Aug 24 | APLAPOLLO2% ₹160 Cr 873,080 Torrent Power Ltd (Utilities)
Equity, Since 31 Oct 19 | TORNTPOWER2% ₹156 Cr 1,100,000 Navin Fluorine International Ltd (Basic Materials)
Equity, Since 31 Jan 25 | NAVINFLUOR2% ₹146 Cr 204,519 KEI Industries Ltd (Industrials)
Equity, Since 31 May 25 | KEI2% ₹136 Cr 257,506
↓ -23,828 5. Motilal Oswal Midcap 30 Fund
Motilal Oswal Midcap 30 Fund
Growth Launch Date 24 Feb 14 NAV (24 Jul 26) ₹97.2452 ↓ -0.07 (-0.07 %) Net Assets (Cr) ₹37,474 on 30 Jun 26 Category Equity - Mid Cap AMC Motilal Oswal Asset Management Co. Ltd Rating ☆☆☆ Risk Moderately High Expense Ratio 1.56 Sharpe Ratio -0.71 Information Ratio -0.25 Alpha Ratio -14.72 Min Investment 5,000 Min SIP Investment 500 Exit Load 0-1 Years (1%),1 Years and above(NIL) Growth of 10,000 investment over the years.
Date Value 30 Jun 21 ₹10,000 30 Jun 22 ₹11,908 30 Jun 23 ₹16,418 30 Jun 24 ₹26,938 30 Jun 25 ₹29,503 30 Jun 26 ₹26,510 Returns for Motilal Oswal Midcap 30 Fund
absolute basis & more than 1 year are on CAGR (Compound Annual Growth Rate) basis. as on 24 Jul 26 Duration Returns 1 Month 3.5% 3 Month 7% 6 Month 6.3% 1 Year -4.7% 3 Year 18.4% 5 Year 21.3% 10 Year 15 Year Since launch 20.1% Historical performance (Yearly) on absolute basis
Year Returns 2025 -12.1% 2024 57.1% 2023 41.7% 2022 10.7% 2021 55.8% 2020 9.3% 2019 9.7% 2018 -12.7% 2017 30.8% 2016 5.2% Fund Manager information for Motilal Oswal Midcap 30 Fund
Name Since Tenure Varun Sharma 21 Jan 26 0.44 Yr. Swapnil Mayekar 18 Nov 25 0.62 Yr. Ajay Khandelwal 1 Oct 24 1.75 Yr. Ankit Agarwal 21 Jan 26 0.44 Yr. Rakesh Shetty 22 Nov 22 3.61 Yr. Data below for Motilal Oswal Midcap 30 Fund as on 30 Jun 26
Equity Sector Allocation
Sector Value Financial Services 31.02% Technology 26.84% Industrials 13.76% Consumer Cyclical 13.41% Communication Services 3.08% Real Estate 2.81% Health Care 2.46% Asset Allocation
Asset Class Value Cash 6.63% Equity 93.37% Top Securities Holdings / Portfolio
Name Holding Value Quantity One97 Communications Ltd (Technology)
Equity, Since 30 Sep 24 | PAYTM7% ₹2,659 Cr 23,765,865 Coforge Ltd (Technology)
Equity, Since 31 Mar 23 | COFORGE6% ₹2,233 Cr 15,703,312
↓ -979,603 Kalyan Jewellers India Ltd (Consumer Cyclical)
Equity, Since 29 Feb 24 | KALYANKJIL6% ₹2,180 Cr 61,413,395 KEI Industries Ltd (Industrials)
Equity, Since 30 Nov 24 | KEI6% ₹2,123 Cr 4,030,834 Eternal Ltd (Consumer Cyclical)
Equity, Since 31 Aug 25 | ETERNAL6% ₹2,115 Cr 84,386,866 Persistent Systems Ltd (Technology)
Equity, Since 31 Jan 23 | PERSISTENT6% ₹2,091 Cr 4,026,493 Aditya Birla Capital Ltd (Financial Services)
Equity, Since 30 Jun 25 | ABCAPITAL5% ₹1,906 Cr 52,459,381
↓ -1,000,000 Billionbrains Garage Ventures Ltd (Financial Services)
Equity, Since 31 Jan 26 | GROWW4% ₹1,564 Cr 84,616,660 Multi Commodity Exchange of India Ltd (Financial Services)
Equity, Since 31 Jan 26 | MCX4% ₹1,539 Cr 5,209,458 BSE Ltd (Financial Services)
Equity, Since 30 Nov 25 | BSE4% ₹1,451 Cr 3,500,830
↓ -256,232 6. Nippon India Pharma Fund
Nippon India Pharma Fund
Growth Launch Date 5 Jun 04 NAV (24 Jul 26) ₹556.107 ↓ -1.23 (-0.22 %) Net Assets (Cr) ₹9,044 on 30 Jun 26 Category Equity - Sectoral AMC Nippon Life Asset Management Ltd. Rating ☆☆ Risk High Expense Ratio 1.81 Sharpe Ratio 0.19 Information Ratio -1.04 Alpha Ratio -3.58 Min Investment 5,000 Min SIP Investment 100 Exit Load 0-1 Years (1%),1 Years and above(NIL) Growth of 10,000 investment over the years.
Date Value 30 Jun 21 ₹10,000 30 Jun 22 ₹8,540 30 Jun 23 ₹10,376 30 Jun 24 ₹14,608 30 Jun 25 ₹16,993 30 Jun 26 ₹18,254 Returns for Nippon India Pharma Fund
absolute basis & more than 1 year are on CAGR (Compound Annual Growth Rate) basis. as on 24 Jul 26 Duration Returns 1 Month 0.8% 3 Month 9.7% 6 Month 14.4% 1 Year 5.3% 3 Year 18.9% 5 Year 12.1% 10 Year 15 Year Since launch 19.9% Historical performance (Yearly) on absolute basis
Year Returns 2025 -3.3% 2024 34% 2023 39.2% 2022 -9.9% 2021 23.9% 2020 66.4% 2019 1.7% 2018 3.6% 2017 7.6% 2016 -10.6% Fund Manager information for Nippon India Pharma Fund
Name Since Tenure Sailesh Raj Bhan 1 Apr 05 21.26 Yr. Kinjal Desai 25 May 18 8.11 Yr. Amber Singhania 11 Mar 26 0.31 Yr. Data below for Nippon India Pharma Fund as on 30 Jun 26
Equity Sector Allocation
Sector Value Health Care 97.92% Asset Allocation
Asset Class Value Cash 2.08% Equity 97.92% Top Securities Holdings / Portfolio
Name Holding Value Quantity Sun Pharmaceuticals Industries Ltd (Healthcare)
Equity, Since 31 Oct 09 | SUNPHARMA13% ₹1,153 Cr 6,406,349 Lupin Ltd (Healthcare)
Equity, Since 31 Aug 08 | LUPIN7% ₹631 Cr 2,783,991
↓ -100,000 Dr Reddy's Laboratories Ltd (Healthcare)
Equity, Since 30 Jun 11 | DRREDDY7% ₹580 Cr 4,449,746 Cipla Ltd (Healthcare)
Equity, Since 31 May 08 | CIPLA6% ₹532 Cr 3,795,054
↑ 300,000 Divi's Laboratories Ltd (Healthcare)
Equity, Since 31 Mar 12 | DIVISLAB6% ₹501 Cr 750,754
↓ -100,000 Apollo Hospitals Enterprise Ltd (Healthcare)
Equity, Since 30 Sep 20 | APOLLOHOSP5% ₹449 Cr 548,795 Mankind Pharma Ltd (Healthcare)
Equity, Since 30 Apr 23 | MANKIND4% ₹340 Cr 1,431,195
↑ 300,000 Medplus Health Services Ltd (Healthcare)
Equity, Since 30 Nov 22 | MEDPLUS4% ₹317 Cr 3,545,229
↓ -82,048 Sai Life Sciences Ltd (Healthcare)
Equity, Since 31 Dec 24 | SAILIFE3% ₹296 Cr 2,555,745 Ajanta Pharma Ltd (Healthcare)
Equity, Since 30 Apr 22 | AJANTPHARM3% ₹277 Cr 946,323 7. Nippon India Small Cap Fund
Nippon India Small Cap Fund
Growth Launch Date 16 Sep 10 NAV (24 Jul 26) ₹177.561 ↑ 0.36 (0.20 %) Net Assets (Cr) ₹78,407 on 30 Jun 26 Category Equity - Small Cap AMC Nippon Life Asset Management Ltd. Rating ☆☆☆☆ Risk Moderately High Expense Ratio 1.44 Sharpe Ratio 0.02 Information Ratio -0.27 Alpha Ratio 3.21 Min Investment 5,000 Min SIP Investment 100 Exit Load 0-1 Years (1%),1 Years and above(NIL) Growth of 10,000 investment over the years.
Date Value 30 Jun 21 ₹10,000 30 Jun 22 ₹10,860 30 Jun 23 ₹15,169 30 Jun 24 ₹23,621 30 Jun 25 ₹24,128 30 Jun 26 ₹25,102 Returns for Nippon India Small Cap Fund
absolute basis & more than 1 year are on CAGR (Compound Annual Growth Rate) basis. as on 24 Jul 26 Duration Returns 1 Month -1.8% 3 Month 5.7% 6 Month 14.9% 1 Year 2.3% 3 Year 16.1% 5 Year 18.4% 10 Year 15 Year Since launch 19.9% Historical performance (Yearly) on absolute basis
Year Returns 2025 -4.7% 2024 26.1% 2023 48.9% 2022 6.5% 2021 74.3% 2020 29.2% 2019 -2.5% 2018 -16.7% 2017 63% 2016 5.6% Fund Manager information for Nippon India Small Cap Fund
Name Since Tenure Samir Rachh 2 Jan 17 9.5 Yr. Kinjal Desai 25 May 18 8.11 Yr. Amber Singhania 11 Mar 26 0.31 Yr. Data below for Nippon India Small Cap Fund as on 30 Jun 26
Equity Sector Allocation
Sector Value Industrials 24.65% Financial Services 15.05% Consumer Cyclical 14.19% Basic Materials 11.05% Health Care 9.49% Consumer Defensive 9.04% Technology 7.05% Utility 3.27% Communication Services 1.65% Real Estate 0.78% Energy 0.43% Asset Allocation
Asset Class Value Cash 2.9% Equity 97.1% Top Securities Holdings / Portfolio
Name Holding Value Quantity Bharat Heavy Electricals Ltd (Industrials)
Equity, Since 30 Sep 22 | BHEL2% ₹1,438 Cr 34,507,422 HDFC Bank Ltd (Financial Services)
Equity, Since 30 Apr 22 | HDFCBANK2% ₹1,322 Cr 17,754,929 TD Power Systems Ltd (Industrials)
Equity, Since 31 Dec 15 | TDPOWERSYS2% ₹1,277 Cr 9,680,747 Multi Commodity Exchange of India Ltd (Financial Services)
Equity, Since 28 Feb 21 | MCX2% ₹1,169 Cr 3,957,067
↓ -342,933 Apar Industries Ltd (Industrials)
Equity, Since 31 Mar 17 | APARINDS2% ₹1,154 Cr 879,502 State Bank of India (Financial Services)
Equity, Since 31 Oct 19 | SBIN1% ₹964 Cr 10,000,000
↑ 2,000,000 NLC India Ltd (Utilities)
Equity, Since 31 Oct 22 | NLCINDIA1% ₹938 Cr 26,990,331 Karur Vysya Bank Ltd (Financial Services)
Equity, Since 28 Feb 17 | KARURVYSYA1% ₹921 Cr 31,907,252 Zydus Wellness Ltd (Consumer Defensive)
Equity, Since 31 Aug 16 | ZYDUSWELL1% ₹876 Cr 17,273,570 Tube Investments of India Ltd Ordinary Shares (Industrials)
Equity, Since 30 Apr 18 | TIINDIA1% ₹785 Cr 2,499,222 8. Franklin India Taxshield
Franklin India Taxshield
Growth Launch Date 10 Apr 99 NAV (24 Jul 26) ₹1,406.46 ↓ -3.68 (-0.26 %) Net Assets (Cr) ₹6,166 on 30 Jun 26 Category Equity - ELSS AMC Franklin Templeton Asst Mgmt(IND)Pvt Ltd Rating ☆☆ Risk Moderately High Expense Ratio 1.81 Sharpe Ratio -0.69 Information Ratio 0.11 Alpha Ratio -5.69 Min Investment 500 Min SIP Investment 500 Exit Load NIL Growth of 10,000 investment over the years.
Date Value 30 Jun 21 ₹10,000 30 Jun 22 ₹9,904 30 Jun 23 ₹12,470 30 Jun 24 ₹18,167 30 Jun 25 ₹19,312 30 Jun 26 ₹18,123 Returns for Franklin India Taxshield
absolute basis & more than 1 year are on CAGR (Compound Annual Growth Rate) basis. as on 24 Jul 26 Duration Returns 1 Month -1.5% 3 Month 0.5% 6 Month -1.5% 1 Year -5.8% 3 Year 12% 5 Year 12.3% 10 Year 15 Year Since launch 19.9% Historical performance (Yearly) on absolute basis
Year Returns 2025 2.1% 2024 22.4% 2023 31.2% 2022 5.4% 2021 36.7% 2020 9.8% 2019 5.1% 2018 -3% 2017 29.1% 2016 4.7% Fund Manager information for Franklin India Taxshield
Name Since Tenure R. Janakiraman 2 May 16 10.17 Yr. Rajasa Kakulavarapu 1 Dec 23 2.58 Yr. Data below for Franklin India Taxshield as on 30 Jun 26
Equity Sector Allocation
Sector Value Financial Services 31.4% Industrials 14.04% Basic Materials 8.49% Consumer Cyclical 8.29% Technology 8% Consumer Defensive 5.85% Health Care 4.78% Utility 4.32% Energy 3.81% Communication Services 3.21% Real Estate 1.41% Asset Allocation
Asset Class Value Cash 6.39% Equity 93.61% Top Securities Holdings / Portfolio
Name Holding Value Quantity HDFC Bank Ltd (Financial Services)
Equity, Since 31 Mar 07 | HDFCBANK8% ₹486 Cr 6,520,834 ICICI Bank Ltd (Financial Services)
Equity, Since 31 Oct 18 | ICICIBANK7% ₹414 Cr 3,297,903 Axis Bank Ltd (Financial Services)
Equity, Since 30 Jun 14 | AXISBANK5% ₹319 Cr 2,477,634 Larsen & Toubro Ltd (Industrials)
Equity, Since 31 Dec 19 | LT5% ₹292 Cr 717,322 State Bank of India (Financial Services)
Equity, Since 31 Aug 15 | SBIN5% ₹273 Cr 2,833,344 Infosys Ltd (Technology)
Equity, Since 29 Feb 12 | INFY4% ₹222 Cr 1,911,441 Reliance Industries Ltd (Energy)
Equity, Since 31 May 22 | RELIANCE3% ₹195 Cr 1,472,922 Bharti Airtel Ltd (Communication Services)
Equity, Since 31 Jan 07 | BHARTIARTL3% ₹194 Cr 1,060,541
↓ -78,511 Kotak Mahindra Bank Ltd (Financial Services)
Equity, Since 30 Nov 17 | KOTAKBANK3% ₹191 Cr 4,981,055 Eternal Ltd (Consumer Cyclical)
Equity, Since 30 Nov 21 | ETERNAL3% ₹188 Cr 7,500,000 9. Nippon India Banking Fund
Nippon India Banking Fund
Growth Launch Date 26 May 03 NAV (24 Jul 26) ₹635.097 ↓ -1.12 (-0.18 %) Net Assets (Cr) ₹7,789 on 30 Jun 26 Category Equity - Sectoral AMC Nippon Life Asset Management Ltd. Rating ☆☆☆ Risk High Expense Ratio 1.89 Sharpe Ratio -0.18 Information Ratio 0.51 Alpha Ratio 0.84 Min Investment 5,000 Min SIP Investment 100 Exit Load 0-1 Years (1%),1 Years and above(NIL) Growth of 10,000 investment over the years.
Date Value 30 Jun 21 ₹10,000 30 Jun 22 ₹9,724 30 Jun 23 ₹13,479 30 Jun 24 ₹16,966 30 Jun 25 ₹19,602 30 Jun 26 ₹19,494 Returns for Nippon India Banking Fund
absolute basis & more than 1 year are on CAGR (Compound Annual Growth Rate) basis. as on 24 Jul 26 Duration Returns 1 Month -2.2% 3 Month 0.4% 6 Month -1.3% 1 Year -0.6% 3 Year 11.5% 5 Year 13.3% 10 Year 15 Year Since launch 19.6% Historical performance (Yearly) on absolute basis
Year Returns 2025 17.4% 2024 10.3% 2023 24.2% 2022 20.7% 2021 29.7% 2020 -10.6% 2019 10.7% 2018 -1.2% 2017 44.1% 2016 11.5% Fund Manager information for Nippon India Banking Fund
Name Since Tenure Vinay Sharma 9 Apr 18 8.23 Yr. Kinjal Desai 25 May 18 8.1 Yr. Bhavik Dave 18 Jun 21 5.04 Yr. Amber Singhania 11 Mar 26 0.3 Yr. Data below for Nippon India Banking Fund as on 30 Jun 26
Equity Sector Allocation
Sector Value Financial Services 93.81% Technology 4.36% Asset Allocation
Asset Class Value Cash 1.83% Equity 98.17% Top Securities Holdings / Portfolio
Name Holding Value Quantity ICICI Bank Ltd (Financial Services)
Equity, Since 31 Oct 09 | ICICIBANK13% ₹947 Cr 7,538,887 HDFC Bank Ltd (Financial Services)
Equity, Since 31 Jul 08 | HDFCBANK13% ₹940 Cr 12,619,320 Axis Bank Ltd (Financial Services)
Equity, Since 30 Jun 17 | AXISBANK9% ₹696 Cr 5,408,065 State Bank of India (Financial Services)
Equity, Since 31 Mar 14 | SBIN5% ₹402 Cr 4,165,352 Kotak Mahindra Bank Ltd (Financial Services)
Equity, Since 31 Jul 23 | KOTAKBANK4% ₹264 Cr 6,872,870 SBI Life Insurance Co Ltd (Financial Services)
Equity, Since 30 Nov 20 | SBILIFE3% ₹245 Cr 1,339,636
↓ -10,563 SBI Cards and Payment Services Ltd Ordinary Shares (Financial Services)
Equity, Since 31 Jul 20 | SBICARD3% ₹243 Cr 3,893,792 Bajaj Finserv Ltd (Financial Services)
Equity, Since 31 Oct 23 | BAJAJFINSV3% ₹228 Cr 1,275,773 Multi Commodity Exchange of India Ltd (Financial Services)
Equity, Since 30 Apr 24 | MCX3% ₹204 Cr 690,540 Cholamandalam Financial Holdings Ltd (Financial Services)
Equity, Since 30 Apr 19 | CHOLAHLDNG3% ₹202 Cr 1,279,877 10. ICICI Prudential Value Discovery Fund
ICICI Prudential Value Discovery Fund
Growth Launch Date 16 Aug 04 NAV (24 Jul 26) ₹456.83 ↓ -0.44 (-0.10 %) Net Assets (Cr) ₹60,198 on 30 Jun 26 Category Equity - Value AMC ICICI Prudential Asset Management Company Limited Rating ☆☆ Risk Moderately High Expense Ratio 1.55 Sharpe Ratio -0.59 Information Ratio 0.38 Alpha Ratio -3.68 Min Investment 1,000 Min SIP Investment 100 Exit Load 0-12 Months (1%),12 Months and above(NIL) Growth of 10,000 investment over the years.
Date Value 30 Jun 21 ₹10,000 30 Jun 22 ₹11,153 30 Jun 23 ₹14,062 30 Jun 24 ₹19,914 30 Jun 25 ₹22,085 30 Jun 26 ₹21,376 Returns for ICICI Prudential Value Discovery Fund
absolute basis & more than 1 year are on CAGR (Compound Annual Growth Rate) basis. as on 24 Jul 26 Duration Returns 1 Month -1.1% 3 Month -0.2% 6 Month -5% 1 Year -2.7% 3 Year 13.5% 5 Year 16% 10 Year 15 Year Since launch 19% Historical performance (Yearly) on absolute basis
Year Returns 2025 13.8% 2024 20% 2023 31.4% 2022 15% 2021 38.5% 2020 22.9% 2019 0.6% 2018 -4.2% 2017 23.8% 2016 4.6% Fund Manager information for ICICI Prudential Value Discovery Fund
Name Since Tenure Sankaran Naren 18 Jan 21 5.45 Yr. Dharmesh Kakkad 18 Jan 21 5.45 Yr. Sharmila D'Silva 30 Jun 22 4.01 Yr. Masoomi Jhurmarvala 4 Nov 24 1.65 Yr. Data below for ICICI Prudential Value Discovery Fund as on 30 Jun 26
Equity Sector Allocation
Sector Value Financial Services 35.8% Technology 11.03% Health Care 9.95% Consumer Defensive 9.04% Consumer Cyclical 8.64% Energy 6.91% Basic Materials 6.1% Utility 3.37% Industrials 2.8% Communication Services 1.93% Asset Allocation
Asset Class Value Cash 4.24% Equity 95.76% Top Securities Holdings / Portfolio
Name Holding Value Quantity HDFC Bank Ltd (Financial Services)
Equity, Since 30 Jun 21 | HDFCBANK9% ₹5,378 Cr 72,226,397
↑ 1,360,770 ICICI Bank Ltd (Financial Services)
Equity, Since 28 Feb 21 | ICICIBANK9% ₹5,321 Cr 42,350,921
↑ 2,541,700 Infosys Ltd (Technology)
Equity, Since 30 Sep 14 | INFY6% ₹3,638 Cr 31,339,613
↑ 1,200,000 ITC Ltd (Consumer Defensive)
Equity, Since 30 Sep 17 | ITC5% ₹2,877 Cr 100,277,455 Reliance Industries Ltd (Energy)
Equity, Since 31 Jan 23 | RELIANCE5% ₹2,840 Cr 21,496,674
↑ 239,391 Sun Pharmaceuticals Industries Ltd (Healthcare)
Equity, Since 31 May 16 | SUNPHARMA5% ₹2,784 Cr 15,472,731 Tata Consultancy Services Ltd (Technology)
Equity, Since 28 Feb 25 | TCS4% ₹2,153 Cr 9,530,056 Maruti Suzuki India Ltd (Consumer Cyclical)
Equity, Since 31 Dec 22 | MARUTI3% ₹1,986 Cr 1,513,196
↑ 347,526 Axis Bank Ltd (Financial Services)
Equity, Since 31 Aug 20 | AXISBANK3% ₹1,762 Cr 13,691,763 Hindustan Unilever Ltd (Consumer Defensive)
Equity, Since 31 Aug 23 | HINDUNILVR3% ₹1,757 Cr 8,158,332
یہاں فراہم کردہ معلومات کے درست ہونے کو یقینی بنانے کے لیے تمام کوششیں کی گئی ہیں۔ تاہم، ڈیٹا کی درستگی کے حوالے سے کوئی ضمانت نہیں دی جاتی ہے۔ براہ کرم کوئی بھی سرمایہ کاری کرنے سے پہلے اسکیم کی معلومات کے دستاویز کے ساتھ تصدیق کریں۔
?")


AMFI Registration No. 112358 | CIN: U74999MH2016PTC282153
Shepard Technologies Pvt. Ltd. (with ARN code 112358) makes no warranties or representations, express or implied, on products offered through the platform. It accepts no liability for any damages or losses, however caused, in connection with the use of, or on the reliance of its product or related services. Terms and conditions of the website are applicable.
©2026 Shepard Technologies Private Limited. All Rights Reserved
Research Highlights for Sundaram Mid Cap Fund