Retirement Calculator: Evaluate and Invest
retirement calculator is a tool for those who are eager to know about the corpus required post retirement to maintain a certain standard of living. Retirement calculator is considered as an essential element when Planning for retirement. It helps you to identify the estimated amount that you need to save for your retirement based on your current financial situations. Therefore, we take you through a very simple retirement calculator that will help you to evaluate the corpus needed when you retire.
Understanding Retirement Calculator
While using a retirement calculator, you would need to enter certain variables, such as-
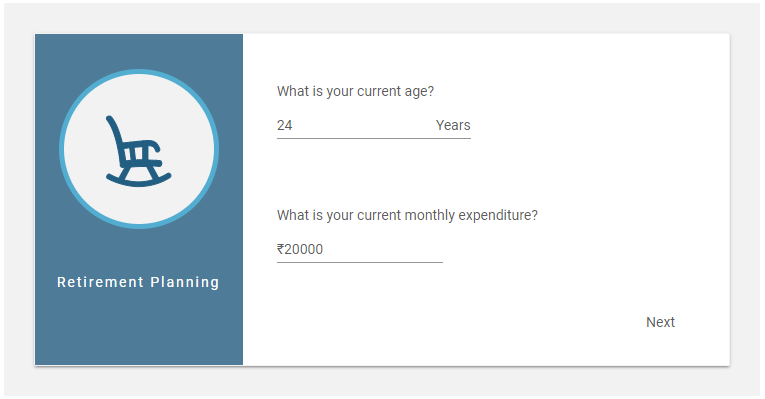
- Your current age
- Your current monthly expenses
- Expected inflation rate (annual) for the years to come
- Long-term growth rate on investments
All these variables when fed into the calculator would end up giving the amount that you need to invest monthly for your retirement to maintain the standard of living. (i.e. your current monthly living expenses adjusted for inflation).
Retirement Calculator: Evaluation Process
1. Calculating your Current Monthly Expenses
The first thing that you need to do here is, calculate your monthly expenses like household expenses, utility expenses, transportation cost, and other lifestyle expenses. Other than this, you should have a rough idea about the minimum amount that you require monthly for miscellaneous expenses. The basic assumption here is that these expenses adjusted for inflation should suffice in the future to lead a comfortable post retired life.
*To illustrate- *
- Household expenses – INR 10,000
- Transportation expenses- INR 2,000
- Utility expenses-** INR 3,000**
- Other lifestyle expenses (movies, dining, etc.) - INR 3,000
- Miscellaneous expense- INR 2000
Total Monthly Expenses- INR 20,000
Know Your Monthly SIP Amount
2. Understand Inflation Rate for Coming Years
This is the average annual inflation rate that you expect in coming years till you retire. According to various market sources, the average inflation can be taken to be around 4-5% p.a. in the coming years. However, one can enter their own assumption also.
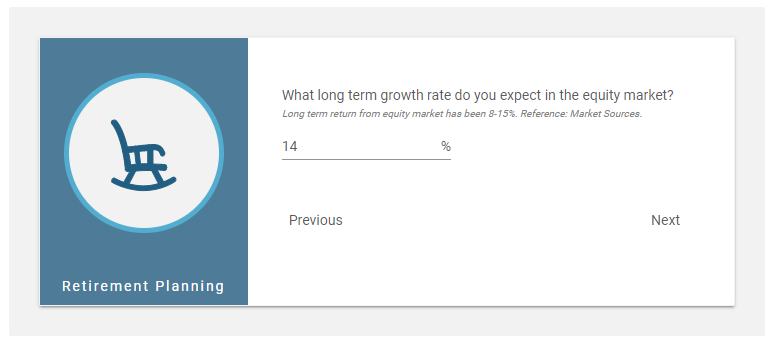
3. Long Term Growth Rate of Investments
This is long-term growth rate that you expect on your investments. Though the long-term return from the equity market has been 8-15% historically, according to market sources, going forward one can expect around 8-15% p.a. in the long run. If you have sound knowledge about the markets, you can enter your own assumptions on the growth rate.
Talk to our investment specialist
4. Investment Evaluation
Now comes the interesting part where you get the desired amount that you need to invest monthly. Taking the above variables into consideration, you will get the desired corpus that you need to save monthly till you get retired. Here the estimated age for retirement is considered as 60 years (refer to the image below).
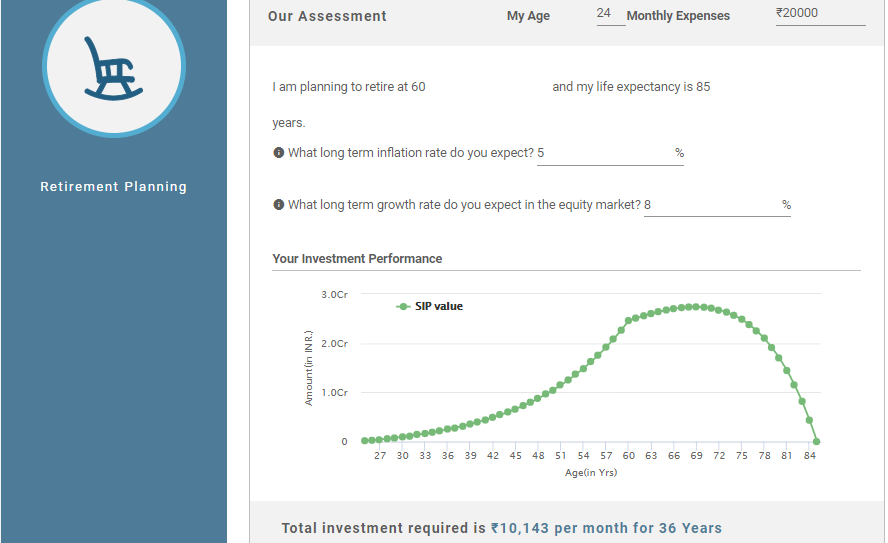
5. Total Corpus
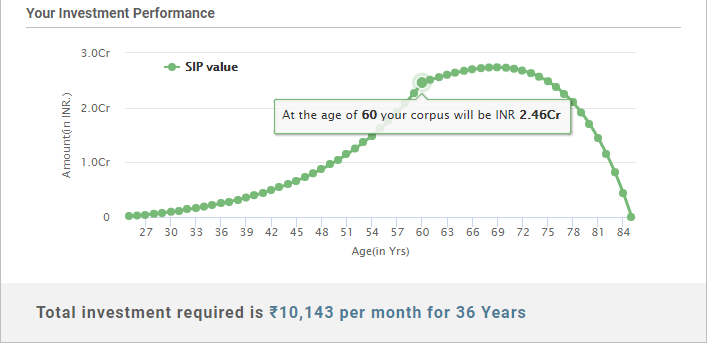
By this, we mean how much corpus will be accumulated when you invest for 36 years, meaning if you start Investing at the age of 24 till 60 years of age. To reach the desired corpus, you need to make a monthly investment. According to the aforementioned figures, the total investment required every month is INR 10,143 for 36 years. As indicated, the estimated total corpus will depend on your current age, current monthly expenses, inflation and the growth rate on investment expected over the years.
Conclusion- People who are planning for their retirement can use this calculator, through which you can easily estimate your retirement corpus. It will help you calculate approximately the amount needed for retirement and hence, you can plan your investment accordingly!
Fund Selection Methodology used to find 2 funds
Top Funds for 2026
*Best funds based on 5 year performance.
"The primary investment objective of the Scheme is to seek capital appreciation by investing predominantly in units of MLIIF - WGF. The Scheme may, at the discretion of the Investment Manager, also invest in the units of other similar overseas mutual fund schemes, which may constitute a significant part of its corpus. The Scheme may also invest a certain portion of its corpus in money market securities and/or units of money market/liquid schemes of DSP Merrill Lynch Mutual Fund, in order to meet liquidity requirements from time to time. However, there is no assurance that the investment objective of the Scheme will be realized." Below is the key information for DSP World Gold Fund Returns up to 1 year are on The investment objective of the scheme is to provide long term growth from a portfolio of equity / equity related instruments of companies engaged either directly or indirectly in the infrastructure sector. Research Highlights for LIC MF Infrastructure Fund Below is the key information for LIC MF Infrastructure Fund Returns up to 1 year are on 1. DSP World Gold Fund
DSP World Gold Fund
Growth Launch Date 14 Sep 07 NAV (27 Jul 26) ₹50.5929 ↑ 0.21 (0.42 %) Net Assets (Cr) ₹1,433 on 30 Jun 26 Category Equity - Global AMC DSP BlackRock Invmt Managers Pvt. Ltd. Rating ☆☆☆ Risk High Expense Ratio 1.41 Sharpe Ratio 1.22 Information Ratio -0.5 Alpha Ratio 2.12 Min Investment 1,000 Min SIP Investment 500 Exit Load 0-12 Months (1%),12 Months and above(NIL) Growth of 10,000 investment over the years.
Date Value 30 Jun 21 ₹10,000 30 Jun 22 ₹8,181 30 Jun 23 ₹9,294 30 Jun 24 ₹10,640 30 Jun 25 ₹16,808 30 Jun 26 ₹27,693 Returns for DSP World Gold Fund
absolute basis & more than 1 year are on CAGR (Compound Annual Growth Rate) basis. as on 27 Jul 26 Duration Returns 1 Month 2.9% 3 Month -16.1% 6 Month -23.5% 1 Year 60.9% 3 Year 43.8% 5 Year 23.4% 10 Year 15 Year Since launch 9% Historical performance (Yearly) on absolute basis
Year Returns 2025 167.1% 2024 15.9% 2023 7% 2022 -7.7% 2021 -9% 2020 31.4% 2019 35.1% 2018 -10.7% 2017 -4% 2016 52.7% Fund Manager information for DSP World Gold Fund
Name Since Tenure Kaivalya Nadkarni 1 May 25 1.17 Yr. Data below for DSP World Gold Fund as on 30 Jun 26
Equity Sector Allocation
Sector Value Basic Materials 94.47% Asset Allocation
Asset Class Value Cash 3.62% Equity 94.47% Debt 0% Other 1.91% Top Securities Holdings / Portfolio
Name Holding Value Quantity BGF World Gold I2
Investment Fund | -68% ₹1,141 Cr 1,005,044 VanEck Gold Miners ETF
- | GDX29% ₹490 Cr 573,719 Treps / Reverse Repo Investments
CBLO/Reverse Repo | -3% ₹54 Cr Net Receivables/Payables
Net Current Assets | -0% -₹6 Cr 2. LIC MF Infrastructure Fund
LIC MF Infrastructure Fund
Growth Launch Date 29 Feb 08 NAV (28 Jul 26) ₹53.5882 ↓ -0.34 (-0.63 %) Net Assets (Cr) ₹1,137 on 30 Jun 26 Category Equity - Sectoral AMC LIC Mutual Fund Asset Mgmt Co Ltd Rating Risk High Expense Ratio 2.21 Sharpe Ratio 0.22 Information Ratio 0.58 Alpha Ratio 8.41 Min Investment 5,000 Min SIP Investment 1,000 Exit Load 0-1 Years (1%),1 Years and above(NIL) Growth of 10,000 investment over the years.
Date Value 30 Jun 21 ₹10,000 30 Jun 22 ₹11,137 30 Jun 23 ₹14,179 30 Jun 24 ₹26,268 30 Jun 25 ₹26,896 30 Jun 26 ₹29,151 Returns for LIC MF Infrastructure Fund
absolute basis & more than 1 year are on CAGR (Compound Annual Growth Rate) basis. as on 27 Jul 26 Duration Returns 1 Month -2.8% 3 Month 3% 6 Month 14.1% 1 Year 9.5% 3 Year 24.3% 5 Year 22.2% 10 Year 15 Year Since launch 9.5% Historical performance (Yearly) on absolute basis
Year Returns 2025 -3.7% 2024 47.8% 2023 44.4% 2022 7.9% 2021 46.6% 2020 -0.1% 2019 13.3% 2018 -14.6% 2017 42.2% 2016 -2.2% Fund Manager information for LIC MF Infrastructure Fund
Name Since Tenure Sumit Bhatnagar 7 Apr 26 0.23 Yr. Mahesh Bendre 1 Jul 24 2 Yr. Data below for LIC MF Infrastructure Fund as on 30 Jun 26
Equity Sector Allocation
Sector Value Industrials 37.05% Consumer Cyclical 20.88% Basic Materials 12.42% Utility 11.88% Communication Services 5.02% Financial Services 3.98% Real Estate 1.97% Health Care 1.89% Technology 1.08% Asset Allocation
Asset Class Value Cash 3.82% Equity 96.18% Top Securities Holdings / Portfolio
Name Holding Value Quantity Larsen & Toubro Ltd (Industrials)
Equity, Since 30 Apr 09 | LT4% ₹44 Cr 106,968
↓ -10,884 Garware Hi-Tech Films Ltd (Basic Materials)
Equity, Since 31 Aug 23 | 5006554% ₹40 Cr 65,325
↓ -7,684 Tata Motors Passenger Vehicles Ltd (Consumer Cyclical)
Equity, Since 28 Feb 26 | TMPV4% ₹39 Cr 982,891
↓ -332,760 Tata Motors Ltd (Consumer Cyclical)
Equity, Since 31 Oct 25 | TMCV4% ₹39 Cr 1,015,933
↑ 26,983 Tata Power Co Ltd (Utilities)
Equity, Since 29 Feb 24 | TATAPOWER3% ₹36 Cr 861,040
↑ 524,312 KSH International Ltd (Industrials)
Equity, Since 31 Dec 25 | KSHINTL3% ₹34 Cr 432,816
↑ 6,280 Siemens Energy India Ltd (Utilities)
Equity, Since 31 Aug 25 | ENRIN3% ₹34 Cr 87,106
↑ 24,800 JSW Infrastructure Ltd (Industrials)
Equity, Since 30 Apr 26 | JSWINFRA3% ₹31 Cr 1,133,858
↑ 745,681 Carraro India Ltd (Consumer Cyclical)
Equity, Since 31 Dec 24 | CARRARO3% ₹31 Cr 572,991 Bharat Dynamics Ltd Ordinary Shares (Industrials)
Equity, Since 31 Jan 26 | BDL3% ₹29 Cr 242,954
↑ 157,744
All efforts have been made to ensure the information provided here is accurate. However, no guarantees are made regarding correctness of data. Please verify with scheme information document before making any investment.


AMFI Registration No. 112358 | CIN: U74999MH2016PTC282153
Shepard Technologies Pvt. Ltd. (with ARN code 112358) makes no warranties or representations, express or implied, on products offered through the platform. It accepts no liability for any damages or losses, however caused, in connection with the use of, or on the reliance of its product or related services. Terms and conditions of the website are applicable.
©2026 Shepard Technologies Private Limited. All Rights Reserved
Research Highlights for DSP World Gold Fund