മികച്ച മിഡ് ക്യാപ് മ്യൂച്വൽ ഫണ്ടുകൾ 2022
മികച്ച മിഡ് ക്യാപ്പിനായി തിരയുന്നുമ്യൂച്വൽ ഫണ്ടുകൾ 2022 ൽ നിക്ഷേപിക്കണോ? ശരി, പല നിക്ഷേപകരും ഇതിലേക്ക് ചായുന്നുനിക്ഷേപിക്കുന്നു മിഡ് ക്യാപ്സിൽ, കാരണം അവ ഭാവിയായി കണക്കാക്കപ്പെടുന്നുവിപണി നേതാക്കൾ. എപ്പോൾ ഒരുനിക്ഷേപകൻ ദീർഘകാലത്തേക്ക് മിഡ് ക്യാപ്സിൽ നിക്ഷേപിക്കുന്നു, നാളത്തെ റൺവേ വിജയങ്ങളാണെന്ന് അവർ കരുതുന്ന കമ്പനികളെയാണ് അവർ ഇഷ്ടപ്പെടുന്നത്.
പരമ്പരാഗതമായി, മിഡ്-ക്യാപ്പുകൾ സാധാരണയായി ഇടത്തരം കമ്പനികളാണ്, അവ നന്നായി പ്രവർത്തിക്കുകയും നല്ല ബിസിനസ്സ് തന്ത്രം ഉണ്ടെങ്കിൽ നാളത്തെ നേതാക്കളോ വലിയ ക്യാപ്സോ ആയി മാറുകയും ചെയ്യുന്നു (ചില രാജ്യങ്ങൾ പോലും.വിളി അവ ഭീമൻ തൊപ്പികൾ).
ശരിയായ ബിസിനസ്സ് തന്ത്രം, നിർവ്വഹണത്തിനുള്ള നല്ല മാനേജ്മെന്റ്, മാറ്റങ്ങളോട് മിടുക്ക് എന്നിവ ഉപയോഗിച്ച് മിഡ്-ക്യാപ് കമ്പനികൾ അതിവേഗം വളരും. ലാർജ് ക്യാപ്പുകളേക്കാൾ ഉയർന്ന നേട്ടം കൊയ്യാൻ ആഗ്രഹിക്കുന്ന നിക്ഷേപകർ മിഡ് ക്യാപ്സിലേക്ക് നിക്ഷേപത്തിനായി നോക്കുന്നു, എന്നിരുന്നാലും ഇത് ഉയർന്ന റിസ്ക് (അല്ലെങ്കിൽ അസ്ഥിരത) കൊണ്ട് വരുന്നു.
മ്യൂച്വൽ ഫണ്ടുകളും ഫോറിൻ ഇൻസ്റ്റിറ്റ്യൂഷണൽ ഇൻവെസ്റ്റേഴ്സും (എഫ്ഐഐ) പോലുള്ള സ്ഥാപന നിക്ഷേപകർ ടോപ്പ് മിഡ് ക്യാപ്സിലും,മിഡ് ക്യാപ് ഫണ്ടുകൾ ഇക്വിറ്റി മാർക്കറ്റുകളിൽ അവരുടെ നേട്ടങ്ങൾ വർദ്ധിപ്പിക്കുന്നതിന്.
നിങ്ങൾ എന്തിന് മിഡ് ക്യാപ് ഫണ്ടുകളിൽ നിക്ഷേപിക്കണം
ചിലനിക്ഷേപത്തിന്റെ നേട്ടങ്ങൾ മിഡ് ക്യാപ് ഫണ്ടുകളിൽ ഇവയാണ്:
- ദീർഘകാല ഹോൾഡിംഗ് നൽകിയിട്ടുള്ള വലിയ തൊപ്പികളുമായി താരതമ്യപ്പെടുത്തുമ്പോൾ അവർക്ക് ശക്തമായ സമ്പത്ത് വഹിക്കാനുള്ള ശേഷിയുണ്ട്; ബുള്ളിഷ് മാർക്കറ്റുകളിലും വിപണികൾ വളരെക്കാലമായി ഉയർച്ചയിലായിരിക്കുമ്പോഴും അവ സാധാരണയായി രണ്ടാമത്തേതിനേക്കാൾ മികച്ച പ്രകടനം കാഴ്ചവയ്ക്കുന്നു.
- മിഡ് ക്യാപ് കമ്പനികൾക്ക് ലാർജ് ക്യാപ്സിനേക്കാൾ വളർച്ചയ്ക്ക് കൂടുതൽ സാധ്യതയുണ്ട്.
- അത്തരം സ്ഥാപനങ്ങൾ വിപണിയിലെ പുതിയ കണ്ടുപിടിത്തങ്ങളോടും മാറ്റങ്ങളോടും വേഗത്തിൽ പ്രതികരിക്കുന്നു, കാരണം അവർ കൂടുതൽ ശ്രദ്ധ കേന്ദ്രീകരിക്കുകയും അവരുടെ ഇടത്തിൽ പ്രത്യേകം ശ്രദ്ധിക്കുകയും വേഗതയേറിയ പാദങ്ങളുള്ളവരുമാണ്.
- മിഡ് ക്യാപ് ഓഹരികൾ ചാഞ്ചാട്ടത്തിൽ കുറവാണ്ചെറിയ തൊപ്പി ഓഹരികൾ.
- വേഗത്തിൽ വളരാനുള്ള അവരുടെ കഴിവ് കാരണം, അവ പലപ്പോഴും മികച്ച പ്രകടനം കാഴ്ചവയ്ക്കുന്നുവലിയ ക്യാപ് ഫണ്ടുകൾ ഒരു നീണ്ട കാലയളവിൽ.
Talk to our investment specialist
മിഡ്ക്യാപ് ഫണ്ടുകളുടെ പ്രയോജനങ്ങൾ
നമ്മൾ ദീർഘകാലത്തേക്ക് പരിഗണിക്കുകയാണെങ്കിൽമ്യൂച്വൽ ഫണ്ടുകളുടെ ചരിത്രം, പിന്നീട് മിഡ്-ക്യാപ് ഫണ്ടുകൾ സ്ഥിരമായി വലിയ ക്യാപ് ഫണ്ടുകളെ മറികടക്കുന്നു. വാസ്തവത്തിൽ, ഫണ്ടിന്റെ സ്വഭാവം തന്നെ അതിന്റെ പ്രവണത ഉടൻ മാറാൻ സാധ്യതയില്ല എന്നതാണ്.
വലിയ ക്യാപ് ഫണ്ടുകളുമായി താരതമ്യപ്പെടുത്തുമ്പോൾ മിഡ് ക്യാപ് ഫണ്ടുകൾ സ്റ്റോക്ക് മാർക്കറ്റുകളിൽ താരതമ്യേന കുറവാണ്. ഈ ഫണ്ടുകൾ ഉപയോഗിച്ച് നിക്ഷേപകർക്ക് അവരുടെ നിക്ഷേപങ്ങളിൽ അതിവേഗ വളർച്ച നേടാനുള്ള വലിയ അവസരം ഇത് നൽകുന്നു.
22-23 സാമ്പത്തിക വർഷത്തിൽ നിക്ഷേപിക്കുന്നതിനുള്ള മികച്ച 11 മികച്ച മിഡ് ക്യാപ് മ്യൂച്വൽ ഫണ്ടുകൾ
Fund NAV Net Assets (Cr) 3 MO (%) 6 MO (%) 1 YR (%) 3 YR (%) 5 YR (%) 2025 (%) Motilal Oswal Midcap 30 Fund Growth ₹99.0958
↑ 0.12 ₹36,458 6.8 1.7 -4.2 18.7 21.9 -12.1 Invesco India Mid Cap Fund Growth ₹198.01
↓ -0.13 ₹12,397 10.6 10.8 8 24.6 19.4 6.3 Edelweiss Mid Cap Fund Growth ₹107.698
↓ -0.06 ₹16,849 4.7 4.7 5.3 22.1 17.9 3.8 Sundaram Mid Cap Fund Growth ₹1,487.44
↓ -3.81 ₹13,687 4.8 5.9 6.4 20.7 17.7 4.1 ICICI Prudential MidCap Fund Growth ₹336.27
↓ -2.16 ₹7,789 2.6 8 10.5 22.7 17.1 11.1 TATA Mid Cap Growth Fund Growth ₹463.785
↓ -0.11 ₹5,732 4.6 4.1 5.2 17.7 15.7 5.8 BNP Paribas Mid Cap Fund Growth ₹111.506
↓ -0.21 ₹2,461 5.2 7.8 9.9 18.5 15.2 2.5 Aditya Birla Sun Life Midcap Fund Growth ₹839.6
↓ -0.70 ₹6,398 6.2 6 4.4 17.4 14.9 4.4 Franklin India Prima Fund Growth ₹2,821.03
↑ 6.33 ₹12,231 5.3 2.7 0 17.7 14.5 1.6 SBI Magnum Mid Cap Fund Growth ₹243.281
↓ -1.48 ₹23,417 4.6 4.5 1.2 12.4 14.3 0.4 Axis Mid Cap Fund Growth ₹120.15
↓ -0.08 ₹32,852 5.2 8.4 5.2 16.9 13.9 1 Note: Returns up to 1 year are on absolute basis & more than 1 year are on CAGR basis. as on 17 Jul 26 Research Highlights & Commentary of 11 Funds showcased
Commentary Motilal Oswal Midcap 30 Fund Invesco India Mid Cap Fund Edelweiss Mid Cap Fund Sundaram Mid Cap Fund ICICI Prudential MidCap Fund TATA Mid Cap Growth Fund BNP Paribas Mid Cap Fund Aditya Birla Sun Life Midcap Fund Franklin India Prima Fund SBI Magnum Mid Cap Fund Axis Mid Cap Fund Point 1 Highest AUM (₹36,458 Cr). Lower mid AUM (₹12,397 Cr). Upper mid AUM (₹16,849 Cr). Upper mid AUM (₹13,687 Cr). Lower mid AUM (₹7,789 Cr). Bottom quartile AUM (₹5,732 Cr). Bottom quartile AUM (₹2,461 Cr). Bottom quartile AUM (₹6,398 Cr). Lower mid AUM (₹12,231 Cr). Upper mid AUM (₹23,417 Cr). Top quartile AUM (₹32,852 Cr). Point 2 Established history (12+ yrs). Established history (19+ yrs). Established history (18+ yrs). Established history (23+ yrs). Established history (21+ yrs). Oldest track record among peers (32 yrs). Established history (20+ yrs). Established history (23+ yrs). Established history (32+ yrs). Established history (21+ yrs). Established history (15+ yrs). Point 3 Rating: 3★ (top quartile). Rating: 2★ (bottom quartile). Rating: 3★ (upper mid). Top rated. Rating: 2★ (lower mid). Rating: 2★ (bottom quartile). Rating: 3★ (upper mid). Rating: 3★ (upper mid). Rating: 3★ (lower mid). Rating: 3★ (lower mid). Rating: 1★ (bottom quartile). Point 4 Risk profile: Moderately High. Risk profile: Moderately High. Risk profile: High. Risk profile: Moderately High. Risk profile: Moderately High. Risk profile: Moderately High. Risk profile: High. Risk profile: Moderately High. Risk profile: Moderately High. Risk profile: Moderately High. Risk profile: Moderately High. Point 5 5Y return: 21.90% (top quartile). 5Y return: 19.41% (top quartile). 5Y return: 17.93% (upper mid). 5Y return: 17.68% (upper mid). 5Y return: 17.10% (upper mid). 5Y return: 15.67% (lower mid). 5Y return: 15.18% (lower mid). 5Y return: 14.94% (lower mid). 5Y return: 14.50% (bottom quartile). 5Y return: 14.26% (bottom quartile). 5Y return: 13.86% (bottom quartile). Point 6 3Y return: 18.68% (upper mid). 3Y return: 24.56% (top quartile). 3Y return: 22.05% (upper mid). 3Y return: 20.74% (upper mid). 3Y return: 22.69% (top quartile). 3Y return: 17.75% (lower mid). 3Y return: 18.47% (lower mid). 3Y return: 17.44% (bottom quartile). 3Y return: 17.70% (lower mid). 3Y return: 12.44% (bottom quartile). 3Y return: 16.89% (bottom quartile). Point 7 1Y return: -4.16% (bottom quartile). 1Y return: 8.01% (upper mid). 1Y return: 5.29% (upper mid). 1Y return: 6.41% (upper mid). 1Y return: 10.54% (top quartile). 1Y return: 5.22% (lower mid). 1Y return: 9.87% (top quartile). 1Y return: 4.40% (lower mid). 1Y return: -0.02% (bottom quartile). 1Y return: 1.21% (bottom quartile). 1Y return: 5.18% (lower mid). Point 8 Alpha: -14.76 (bottom quartile). Alpha: 0.00 (lower mid). Alpha: 0.35 (upper mid). Alpha: -0.11 (lower mid). Alpha: 9.08 (top quartile). Alpha: 0.38 (upper mid). Alpha: 2.64 (top quartile). Alpha: -1.82 (lower mid). Alpha: -7.49 (bottom quartile). Alpha: -6.46 (bottom quartile). Alpha: 0.00 (upper mid). Point 9 Sharpe: -0.55 (bottom quartile). Sharpe: 0.21 (upper mid). Sharpe: 0.19 (upper mid). Sharpe: 0.17 (lower mid). Sharpe: 0.61 (top quartile). Sharpe: 0.20 (upper mid). Sharpe: 0.34 (top quartile). Sharpe: 0.09 (lower mid). Sharpe: -0.22 (bottom quartile). Sharpe: -0.15 (bottom quartile). Sharpe: 0.08 (lower mid). Point 10 Information ratio: -0.36 (lower mid). Information ratio: 0.00 (upper mid). Information ratio: 0.30 (top quartile). Information ratio: 0.23 (upper mid). Information ratio: 0.84 (top quartile). Information ratio: -0.87 (bottom quartile). Information ratio: -0.33 (lower mid). Information ratio: -0.78 (lower mid). Information ratio: -0.90 (bottom quartile). Information ratio: -1.62 (bottom quartile). Information ratio: 0.00 (upper mid). Motilal Oswal Midcap 30 Fund
Invesco India Mid Cap Fund
Edelweiss Mid Cap Fund
Sundaram Mid Cap Fund
ICICI Prudential MidCap Fund
TATA Mid Cap Growth Fund
BNP Paribas Mid Cap Fund
Aditya Birla Sun Life Midcap Fund
Franklin India Prima Fund
SBI Magnum Mid Cap Fund
Axis Mid Cap Fund
*മുകളിലുള്ളവരുടെ പട്ടികമിഡ് ക്യാപ് മിനിമം ഉള്ള മ്യൂച്വൽ ഫണ്ടുകൾ200 കോടി അറ്റ ആസ്തികൾ / മാനേജ്മെന്റിന് കീഴിലുള്ള അസറ്റുകൾ (AUM), ക്രമീകരിച്ചത്5 വർഷംസിഎജിആർ മടങ്ങുക.
(Erstwhile Motilal Oswal MOSt Focused Midcap 30 Fund) The investment objective of the Scheme is to achieve long term capital appreciation by investing in a maximum of 30 quality mid-cap companies having long-term competitive advantages and potential for growth. However, there can be no assurance or guarantee that the investment objective of the Scheme would be achieved. Below is the key information for Motilal Oswal Midcap 30 Fund Returns up to 1 year are on The Scheme seeks to provide long term capital appreciation by investing in a portfolio that is predominantly constituted of equity and equity related instruments of mid cap companies. However, there can be no assurance that the funds objectives will be achieved. Research Highlights for Invesco India Mid Cap Fund Below is the key information for Invesco India Mid Cap Fund Returns up to 1 year are on (Erstwhile Edelweiss Mid and Small Cap Fund ) The investment objective is to seek to generate long-term capital appreciation from a portfolio that predominantly invests in equity and equity-related securities of Mid Cap companies.
However, there can be no assurance that the investment objective of the Scheme will be realised. Research Highlights for Edelweiss Mid Cap Fund Below is the key information for Edelweiss Mid Cap Fund Returns up to 1 year are on (Erstwhile Sundaram Select Midcap Fund) To achieve capital appreciation by investing
in diversified stocks that are generally termed
as mid-caps. Research Highlights for Sundaram Mid Cap Fund Below is the key information for Sundaram Mid Cap Fund Returns up to 1 year are on To generate capital appreciation by actively investing in diversified mid cap stocks. Research Highlights for ICICI Prudential MidCap Fund Below is the key information for ICICI Prudential MidCap Fund Returns up to 1 year are on To provide income distribution and / or medium to long term capital gains. Investments would be focused towards mid-cap stocks. Research Highlights for TATA Mid Cap Growth Fund Below is the key information for TATA Mid Cap Growth Fund Returns up to 1 year are on The Investment objective of the scheme is to seek to generate long-term capital appreciation by investing primarily in companies with high growth opportunities in
the middle and small capitalization segment, defi ned as ‘Future Leaders’. The fund will emphasize on companies that appear to offer opportunities for long-term growth and will be inclined towards companies that are driven by dynamic style of management and entrepreneurial fl air. However, there can be no assurance that the investment objectives of the Scheme will be realized. The Scheme does not guarantee/indicate any returns. Research Highlights for BNP Paribas Mid Cap Fund Below is the key information for BNP Paribas Mid Cap Fund Returns up to 1 year are on An Open ended Growth Scheme with the objective to achieve long term growth of capital at controlled level of risk by investing primarily in ‘Mid-Cap’ Stocks. The level of risk is somewhat higher than a fund focused on large and liquid stocks. Concomitantly, the aim is to generate higher returns than a fund focused on large and liquid stocks. Research Highlights for Aditya Birla Sun Life Midcap Fund Below is the key information for Aditya Birla Sun Life Midcap Fund Returns up to 1 year are on The investment objective of Prima Fund is to provide medium to longterm capital appreciation as a primary objective and income as a secondary objective. Research Highlights for Franklin India Prima Fund Below is the key information for Franklin India Prima Fund Returns up to 1 year are on To provide investors with opportunities for long-term growth in capital along with the liquidity of an open-ended scheme by investing predominantly in a well diversified basket of equity stocks of Midcap companies. Research Highlights for SBI Magnum Mid Cap Fund Below is the key information for SBI Magnum Mid Cap Fund Returns up to 1 year are on To achieve long term capital appreciation by investing predominantly in equity & equity related instruments of mid size companies. The focus of the fund would be to invest in relatively larger companies within this category. Research Highlights for Axis Mid Cap Fund Below is the key information for Axis Mid Cap Fund Returns up to 1 year are on 1. Motilal Oswal Midcap 30 Fund
Motilal Oswal Midcap 30 Fund
Growth Launch Date 24 Feb 14 NAV (17 Jul 26) ₹99.0958 ↑ 0.12 (0.12 %) Net Assets (Cr) ₹36,458 on 31 May 26 Category Equity - Mid Cap AMC Motilal Oswal Asset Management Co. Ltd Rating ☆☆☆ Risk Moderately High Expense Ratio 1.56 Sharpe Ratio -0.55 Information Ratio -0.36 Alpha Ratio -14.76 Min Investment 5,000 Min SIP Investment 500 Exit Load 0-1 Years (1%),1 Years and above(NIL) Growth of 10,000 investment over the years.
Date Value 30 Jun 21 ₹10,000 30 Jun 22 ₹11,908 30 Jun 23 ₹16,418 30 Jun 24 ₹26,938 30 Jun 25 ₹29,503 30 Jun 26 ₹26,510 Returns for Motilal Oswal Midcap 30 Fund
absolute basis & more than 1 year are on CAGR (Compound Annual Growth Rate) basis. as on 17 Jul 26 Duration Returns 1 Month 5% 3 Month 6.8% 6 Month 1.7% 1 Year -4.2% 3 Year 18.7% 5 Year 21.9% 10 Year 15 Year Since launch 20.3% Historical performance (Yearly) on absolute basis
Year Returns 2025 -12.1% 2024 57.1% 2023 41.7% 2022 10.7% 2021 55.8% 2020 9.3% 2019 9.7% 2018 -12.7% 2017 30.8% 2016 5.2% Fund Manager information for Motilal Oswal Midcap 30 Fund
Name Since Tenure Varun Sharma 21 Jan 26 0.44 Yr. Swapnil Mayekar 18 Nov 25 0.62 Yr. Ajay Khandelwal 1 Oct 24 1.75 Yr. Ankit Agarwal 21 Jan 26 0.44 Yr. Rakesh Shetty 22 Nov 22 3.61 Yr. Data below for Motilal Oswal Midcap 30 Fund as on 31 May 26
Equity Sector Allocation
Sector Value Financial Services 31.02% Technology 26.84% Industrials 13.76% Consumer Cyclical 13.41% Communication Services 3.08% Real Estate 2.81% Health Care 2.46% Asset Allocation
Asset Class Value Cash 6.63% Equity 93.37% Top Securities Holdings / Portfolio
Name Holding Value Quantity One97 Communications Ltd (Technology)
Equity, Since 30 Sep 24 | PAYTM7% ₹2,659 Cr 23,765,865 Coforge Ltd (Technology)
Equity, Since 31 Mar 23 | COFORGE6% ₹2,233 Cr 15,703,312
↓ -979,603 Kalyan Jewellers India Ltd (Consumer Cyclical)
Equity, Since 29 Feb 24 | KALYANKJIL6% ₹2,180 Cr 61,413,395 KEI Industries Ltd (Industrials)
Equity, Since 30 Nov 24 | KEI6% ₹2,123 Cr 4,030,834 Eternal Ltd (Consumer Cyclical)
Equity, Since 31 Aug 25 | ETERNAL6% ₹2,115 Cr 84,386,866 Persistent Systems Ltd (Technology)
Equity, Since 31 Jan 23 | PERSISTENT6% ₹2,091 Cr 4,026,493 Aditya Birla Capital Ltd (Financial Services)
Equity, Since 30 Jun 25 | ABCAPITAL5% ₹1,906 Cr 52,459,381
↓ -1,000,000 Billionbrains Garage Ventures Ltd (Financial Services)
Equity, Since 31 Jan 26 | GROWW4% ₹1,564 Cr 84,616,660 Multi Commodity Exchange of India Ltd (Financial Services)
Equity, Since 31 Jan 26 | MCX4% ₹1,539 Cr 5,209,458 BSE Ltd (Financial Services)
Equity, Since 30 Nov 25 | BSE4% ₹1,451 Cr 3,500,830
↓ -256,232 2. Invesco India Mid Cap Fund
Invesco India Mid Cap Fund
Growth Launch Date 19 Apr 07 NAV (17 Jul 26) ₹198.01 ↓ -0.13 (-0.07 %) Net Assets (Cr) ₹12,397 on 31 May 26 Category Equity - Mid Cap AMC Invesco Asset Management (India) Private Ltd Rating ☆☆ Risk Moderately High Expense Ratio 1.82 Sharpe Ratio 0.21 Information Ratio 0 Alpha Ratio 0 Min Investment 5,000 Min SIP Investment 500 Exit Load 0-1 Years (1%),1 Years and above(NIL) Growth of 10,000 investment over the years.
Date Value 30 Jun 21 ₹10,000 30 Jun 22 ₹9,839 30 Jun 23 ₹12,879 30 Jun 24 ₹19,911 30 Jun 25 ₹23,355 30 Jun 26 ₹25,135 Returns for Invesco India Mid Cap Fund
absolute basis & more than 1 year are on CAGR (Compound Annual Growth Rate) basis. as on 17 Jul 26 Duration Returns 1 Month 4% 3 Month 10.6% 6 Month 10.8% 1 Year 8% 3 Year 24.6% 5 Year 19.4% 10 Year 15 Year Since launch 16.8% Historical performance (Yearly) on absolute basis
Year Returns 2025 6.3% 2024 43.1% 2023 34.1% 2022 0.5% 2021 43.1% 2020 24.4% 2019 3.8% 2018 -5.3% 2017 44.3% 2016 1.1% Fund Manager information for Invesco India Mid Cap Fund
Name Since Tenure Aditya Khemani 9 Nov 23 2.64 Yr. Data below for Invesco India Mid Cap Fund as on 31 May 26
Equity Sector Allocation
Sector Value Financial Services 30.63% Health Care 18.1% Consumer Cyclical 16.29% Industrials 15.05% Real Estate 8.55% Technology 4.13% Basic Materials 3.85% Utility 1.93% Asset Allocation
Asset Class Value Cash 1.46% Equity 98.54% Top Securities Holdings / Portfolio
Name Holding Value Quantity BSE Ltd (Financial Services)
Equity, Since 31 Dec 23 | BSE6% ₹750 Cr 1,809,521
↓ -89,716 Prestige Estates Projects Ltd (Real Estate)
Equity, Since 30 Nov 23 | PRESTIGE6% ₹725 Cr 5,296,606
↑ 150,291 The Federal Bank Ltd (Financial Services)
Equity, Since 31 Oct 22 | FEDERALBNK5% ₹644 Cr 22,304,132 AU Small Finance Bank Ltd (Financial Services)
Equity, Since 31 Jul 25 | AUBANK5% ₹585 Cr 5,936,790 Eternal Ltd (Consumer Cyclical)
Equity, Since 31 Aug 25 | ETERNAL4% ₹555 Cr 22,166,702
↑ 799,446 Global Health Ltd (Healthcare)
Equity, Since 30 Nov 23 | MEDANTA4% ₹544 Cr 4,577,395 InterGlobe Aviation Ltd (Industrials)
Equity, Since 30 Apr 24 | INDIGO4% ₹523 Cr 1,186,438
↑ 53,285 Max Healthcare Institute Ltd Ordinary Shares (Healthcare)
Equity, Since 31 Dec 22 | MAXHEALTH4% ₹506 Cr 5,241,044 L&T Finance Ltd (Financial Services)
Equity, Since 31 Dec 23 | LTF4% ₹483 Cr 16,854,973 IndusInd Bank Ltd (Financial Services)
Equity, Since 31 Jan 26 | INDUSINDBK4% ₹472 Cr 5,164,015 3. Edelweiss Mid Cap Fund
Edelweiss Mid Cap Fund
Growth Launch Date 26 Dec 07 NAV (17 Jul 26) ₹107.698 ↓ -0.06 (-0.06 %) Net Assets (Cr) ₹16,849 on 31 May 26 Category Equity - Mid Cap AMC Edelweiss Asset Management Limited Rating ☆☆☆ Risk High Expense Ratio 1.75 Sharpe Ratio 0.19 Information Ratio 0.3 Alpha Ratio 0.35 Min Investment 5,000 Min SIP Investment 500 Exit Load 0-12 Months (1%),12 Months and above(NIL) Growth of 10,000 investment over the years.
Date Value 30 Jun 21 ₹10,000 30 Jun 22 ₹9,936 30 Jun 23 ₹12,970 30 Jun 24 ₹20,548 30 Jun 25 ₹22,969 30 Jun 26 ₹23,735 Returns for Edelweiss Mid Cap Fund
absolute basis & more than 1 year are on CAGR (Compound Annual Growth Rate) basis. as on 17 Jul 26 Duration Returns 1 Month 1.1% 3 Month 4.7% 6 Month 4.7% 1 Year 5.3% 3 Year 22.1% 5 Year 17.9% 10 Year 15 Year Since launch 13.7% Historical performance (Yearly) on absolute basis
Year Returns 2025 3.8% 2024 38.9% 2023 38.4% 2022 2.4% 2021 50.3% 2020 26.4% 2019 5.2% 2018 -15.7% 2017 52.3% 2016 2.5% Fund Manager information for Edelweiss Mid Cap Fund
Name Since Tenure Dhruv Bhatia 14 Oct 24 1.71 Yr. Trideep Bhattacharya 1 Oct 21 4.75 Yr. Raj Koradia 1 Aug 24 1.91 Yr. Data below for Edelweiss Mid Cap Fund as on 31 May 26
Equity Sector Allocation
Sector Value Financial Services 27.76% Industrials 16.13% Consumer Cyclical 11.71% Basic Materials 10.96% Health Care 8.98% Technology 5.53% Consumer Defensive 4.76% Utility 3.24% Communication Services 3.08% Real Estate 2.12% Energy 1.79% Asset Allocation
Asset Class Value Cash 3.94% Equity 96.06% Top Securities Holdings / Portfolio
Name Holding Value Quantity Multi Commodity Exchange of India Ltd (Financial Services)
Equity, Since 30 Apr 24 | MCX3% ₹511 Cr 1,730,477
↑ 43,058 BSE Ltd (Financial Services)
Equity, Since 31 Mar 24 | BSE3% ₹496 Cr 1,196,328
↑ 36,706 The Federal Bank Ltd (Financial Services)
Equity, Since 31 Dec 18 | FEDERALBNK3% ₹488 Cr 16,902,169
↑ 912,401 Fortis Healthcare Ltd (Healthcare)
Equity, Since 30 Sep 23 | FORTIS2% ₹376 Cr 4,052,573
↑ 470,404 Marico Ltd (Consumer Defensive)
Equity, Since 31 Oct 24 | MARICO2% ₹374 Cr 4,556,846
↑ 139,814 Solar Industries India Ltd (Basic Materials)
Equity, Since 30 Sep 12 | SOLARINDS2% ₹361 Cr 197,647
↑ 6,064 Bharat Heavy Electricals Ltd (Industrials)
Equity, Since 31 Mar 26 | BHEL2% ₹337 Cr 8,077,656
↑ 247,841 JSW Energy Ltd (Utilities)
Equity, Since 30 Apr 26 | JSWENERGY2% ₹321 Cr 5,395,645
↑ 2,490,497 Indian Bank (Financial Services)
Equity, Since 31 Jan 21 | INDIANB2% ₹278 Cr 3,338,157
↑ 102,422 Coforge Ltd (Technology)
Equity, Since 30 Jun 23 | COFORGE2% ₹275 Cr 1,937,427 4. Sundaram Mid Cap Fund
Sundaram Mid Cap Fund
Growth Launch Date 30 Jul 02 NAV (17 Jul 26) ₹1,487.44 ↓ -3.81 (-0.26 %) Net Assets (Cr) ₹13,687 on 31 May 26 Category Equity - Mid Cap AMC Sundaram Asset Management Company Ltd Rating ☆☆☆☆ Risk Moderately High Expense Ratio 1.75 Sharpe Ratio 0.17 Information Ratio 0.23 Alpha Ratio -0.11 Min Investment 5,000 Min SIP Investment 100 Exit Load 0-12 Months (1%),12 Months and above(NIL) Growth of 10,000 investment over the years.
Date Value 30 Jun 21 ₹10,000 30 Jun 22 ₹9,952 30 Jun 23 ₹12,988 30 Jun 24 ₹20,155 30 Jun 25 ₹21,973 30 Jun 26 ₹23,117 Returns for Sundaram Mid Cap Fund
absolute basis & more than 1 year are on CAGR (Compound Annual Growth Rate) basis. as on 17 Jul 26 Duration Returns 1 Month 1.6% 3 Month 4.8% 6 Month 5.9% 1 Year 6.4% 3 Year 20.7% 5 Year 17.7% 10 Year 15 Year Since launch 23.2% Historical performance (Yearly) on absolute basis
Year Returns 2025 4.1% 2024 32% 2023 40.4% 2022 4.8% 2021 37.5% 2020 11.8% 2019 -0.3% 2018 -15.4% 2017 40.8% 2016 11.3% Fund Manager information for Sundaram Mid Cap Fund
Name Since Tenure S. Bharath 24 Feb 21 5.35 Yr. Shalav Saket 31 Dec 25 0.5 Yr. Data below for Sundaram Mid Cap Fund as on 31 May 26
Equity Sector Allocation
Sector Value Financial Services 21.92% Industrials 19.24% Consumer Cyclical 14.17% Health Care 9.9% Basic Materials 8.55% Technology 8.5% Consumer Defensive 5.02% Real Estate 3.11% Utility 3.02% Communication Services 1.96% Energy 1.38% Asset Allocation
Asset Class Value Cash 3.22% Equity 96.76% Other 0% Top Securities Holdings / Portfolio
Name Holding Value Quantity GE Vernova T&D India Ltd (Industrials)
Equity, Since 30 Sep 24 | GVT&D3% ₹463 Cr 900,000
↓ -100,000 Cummins India Ltd (Industrials)
Equity, Since 31 Dec 17 | CUMMINSIND3% ₹441 Cr 750,000
↓ -100,000 BSE Ltd (Financial Services)
Equity, Since 31 May 24 | BSE3% ₹392 Cr 945,165 Mahindra & Mahindra Financial Services Ltd (Financial Services)
Equity, Since 31 Jan 24 | M&MFIN3% ₹349 Cr 11,498,475 Max Financial Services Ltd (Financial Services)
Equity, Since 30 Jun 16 | MFSL2% ₹302 Cr 1,805,000
↑ 130,000 The Federal Bank Ltd (Financial Services)
Equity, Since 31 Dec 18 | FEDERALBNK2% ₹300 Cr 10,399,688 Coromandel International Ltd (Basic Materials)
Equity, Since 30 Nov 10 | COROMANDEL2% ₹288 Cr 1,642,029 Suzlon Energy Ltd (Industrials)
Equity, Since 31 Jul 24 | SUZLON2% ₹287 Cr 50,302,475
↑ 11,730,000 IDFC First Bank Ltd (Financial Services)
Equity, Since 30 Jun 25 | IDFCFIRSTB2% ₹273 Cr 38,278,844 Marico Ltd (Consumer Defensive)
Equity, Since 30 Jun 24 | MARICO2% ₹271 Cr 3,300,000
↓ -95,879 5. ICICI Prudential MidCap Fund
ICICI Prudential MidCap Fund
Growth Launch Date 28 Oct 04 NAV (17 Jul 26) ₹336.27 ↓ -2.16 (-0.64 %) Net Assets (Cr) ₹7,789 on 31 May 26 Category Equity - Mid Cap AMC ICICI Prudential Asset Management Company Limited Rating ☆☆ Risk Moderately High Expense Ratio 1.88 Sharpe Ratio 0.61 Information Ratio 0.84 Alpha Ratio 9.08 Min Investment 5,000 Min SIP Investment 100 Exit Load 0-1 Years (1%),1 Years and above(NIL) Growth of 10,000 investment over the years.
Date Value 30 Jun 21 ₹10,000 30 Jun 22 ₹9,945 30 Jun 23 ₹12,113 30 Jun 24 ₹19,582 30 Jun 25 ₹20,792 30 Jun 26 ₹22,997 Returns for ICICI Prudential MidCap Fund
absolute basis & more than 1 year are on CAGR (Compound Annual Growth Rate) basis. as on 17 Jul 26 Duration Returns 1 Month -1.8% 3 Month 2.6% 6 Month 8% 1 Year 10.5% 3 Year 22.7% 5 Year 17.1% 10 Year 15 Year Since launch 17.6% Historical performance (Yearly) on absolute basis
Year Returns 2025 11.1% 2024 27% 2023 32.8% 2022 3.1% 2021 44.8% 2020 19.1% 2019 -0.6% 2018 -10.8% 2017 42.9% 2016 4.8% Fund Manager information for ICICI Prudential MidCap Fund
Name Since Tenure Lalit Kumar 1 Jul 22 4 Yr. Sharmila D’mello 31 Jul 22 3.92 Yr. Data below for ICICI Prudential MidCap Fund as on 31 May 26
Equity Sector Allocation
Sector Value Industrials 24.42% Basic Materials 23.1% Financial Services 22.87% Consumer Cyclical 12.8% Real Estate 5.16% Energy 3.68% Health Care 1.75% Communication Services 1.44% Technology 1.09% Utility 0.02% Asset Allocation
Asset Class Value Cash 2.09% Equity 97.91% Top Securities Holdings / Portfolio
Name Holding Value Quantity BSE Ltd (Financial Services)
Equity, Since 30 Apr 24 | BSE5% ₹420 Cr 1,011,840 Multi Commodity Exchange of India Ltd (Financial Services)
Equity, Since 30 Apr 24 | MCX5% ₹366 Cr 1,239,860 Apar Industries Ltd (Industrials)
Equity, Since 31 Jan 25 | APARINDS5% ₹359 Cr 273,711
↑ 10,000 Jindal Steel Ltd (Basic Materials)
Equity, Since 31 Jan 22 | JINDALSTEL4% ₹336 Cr 2,786,470 Hindustan Petroleum Corp Ltd (Energy)
Equity, Since 31 Mar 26 | HINDPETRO4% ₹287 Cr 7,283,739
↑ 950,000 Muthoot Finance Ltd (Financial Services)
Equity, Since 30 Nov 23 | MUTHOOTFIN4% ₹276 Cr 824,501 APL Apollo Tubes Ltd (Basic Materials)
Equity, Since 30 Sep 22 | APLAPOLLO3% ₹263 Cr 1,437,425
↑ 12,229 PB Fintech Ltd (Financial Services)
Equity, Since 31 May 24 | 5433903% ₹240 Cr 1,408,585 KEI Industries Ltd (Industrials)
Equity, Since 30 Apr 24 | KEI3% ₹230 Cr 437,075
↑ 18,483 Bharat Forge Ltd (Consumer Cyclical)
Equity, Since 31 May 23 | BHARATFORG3% ₹230 Cr 1,174,895 6. TATA Mid Cap Growth Fund
TATA Mid Cap Growth Fund
Growth Launch Date 1 Jul 94 NAV (17 Jul 26) ₹463.785 ↓ -0.11 (-0.02 %) Net Assets (Cr) ₹5,732 on 31 May 26 Category Equity - Mid Cap AMC Tata Asset Management Limited Rating ☆☆ Risk Moderately High Expense Ratio 1.88 Sharpe Ratio 0.2 Information Ratio -0.87 Alpha Ratio 0.38 Min Investment 5,000 Min SIP Investment 150 Exit Load 0-365 Days (1%),365 Days and above(NIL) Growth of 10,000 investment over the years.
Date Value 30 Jun 21 ₹10,000 30 Jun 22 ₹9,941 30 Jun 23 ₹12,753 30 Jun 24 ₹19,867 30 Jun 25 ₹19,950 30 Jun 26 ₹20,758 Returns for TATA Mid Cap Growth Fund
absolute basis & more than 1 year are on CAGR (Compound Annual Growth Rate) basis. as on 17 Jul 26 Duration Returns 1 Month 2.9% 3 Month 4.6% 6 Month 4.1% 1 Year 5.2% 3 Year 17.7% 5 Year 15.7% 10 Year 15 Year Since launch 12.7% Historical performance (Yearly) on absolute basis
Year Returns 2025 5.8% 2024 22.7% 2023 40.5% 2022 0.6% 2021 40% 2020 24.3% 2019 6.5% 2018 -13% 2017 49.8% 2016 -2.2% Fund Manager information for TATA Mid Cap Growth Fund
Name Since Tenure Satish Mishra 9 Mar 21 5.31 Yr. Data below for TATA Mid Cap Growth Fund as on 31 May 26
Equity Sector Allocation
Sector Value Financial Services 27.09% Industrials 13.83% Health Care 12.38% Consumer Cyclical 12.21% Technology 9.08% Basic Materials 8.77% Communication Services 4.22% Consumer Defensive 4.03% Real Estate 2.73% Utility 2.5% Energy 1.24% Asset Allocation
Asset Class Value Cash 1.94% Equity 98.06% Top Securities Holdings / Portfolio
Name Holding Value Quantity Mankind Pharma Ltd (Healthcare)
Equity, Since 31 Dec 25 | MANKIND3% ₹190 Cr 800,000 The Federal Bank Ltd (Financial Services)
Equity, Since 31 May 18 | FEDERALBNK3% ₹173 Cr 6,000,000 Bharat Heavy Electricals Ltd (Industrials)
Equity, Since 30 Sep 22 | BHEL3% ₹172 Cr 4,118,139
↓ -500,000 BSE Ltd (Financial Services)
Equity, Since 28 Feb 26 | BSE3% ₹163 Cr 392,200
↑ 92,200 Max Financial Services Ltd (Financial Services)
Equity, Since 30 Nov 23 | MFSL3% ₹159 Cr 950,000 IndusInd Bank Ltd (Financial Services)
Equity, Since 31 Jan 26 | INDUSINDBK3% ₹155 Cr 1,700,000 Indian Bank (Financial Services)
Equity, Since 31 Oct 21 | INDIANB3% ₹153 Cr 1,835,455 AU Small Finance Bank Ltd (Financial Services)
Equity, Since 30 Nov 24 | AUBANK3% ₹148 Cr 1,500,000 Marico Ltd (Consumer Defensive)
Equity, Since 30 Sep 25 | MARICO3% ₹144 Cr 1,750,000 Indus Towers Ltd Ordinary Shares (Communication Services)
Equity, Since 31 Aug 23 | INDUSTOWER2% ₹137 Cr 3,100,000 7. BNP Paribas Mid Cap Fund
BNP Paribas Mid Cap Fund
Growth Launch Date 2 May 06 NAV (17 Jul 26) ₹111.506 ↓ -0.21 (-0.18 %) Net Assets (Cr) ₹2,461 on 31 May 26 Category Equity - Mid Cap AMC BNP Paribas Asset Mgmt India Pvt. Ltd Rating ☆☆☆ Risk High Expense Ratio 2 Sharpe Ratio 0.34 Information Ratio -0.33 Alpha Ratio 2.64 Min Investment 5,000 Min SIP Investment 300 Exit Load 0-12 Months (1%),12 Months and above(NIL) Growth of 10,000 investment over the years.
Date Value 30 Jun 21 ₹10,000 30 Jun 22 ₹9,871 30 Jun 23 ₹12,323 30 Jun 24 ₹18,874 30 Jun 25 ₹19,294 30 Jun 26 ₹20,879 Returns for BNP Paribas Mid Cap Fund
absolute basis & more than 1 year are on CAGR (Compound Annual Growth Rate) basis. as on 17 Jul 26 Duration Returns 1 Month 1.9% 3 Month 5.2% 6 Month 7.8% 1 Year 9.9% 3 Year 18.5% 5 Year 15.2% 10 Year 15 Year Since launch 12.7% Historical performance (Yearly) on absolute basis
Year Returns 2025 2.5% 2024 28.5% 2023 32.6% 2022 4.7% 2021 41.5% 2020 23.1% 2019 5.2% 2018 -17.5% 2017 49% 2016 -1.2% Fund Manager information for BNP Paribas Mid Cap Fund
Name Since Tenure Rohan Korde 1 May 26 0.17 Yr. Himanshu Singh 21 Oct 24 1.69 Yr. Data below for BNP Paribas Mid Cap Fund as on 31 May 26
Equity Sector Allocation
Sector Value Financial Services 24.69% Industrials 17.63% Consumer Cyclical 15.09% Basic Materials 12.07% Health Care 11.9% Technology 6.14% Real Estate 2.44% Consumer Defensive 2.19% Energy 1.92% Utility 1.91% Communication Services 1.12% Asset Allocation
Asset Class Value Cash 2.87% Equity 97.11% Top Securities Holdings / Portfolio
Name Holding Value Quantity GE Vernova T&D India Ltd (Industrials)
Equity, Since 30 Sep 24 | GVT&D4% ₹90 Cr 175,000
↓ -50,000 Bharat Heavy Electricals Ltd (Industrials)
Equity, Since 31 Jan 24 | BHEL3% ₹83 Cr 2,000,000 Hitachi Energy India Ltd Ordinary Shares (Industrials)
Equity, Since 31 Dec 22 | POWERINDIA3% ₹81 Cr 21,105
↓ -2,350 BSE Ltd (Financial Services)
Equity, Since 30 Nov 25 | BSE3% ₹70 Cr 168,000 Navin Fluorine International Ltd (Basic Materials)
Equity, Since 30 Apr 23 | NAVINFLUOR3% ₹65 Cr 90,608
↓ -5,000 Indian Bank (Financial Services)
Equity, Since 30 Jun 21 | INDIANB3% ₹62 Cr 740,000 PB Fintech Ltd (Financial Services)
Equity, Since 28 Feb 23 | 5433902% ₹59 Cr 348,500
↑ 33,500 The Federal Bank Ltd (Financial Services)
Equity, Since 31 Jul 16 | FEDERALBNK2% ₹58 Cr 2,000,000 Acutaas Chemicals Ltd (Basic Materials)
Equity, Since 31 Oct 25 | 5433492% ₹53 Cr 170,466 National Aluminium Co Ltd (Basic Materials)
Equity, Since 30 Apr 24 | NATIONALUM2% ₹51 Cr 1,200,000 8. Aditya Birla Sun Life Midcap Fund
Aditya Birla Sun Life Midcap Fund
Growth Launch Date 3 Oct 02 NAV (17 Jul 26) ₹839.6 ↓ -0.70 (-0.08 %) Net Assets (Cr) ₹6,398 on 31 May 26 Category Equity - Mid Cap AMC Birla Sun Life Asset Management Co Ltd Rating ☆☆☆ Risk Moderately High Expense Ratio 1.89 Sharpe Ratio 0.09 Information Ratio -0.78 Alpha Ratio -1.82 Min Investment 1,000 Min SIP Investment 1,000 Exit Load 0-365 Days (1%),365 Days and above(NIL) Growth of 10,000 investment over the years.
Date Value 30 Jun 21 ₹10,000 30 Jun 22 ₹10,374 30 Jun 23 ₹12,605 30 Jun 24 ₹18,783 30 Jun 25 ₹19,896 30 Jun 26 ₹20,698 Returns for Aditya Birla Sun Life Midcap Fund
absolute basis & more than 1 year are on CAGR (Compound Annual Growth Rate) basis. as on 17 Jul 26 Duration Returns 1 Month 1.5% 3 Month 6.2% 6 Month 6% 1 Year 4.4% 3 Year 17.4% 5 Year 14.9% 10 Year 15 Year Since launch 20.5% Historical performance (Yearly) on absolute basis
Year Returns 2025 4.4% 2024 22% 2023 39.9% 2022 -5.3% 2021 50.4% 2020 15.5% 2019 -3.7% 2018 -16% 2017 44.8% 2016 5.7% Fund Manager information for Aditya Birla Sun Life Midcap Fund
Name Since Tenure Vishal Gajwani 31 Oct 24 1.67 Yr. Data below for Aditya Birla Sun Life Midcap Fund as on 31 May 26
Equity Sector Allocation
Sector Value Financial Services 26.79% Industrials 18.06% Consumer Cyclical 14.29% Basic Materials 13.25% Health Care 8.29% Technology 7.72% Real Estate 4.48% Utility 2.44% Consumer Defensive 2.4% Asset Allocation
Asset Class Value Cash 1.36% Equity 98.62% Top Securities Holdings / Portfolio
Name Holding Value Quantity Thermax Ltd (Industrials)
Equity, Since 31 Oct 19 | THERMAX3% ₹207 Cr 414,874
↓ -87,098 Max Financial Services Ltd (Financial Services)
Equity, Since 28 Feb 17 | MFSL3% ₹205 Cr 1,225,565 The Federal Bank Ltd (Financial Services)
Equity, Since 31 Mar 12 | FEDERALBNK3% ₹204 Cr 7,043,431 AU Small Finance Bank Ltd (Financial Services)
Equity, Since 30 Nov 19 | AUBANK3% ₹191 Cr 1,940,849
↓ -70,318 Billionbrains Garage Ventures Ltd (Financial Services)
Equity, Since 30 Nov 25 | GROWW3% ₹182 Cr 9,857,530
↑ 6,322,938 JK Cement Ltd (Basic Materials)
Equity, Since 31 Jan 24 | JKCEMENT3% ₹177 Cr 342,940 APL Apollo Tubes Ltd (Basic Materials)
Equity, Since 31 Aug 24 | APLAPOLLO2% ₹160 Cr 873,080 Torrent Power Ltd (Utilities)
Equity, Since 31 Oct 19 | TORNTPOWER2% ₹156 Cr 1,100,000 Navin Fluorine International Ltd (Basic Materials)
Equity, Since 31 Jan 25 | NAVINFLUOR2% ₹146 Cr 204,519 KEI Industries Ltd (Industrials)
Equity, Since 31 May 25 | KEI2% ₹136 Cr 257,506
↓ -23,828 9. Franklin India Prima Fund
Franklin India Prima Fund
Growth Launch Date 1 Dec 93 NAV (17 Jul 26) ₹2,821.03 ↑ 6.33 (0.22 %) Net Assets (Cr) ₹12,231 on 31 May 26 Category Equity - Mid Cap AMC Franklin Templeton Asst Mgmt(IND)Pvt Ltd Rating ☆☆☆ Risk Moderately High Expense Ratio 1.77 Sharpe Ratio -0.22 Information Ratio -0.9 Alpha Ratio -7.49 Min Investment 5,000 Min SIP Investment 500 Exit Load 0-1 Years (1%),1 Years and above(NIL) Growth of 10,000 investment over the years.
Date Value 30 Jun 21 ₹10,000 30 Jun 22 ₹9,268 30 Jun 23 ₹12,278 30 Jun 24 ₹18,779 30 Jun 25 ₹20,289 30 Jun 26 ₹19,782 Returns for Franklin India Prima Fund
absolute basis & more than 1 year are on CAGR (Compound Annual Growth Rate) basis. as on 17 Jul 26 Duration Returns 1 Month 3% 3 Month 5.3% 6 Month 2.7% 1 Year 0% 3 Year 17.7% 5 Year 14.5% 10 Year 15 Year Since launch 18.9% Historical performance (Yearly) on absolute basis
Year Returns 2025 1.6% 2024 31.8% 2023 36.8% 2022 2.2% 2021 32.6% 2020 17.8% 2019 3.5% 2018 -9.4% 2017 39.7% 2016 8.5% Fund Manager information for Franklin India Prima Fund
Name Since Tenure R. Janakiraman 1 Feb 11 15.42 Yr. Sandeep Manam 18 Oct 21 4.7 Yr. Akhil Kalluri 7 Feb 22 4.4 Yr. Data below for Franklin India Prima Fund as on 31 May 26
Equity Sector Allocation
Sector Value Financial Services 22.8% Industrials 16.66% Consumer Cyclical 14.04% Basic Materials 10.58% Health Care 8.93% Technology 8.38% Real Estate 5.87% Communication Services 3.33% Utility 2.48% Consumer Defensive 1.93% Energy 1% Asset Allocation
Asset Class Value Cash 4% Equity 96% Top Securities Holdings / Portfolio
Name Holding Value Quantity The Federal Bank Ltd (Financial Services)
Equity, Since 30 Jun 20 | FEDERALBNK2% ₹298 Cr 10,324,683 Biocon Ltd (Healthcare)
Equity, Since 30 Jun 25 | BIOCON2% ₹267 Cr 6,219,684
↓ -1,000,000 IDFC First Bank Ltd (Financial Services)
Equity, Since 30 Apr 25 | IDFCFIRSTB2% ₹263 Cr 36,893,177 Tube Investments of India Ltd Ordinary Shares (Industrials)
Equity, Since 28 Feb 22 | TIINDIA2% ₹263 Cr 836,172 Mphasis Ltd (Technology)
Equity, Since 30 Sep 20 | MPHASIS2% ₹262 Cr 1,152,885 Balkrishna Industries Ltd (Consumer Cyclical)
Equity, Since 30 Apr 24 | BALKRISIND2% ₹259 Cr 1,175,000 Mankind Pharma Ltd (Healthcare)
Equity, Since 28 Feb 26 | MANKIND2% ₹244 Cr 1,029,108 Hindustan Aeronautics Ltd Ordinary Shares (Industrials)
Equity, Since 31 Jan 23 | HAL2% ₹241 Cr 559,715
↑ 278,415 ICICI Lombard General Insurance Co Ltd (Financial Services)
Equity, Since 31 Jul 24 | ICICIGI2% ₹232 Cr 1,295,000 Mahindra & Mahindra Financial Services Ltd (Financial Services)
Equity, Since 30 Sep 22 | M&MFIN2% ₹225 Cr 7,413,356 10. SBI Magnum Mid Cap Fund
SBI Magnum Mid Cap Fund
Growth Launch Date 29 Mar 05 NAV (17 Jul 26) ₹243.281 ↓ -1.48 (-0.60 %) Net Assets (Cr) ₹23,417 on 31 May 26 Category Equity - Mid Cap AMC SBI Funds Management Private Limited Rating ☆☆☆ Risk Moderately High Expense Ratio 1.67 Sharpe Ratio -0.15 Information Ratio -1.62 Alpha Ratio -6.46 Min Investment 5,000 Min SIP Investment 500 Exit Load 0-1 Years (1%),1 Years and above(NIL) Growth of 10,000 investment over the years.
Date Value 30 Jun 21 ₹10,000 30 Jun 22 ₹10,787 30 Jun 23 ₹14,059 30 Jun 24 ₹19,462 30 Jun 25 ₹20,053 30 Jun 26 ₹20,086 Returns for SBI Magnum Mid Cap Fund
absolute basis & more than 1 year are on CAGR (Compound Annual Growth Rate) basis. as on 17 Jul 26 Duration Returns 1 Month 2.9% 3 Month 4.6% 6 Month 4.5% 1 Year 1.2% 3 Year 12.4% 5 Year 14.3% 10 Year 15 Year Since launch 16.2% Historical performance (Yearly) on absolute basis
Year Returns 2025 0.4% 2024 20.3% 2023 34.5% 2022 3% 2021 52.2% 2020 30.4% 2019 0.1% 2018 -18% 2017 33.5% 2016 5% Fund Manager information for SBI Magnum Mid Cap Fund
Name Since Tenure Bhavin Vithlani 1 Apr 24 2.25 Yr. Data below for SBI Magnum Mid Cap Fund as on 31 May 26
Equity Sector Allocation
Sector Value Financial Services 22.19% Industrials 17.05% Basic Materials 12.24% Consumer Cyclical 11.98% Health Care 8.08% Utility 7.84% Technology 5.99% Consumer Defensive 4.02% Real Estate 3.48% Communication Services 1.77% Energy 0.8% Asset Allocation
Asset Class Value Cash 4.43% Equity 95.45% Debt 0.12% Top Securities Holdings / Portfolio
Name Holding Value Quantity Adani Energy Solutions Ltd (Utilities)
Equity, Since 31 Oct 25 | ADANIENSOL3% ₹750 Cr 4,955,582
↓ -1,089,959 Bharat Heavy Electricals Ltd (Industrials)
Equity, Since 31 May 25 | BHEL3% ₹726 Cr 17,420,252
↓ -7,579,748 Torrent Power Ltd (Utilities)
Equity, Since 30 Jun 19 | TORNTPOWER3% ₹710 Cr 5,000,000 Biocon Ltd (Healthcare)
Equity, Since 30 Nov 24 | BIOCON3% ₹669 Cr 15,598,584 CRISIL Ltd (Financial Services)
Equity, Since 30 Apr 21 | CRISIL3% ₹659 Cr 1,667,886 Supreme Industries Ltd (Industrials)
Equity, Since 31 Dec 25 | SUPREMEIND3% ₹639 Cr 1,800,000 Shree Cement Ltd (Basic Materials)
Equity, Since 30 Nov 24 | SHREECEM3% ₹632 Cr 250,000 AIA Engineering Ltd (Industrials)
Equity, Since 30 Apr 24 | AIAENG3% ₹585 Cr 1,300,000
↓ -392,647 Sundaram Finance Ltd (Financial Services)
Equity, Since 30 Sep 22 | SUNDARMFIN2% ₹566 Cr 1,350,000 Grindwell Norton Ltd (Industrials)
Equity, Since 31 Oct 22 | GRINDWELL2% ₹539 Cr 2,929,497 11. Axis Mid Cap Fund
Axis Mid Cap Fund
Growth Launch Date 18 Feb 11 NAV (17 Jul 26) ₹120.15 ↓ -0.08 (-0.07 %) Net Assets (Cr) ₹32,852 on 31 May 26 Category Equity - Mid Cap AMC Axis Asset Management Company Limited Rating ☆ Risk Moderately High Expense Ratio 1.57 Sharpe Ratio 0.08 Information Ratio 0 Alpha Ratio 0 Min Investment 5,000 Min SIP Investment 500 Exit Load 0-12 Months (1%),12 Months and above(NIL) Growth of 10,000 investment over the years.
Date Value 30 Jun 21 ₹10,000 30 Jun 22 ₹9,800 30 Jun 23 ₹12,284 30 Jun 24 ₹17,844 30 Jun 25 ₹18,985 30 Jun 26 ₹19,583 Returns for Axis Mid Cap Fund
absolute basis & more than 1 year are on CAGR (Compound Annual Growth Rate) basis. as on 17 Jul 26 Duration Returns 1 Month 1.5% 3 Month 5.2% 6 Month 8.4% 1 Year 5.2% 3 Year 16.9% 5 Year 13.9% 10 Year 15 Year Since launch 17.5% Historical performance (Yearly) on absolute basis
Year Returns 2025 1% 2024 30% 2023 29.6% 2022 -5.1% 2021 39.9% 2020 26% 2019 11.3% 2018 3.5% 2017 42% 2016 -3.1% Fund Manager information for Axis Mid Cap Fund
Name Since Tenure Shreyash Devalkar 23 Nov 16 9.61 Yr. Nitin Arora 3 Aug 23 2.91 Yr. Krishnaa N 1 Mar 24 2.33 Yr. Data below for Axis Mid Cap Fund as on 31 May 26
Equity Sector Allocation
Sector Value Industrials 19.84% Consumer Cyclical 19.68% Financial Services 19.49% Health Care 10.74% Basic Materials 7.44% Technology 5.54% Communication Services 2.58% Real Estate 2.41% Consumer Defensive 1.47% Utility 1.33% Energy 0.95% Asset Allocation
Asset Class Value Cash 2.96% Equity 96.93% Debt 0.11% Other 0% Top Securities Holdings / Portfolio
Name Holding Value Quantity Nifty June 2026 Future
- | -5% ₹1,794 Cr 755,560
↑ 755,560 The Federal Bank Ltd (Financial Services)
Equity, Since 31 Mar 23 | FEDERALBNK4% ₹1,258 Cr 43,536,421 Fortis Healthcare Ltd (Healthcare)
Equity, Since 31 Mar 22 | FORTIS4% ₹1,163 Cr 12,522,385
↑ 74,981 Multi Commodity Exchange of India Ltd (Financial Services)
Equity, Since 31 Jul 24 | MCX3% ₹998 Cr 3,377,319
↓ -347,945 GE Vernova T&D India Ltd (Industrials)
Equity, Since 30 Sep 24 | GVT&D3% ₹953 Cr 1,850,166
↓ -24,451 BSE Ltd (Financial Services)
Equity, Since 31 Jan 25 | BSE2% ₹786 Cr 1,896,289 Schaeffler India Ltd (Consumer Cyclical)
Equity, Since 31 Jul 21 | SCHAEFFLER2% ₹728 Cr 1,763,472 Cummins India Ltd (Industrials)
Equity, Since 28 Feb 21 | CUMMINSIND2% ₹692 Cr 1,176,328 Apar Industries Ltd (Industrials)
Equity, Since 30 Nov 23 | APARINDS2% ₹686 Cr 522,756
↑ 62,384 Solar Industries India Ltd (Basic Materials)
Equity, Since 30 Jun 23 | SOLARINDS2% ₹679 Cr 372,310
മിഡ്-ക്യാപ് ഫണ്ടുകൾ തിരഞ്ഞെടുക്കുമ്പോൾ ശ്രദ്ധിക്കേണ്ട പാരാമീറ്ററുകൾ
നിക്ഷേപിക്കുന്നതിന് ശരിയായ ഫണ്ട് തിരഞ്ഞെടുക്കുമ്പോൾ നിക്ഷേപകർ ശ്രദ്ധിക്കേണ്ട ചില പ്രധാന ഗുണപരവും അളവ്പരവുമായ ഘടകങ്ങളുണ്ട്. പദ്ധതി അല്ലെങ്കിൽ മ്യൂച്വൽഫണ്ട് റേറ്റിംഗ് ആരംഭിക്കുന്നത് നല്ലതായിരിക്കണം. AUM (അസറ്റ് അണ്ടർ മാനേജ്മെന്റ്), ഫണ്ടിന്റെ പ്രായം, മുൻകാല റിട്ടേണുകൾ, ചെലവ് അനുപാതം മുതലായവ പോലുള്ള മറ്റ് ഡാറ്റയ്ക്കൊപ്പം ഇത് അനുബന്ധമായി നൽകേണ്ടതുണ്ട്. കൂടാതെ, ഒരു ഫണ്ടിന്റെ കഴിഞ്ഞ മൂന്ന് വർഷത്തെ പ്രകടനം പരിശോധിക്കാൻ നിക്ഷേപകരോട് നിർദ്ദേശിക്കുന്നു. ഒരു ഫണ്ടിന് 100 കോടി രൂപയിലധികം അറ്റ ആസ്തി ഉണ്ടായിരിക്കണം കൂടാതെ കഴിഞ്ഞ ഒരു വർഷമായി മിഡ് ക്യാപ് സ്റ്റോക്കുകൾക്ക് 50 ശതമാനത്തിൽ കൂടുതൽ ശരാശരി അലോക്കേഷൻ ഉണ്ടായിരിക്കണം. കൂടാതെ, നിക്ഷേപകർ ഫണ്ടുകളുടെ ചെലവ് അനുപാതവും പരിശോധിക്കണം, എന്നിരുന്നാലും, ഇത് ഫണ്ട് പ്രകടനം പോലുള്ള മറ്റ് പ്രധാന ഘടകങ്ങളെ അസാധുവാക്കരുത്.
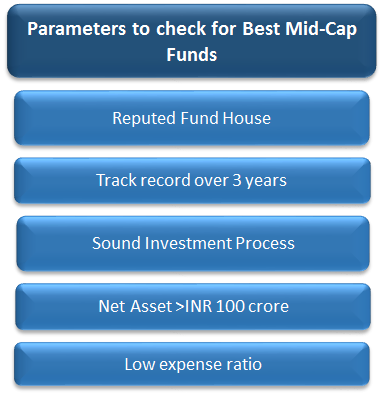
ഫണ്ട് മാനേജരുടെ ട്രാക്ക് റെക്കോർഡും നിക്ഷേപ പ്രക്രിയയും പോലെയുള്ള മറ്റ് ഗുണപരമായ ഘടകങ്ങളെ അധികമായി പരിശോധിക്കാൻ നിക്ഷേപകർ നിർദ്ദേശിക്കുന്നു. സാമ്പത്തിക വിപണികളിൽ ശക്തമായ സാന്നിധ്യമുള്ള ഫണ്ട് ഹൗസുകളെ തിരിച്ചറിയുകയും ദീർഘവും സ്ഥിരതയുള്ളതുമായ ട്രാക്ക് റെക്കോർഡുള്ള ഫണ്ടുകൾ നൽകുകയും ചെയ്യുക. നിങ്ങളുടെ പണം നിക്ഷേപിക്കുന്നതിന് നിങ്ങൾക്ക് വിശ്വാസമുള്ള ഫണ്ട് ഹൗസ് തിരഞ്ഞെടുക്കണം. എത്ര ഫണ്ടുകൾ മികച്ച പ്രകടനം കാഴ്ചവയ്ക്കുന്നുവെന്നും ഒന്ന് കാണണം. ധാരാളം നല്ല പ്രകടനം നടത്തുന്ന ഫണ്ടുകൾ ഉള്ളത് ഫണ്ട് ഹൗസിന്റെ മൊത്തത്തിലുള്ള തന്ത്രം നല്ല ക്രമത്തിലാണ് എന്നാണ് അർത്ഥമാക്കുന്നത്.
മിഡ് ക്യാപ് ഫണ്ടുകളിൽ ഓൺലൈനിൽ നിക്ഷേപിക്കുന്നത് എങ്ങനെ?
Fincash.com-ൽ ആജീവനാന്ത സൗജന്യ നിക്ഷേപ അക്കൗണ്ട് തുറക്കുക.
നിങ്ങളുടെ രജിസ്ട്രേഷനും KYC പ്രക്രിയയും പൂർത്തിയാക്കുക
രേഖകൾ അപ്ലോഡ് ചെയ്യുക (പാൻ, ആധാർ മുതലായവ).കൂടാതെ, നിങ്ങൾ നിക്ഷേപിക്കാൻ തയ്യാറാണ്!
ഉപസംഹാരം
മിഡ്-ക്യാപ് ഫണ്ടുകൾ ഉപയോഗിച്ച് പോകുന്നത് ഒരാളുടെ നിക്ഷേപ പോർട്ട്ഫോളിയോയ്ക്ക് അവർക്ക് നൽകാനാകുന്ന വരുമാനം കണക്കിലെടുത്ത് പ്രതിഫലദായകമാണ്. മിഡ്-ക്യാപ് മ്യൂച്വൽ ഫണ്ടുകളിൽ നിക്ഷേപിക്കുമ്പോൾ, നിക്ഷേപകർ എക്സ്പോഷർ ഒപ്റ്റിമൽ ലെവലിൽ നിലനിർത്തുന്നത് നല്ലതാണ്, കാരണം മിഡ്-ക്യാപ് ഉയർന്ന റിസ്ക് റിട്ടേൺ ഫണ്ടുകളാണ്.
ഇവിടെ നൽകിയിരിക്കുന്ന വിവരങ്ങൾ കൃത്യമാണെന്ന് ഉറപ്പാക്കാൻ എല്ലാ ശ്രമങ്ങളും നടത്തിയിട്ടുണ്ട്. എന്നിരുന്നാലും, ഡാറ്റയുടെ കൃത്യത സംബന്ധിച്ച് യാതൊരു ഉറപ്പും നൽകുന്നില്ല. എന്തെങ്കിലും നിക്ഷേപം നടത്തുന്നതിന് മുമ്പ് സ്കീം വിവര രേഖ ഉപയോഗിച്ച് പരിശോധിക്കുക.
You Might Also Like


AMFI Registration No. 112358 | CIN: U74999MH2016PTC282153
Shepard Technologies Pvt. Ltd. (with ARN code 112358) makes no warranties or representations, express or implied, on products offered through the platform. It accepts no liability for any damages or losses, however caused, in connection with the use of, or on the reliance of its product or related services. Terms and conditions of the website are applicable.
©2026 Shepard Technologies Private Limited. All Rights Reserved
Research Highlights for Motilal Oswal Midcap 30 Fund