
 +91-22-48913909
SIP 2022 - 2023-നുള്ള ഇന്ത്യയിലെ മികച്ച മ്യൂച്വൽ ഫണ്ടുകൾ
ഒരു വ്യവസ്ഥാപിതനിക്ഷേപ പദ്ധതി (എസ്.ഐ.പി) ഏറ്റവും ഫലപ്രദമായ മാർഗമായി കണക്കാക്കപ്പെടുന്നുമ്യൂച്വൽ ഫണ്ടുകളിൽ നിക്ഷേപിക്കുകപ്രത്യേകിച്ച് ദീർഘകാലത്തേക്ക്-ടേം പ്ലാൻ. ദീർഘകാല സേവിംഗ്സ് പ്ലാൻ നടപ്പിലാക്കുന്നതിനായി എല്ലാ മാസവും ഒരു പ്രത്യേക തീയതിയിൽ ഒരു യൂണിറ്റ് വാങ്ങാൻ ഇത് നിക്ഷേപകരെ അനുവദിക്കുന്നു. നിക്ഷേപകർക്ക് സുഖം തോന്നുന്നതിന്റെ ഒരു കാരണംനിക്ഷേപിക്കുന്നു SIP-ൽ അവർ വാഗ്ദാനം ചെയ്യുന്ന വഴക്കമാണ്. നിക്ഷേപകർക്ക് കഴിയുംഎസ്ഐപിയിൽ നിക്ഷേപിക്കുക ഒന്നുകിൽ പ്രതിമാസ, ത്രൈമാസ അല്ലെങ്കിൽ ആഴ്ചയിൽഅടിസ്ഥാനം, അവരുടെ സൗകര്യം പോലെ. ഒരാൾക്ക് അവ എങ്ങനെ നേടാം എന്നതിനെക്കുറിച്ച് കൂടുതൽ പഠിക്കാംസാമ്പത്തിക ലക്ഷ്യങ്ങൾ ചിട്ടയായ നിക്ഷേപ പദ്ധതികൾക്കൊപ്പം, എങ്ങനെസിപ്പ് കാൽക്കുലേറ്റർ കൂടെ നിക്ഷേപത്തിൽ സഹായകരമാണ്മികച്ച മ്യൂച്വൽ ഫണ്ടുകൾ എസ്ഐപിക്ക് ഇന്ത്യയിൽ.
SIP- സാമ്പത്തിക ലക്ഷ്യങ്ങൾ കൈവരിക്കുന്നതിനുള്ള ഒപ്റ്റിമൽ മാർഗം
ഒരാൾക്ക് അവരുടെ നിക്ഷേപങ്ങൾ മുൻകൂട്ടി ആസൂത്രണം ചെയ്യാനും അവരുടെ സാമ്പത്തിക ലക്ഷ്യങ്ങൾക്കനുസരിച്ച് നിക്ഷേപിക്കാനും കഴിയുന്ന തരത്തിലാണ് SIP രൂപകൽപ്പന ചെയ്തിരിക്കുന്നത്. പക്ഷേ, എസ്ഐപി വഴി ലക്ഷ്യങ്ങൾ നേടുന്നതിന് ഒരാൾ ദീർഘകാലത്തേക്ക് നിക്ഷേപിക്കേണ്ടതുണ്ട്. സാധാരണയായി, എസ്ഐപി ഇത്തരം ലക്ഷ്യങ്ങൾ ആസൂത്രണം ചെയ്യുന്നതിന് വ്യാപകമായി ഉപയോഗിക്കുന്നു-
Talk to our investment specialist
- ഒരു കാർ വാങ്ങുന്നു
- ഒരു വീട് വാങ്ങുന്നു
- വിവാഹം
- കുട്ടിയുടെ വിദ്യാഭ്യാസം
- ഒരു അന്താരാഷ്ട്ര യാത്രയ്ക്കായി ലാഭിക്കുക
- വിരമിക്കൽ
- മെഡിക്കൽ അത്യാഹിതങ്ങൾ മുതലായവ.
ഒരാൾക്ക് ചുരുങ്ങിയത് 500 രൂപയും 1000 രൂപയും പോലെ SIP-കളിൽ നിക്ഷേപം ആരംഭിക്കാം. SIP-യിൽ നിക്ഷേപിക്കാൻ തുടങ്ങിയാൽ, നിങ്ങളുടെ പണം ഓരോ ദിവസവും സ്റ്റോക്കിൽ എത്തുമ്പോൾ അത് പോകും.വിപണി. അതുകൊണ്ടാണ് ഒരു റൂട്ടെന്ന നിലയിൽ എസ്ഐപികൾ കൂടുതലും തിരഞ്ഞെടുക്കുന്നത്ഇക്വിറ്റി ഫണ്ടുകൾ. മാത്രമല്ല, ചരിത്രപരമായി, അച്ചടക്കത്തോടെയും ദീർഘകാല ചക്രവാളത്തോടെയുമാണ് നിക്ഷേപം നടത്തിയതെങ്കിൽ, ഇക്വിറ്റി സ്റ്റോക്കുകളിലെ നിക്ഷേപം മറ്റെല്ലാ അസറ്റ് ക്ലാസുകൾക്കിടയിലും ശ്രദ്ധേയമായ വരുമാനം നൽകുന്നു.
ഇക്വിറ്റിയിലെ എസ്ഐപി വിപണിയുടെ സമയപരിധി ഒഴിവാക്കാനും നിക്ഷേപച്ചെലവ് ശരാശരി കണക്കാക്കി സമ്പത്ത് സൃഷ്ടിക്കുന്നത് സുഗമമാക്കാനും സഹായിക്കുന്നു. ചിലത് കൂടി നോക്കാംഎസ്ഐപിയുടെ പ്രയോജനങ്ങൾ ഇത് ദീർഘകാല ലക്ഷ്യങ്ങൾ കൈവരിക്കാൻ സഹായിക്കുന്നു:
സംയുക്തത്തിന്റെ ശക്തി- നിങ്ങൾ പ്രിൻസിപ്പലിൽ മാത്രം പലിശ നേടുമ്പോഴാണ് ലളിതമായ താൽപ്പര്യം. കൂട്ടുപലിശയുടെ കാര്യത്തിൽ, പലിശ തുക പ്രിൻസിപ്പലിലേക്ക് ചേർക്കുന്നു, കൂടാതെ പുതിയ പ്രിൻസിപ്പലിന്റെ (പഴയ പ്രിൻസിപ്പലിന്റെയും നേട്ടങ്ങളുടെയും) പലിശ കണക്കാക്കുന്നു. ഈ പ്രക്രിയ ഓരോ തവണയും തുടരുന്നു. എസ്ഐപി മുതൽമ്യൂച്വൽ ഫണ്ടുകൾ ഗഡുക്കളായി, അവ സംയോജിപ്പിച്ചിരിക്കുന്നു, ഇത് തുടക്കത്തിൽ നിക്ഷേപിച്ച തുകയിലേക്ക് കൂടുതൽ ചേർക്കുന്നു.
അപകടസാധ്യത കുറയ്ക്കൽ- ഒരു എസ്ഐപി ദീർഘകാലത്തേക്ക് വ്യാപിച്ചിരിക്കുന്നതിനാൽ, ഒരാൾ ഓഹരി വിപണിയുടെ എല്ലാ കാലഘട്ടങ്ങളും, ഉയർച്ചയും, അതിലും പ്രധാനമായി തകർച്ചയും മനസ്സിലാക്കുന്നു. മാന്ദ്യങ്ങളിൽ, മിക്ക നിക്ഷേപകരെയും ഭയം പിടികൂടുമ്പോൾ, നിക്ഷേപകർ "കുറഞ്ഞത്" വാങ്ങുന്നുവെന്ന് ഉറപ്പാക്കുന്നത് SIP തവണകൾ തുടരുന്നു.
എസ്ഐപികളുടെ സൗകര്യം- ഒരു SIP-യുടെ ഏറ്റവും വലിയ നേട്ടങ്ങളിലൊന്നാണ് സൗകര്യം. ഒരു ഉപയോക്താവ് ഒറ്റത്തവണ സൈൻ അപ്പ് ചെയ്യുകയും ഡോക്യുമെന്റേഷനിലൂടെ പോകുകയും വേണം. ഒരിക്കൽ ചെയ്തുകഴിഞ്ഞാൽ, തുടർന്നുള്ള നിക്ഷേപങ്ങൾക്കുള്ള ഡെബിറ്റുകൾ സ്വയമേവ നടക്കുംനിക്ഷേപകൻ നിക്ഷേപങ്ങൾ നിരീക്ഷിക്കേണ്ടതുണ്ട്.
SIP 2022 - 2023-നുള്ള ഇന്ത്യയിലെ മികച്ച മ്യൂച്വൽ ഫണ്ടുകൾ
SIP-നുള്ള മികച്ച ലാർജ് ക്യാപ് ഫണ്ടുകൾ
Fund NAV Net Assets (Cr) Min SIP Investment 3 MO (%) 6 MO (%) 1 YR (%) 3 YR (%) 5 YR (%) 2025 (%) Invesco India Largecap Fund Growth ₹68.25
↑ 0.69 ₹2,021 100 -3.7 2.6 -3.1 11.5 8.6 5.5 Bandhan Large Cap Fund Growth ₹74.104
↑ 0.80 ₹2,145 100 -4.2 -0.1 -4.8 10.6 7.9 8.2 BNP Paribas Large Cap Fund Growth ₹209.184
↑ 2.25 ₹2,641 300 -3.5 -0.8 -4.6 9.2 7.9 4.4 DSP TOP 100 Equity Growth ₹430.646
↑ 5.13 ₹7,101 500 -5.5 -3.9 -9.2 9.1 7.4 8.4 ICICI Prudential Bluechip Fund Growth ₹101.8
↑ 1.20 ₹80,206 100 -5.7 -3.9 -8.7 9.1 9.2 11.3 Note: Returns up to 1 year are on absolute basis & more than 1 year are on CAGR basis. as on 9 Oct 26 Research Highlights & Commentary of 5 Funds showcased
Commentary Invesco India Largecap Fund Bandhan Large Cap Fund BNP Paribas Large Cap Fund DSP TOP 100 Equity ICICI Prudential Bluechip Fund Point 1 Bottom quartile AUM (₹2,021 Cr). Bottom quartile AUM (₹2,145 Cr). Lower mid AUM (₹2,641 Cr). Upper mid AUM (₹7,101 Cr). Highest AUM (₹80,206 Cr). Point 2 Established history (17+ yrs). Established history (20+ yrs). Established history (22+ yrs). Oldest track record among peers (23 yrs). Established history (18+ yrs). Point 3 Rating: 3★ (upper mid). Rating: 2★ (bottom quartile). Rating: 3★ (lower mid). Rating: 2★ (bottom quartile). Top rated. Point 4 Risk profile: Moderately High. Risk profile: Moderately High. Risk profile: Moderately High. Risk profile: Moderately High. Risk profile: Moderately High. Point 5 5Y return: 8.56% (upper mid). 5Y return: 7.90% (lower mid). 5Y return: 7.87% (bottom quartile). 5Y return: 7.36% (bottom quartile). 5Y return: 9.16% (top quartile). Point 6 3Y return: 11.53% (top quartile). 3Y return: 10.56% (upper mid). 3Y return: 9.16% (lower mid). 3Y return: 9.11% (bottom quartile). 3Y return: 9.09% (bottom quartile). Point 7 1Y return: -3.10% (top quartile). 1Y return: -4.84% (lower mid). 1Y return: -4.58% (upper mid). 1Y return: -9.17% (bottom quartile). 1Y return: -8.67% (bottom quartile). Point 8 Alpha: 6.54 (top quartile). Alpha: 2.93 (upper mid). Alpha: 2.25 (lower mid). Alpha: -3.61 (bottom quartile). Alpha: -2.61 (bottom quartile). Point 9 Sharpe: 0.25 (top quartile). Sharpe: 0.05 (upper mid). Sharpe: 0.01 (lower mid). Sharpe: -0.38 (bottom quartile). Sharpe: -0.30 (bottom quartile). Point 10 Information ratio: 0.98 (top quartile). Information ratio: 0.90 (upper mid). Information ratio: 0.53 (lower mid). Information ratio: 0.13 (bottom quartile). Information ratio: 0.51 (bottom quartile). Invesco India Largecap Fund
Bandhan Large Cap Fund
BNP Paribas Large Cap Fund
DSP TOP 100 Equity
ICICI Prudential Bluechip Fund
SIP-യ്ക്കുള്ള മികച്ച മൾട്ടി ക്യാപ് ഫണ്ടുകൾ
Fund NAV Net Assets (Cr) Min SIP Investment 3 MO (%) 6 MO (%) 1 YR (%) 3 YR (%) 5 YR (%) 2025 (%) Aditya Birla Sun Life Manufacturing Equity Fund Growth ₹37.94
↑ 0.16 ₹1,402 1,000 2.5 15 15.9 19 12.8 3.5 BNP Paribas Multi Cap Fund Growth ₹73.5154
↓ -0.01 ₹588 300 -4.6 -2.6 19.3 17.3 13.6 Motilal Oswal Multicap 35 Fund Growth ₹61.8019
↑ 0.86 ₹14,160 500 4.7 12.8 -0.8 16.9 11.2 -5.6 Mahindra Badhat Yojana Growth ₹37.6425
↑ 0.31 ₹7,662 500 -0.3 8.7 6.8 14.8 12.4 3.4 Aditya Birla Sun Life Equity Fund Growth ₹1,868.58
↑ 23.09 ₹29,044 100 -1.7 5.4 3.4 13.3 9.5 11.2 Note: Returns up to 1 year are on absolute basis & more than 1 year are on CAGR basis. as on 9 Oct 26 Research Highlights & Commentary of 5 Funds showcased
Commentary Aditya Birla Sun Life Manufacturing Equity Fund BNP Paribas Multi Cap Fund Motilal Oswal Multicap 35 Fund Mahindra Badhat Yojana Aditya Birla Sun Life Equity Fund Point 1 Bottom quartile AUM (₹1,402 Cr). Bottom quartile AUM (₹588 Cr). Upper mid AUM (₹14,160 Cr). Lower mid AUM (₹7,662 Cr). Highest AUM (₹29,044 Cr). Point 2 Established history (11+ yrs). Established history (21+ yrs). Established history (12+ yrs). Established history (9+ yrs). Oldest track record among peers (28 yrs). Point 3 Not Rated. Rating: 4★ (upper mid). Top rated. Not Rated. Rating: 4★ (lower mid). Point 4 Risk profile: High. Risk profile: Moderately High. Risk profile: Moderately High. Risk profile: Moderately High. Risk profile: Moderately High. Point 5 5Y return: 12.82% (upper mid). 5Y return: 13.57% (top quartile). 5Y return: 11.22% (bottom quartile). 5Y return: 12.42% (lower mid). 5Y return: 9.48% (bottom quartile). Point 6 3Y return: 19.04% (top quartile). 3Y return: 17.28% (upper mid). 3Y return: 16.93% (lower mid). 3Y return: 14.82% (bottom quartile). 3Y return: 13.26% (bottom quartile). Point 7 1Y return: 15.92% (upper mid). 1Y return: 19.34% (top quartile). 1Y return: -0.85% (bottom quartile). 1Y return: 6.79% (lower mid). 1Y return: 3.40% (bottom quartile). Point 8 Alpha: 0.00 (bottom quartile). Alpha: 0.00 (bottom quartile). Alpha: 1.30 (lower mid). Alpha: 9.37 (top quartile). Alpha: 7.21 (upper mid). Point 9 Sharpe: 1.22 (upper mid). Sharpe: 2.86 (top quartile). Sharpe: 0.13 (bottom quartile). Sharpe: 0.72 (lower mid). Sharpe: 0.50 (bottom quartile). Point 10 Information ratio: 0.00 (bottom quartile). Information ratio: 0.00 (bottom quartile). Information ratio: 0.71 (upper mid). Information ratio: 0.71 (lower mid). Information ratio: 1.48 (top quartile). Aditya Birla Sun Life Manufacturing Equity Fund
BNP Paribas Multi Cap Fund
Motilal Oswal Multicap 35 Fund
Mahindra Badhat Yojana
Aditya Birla Sun Life Equity Fund
SIP-നുള്ള മികച്ച മിഡ് ക്യാപ് ഫണ്ടുകൾ
Fund NAV Net Assets (Cr) Min SIP Investment 3 MO (%) 6 MO (%) 1 YR (%) 3 YR (%) 5 YR (%) 2025 (%) ICICI Prudential MidCap Fund Growth ₹319.69
↑ 2.44 ₹8,403 100 -4.5 2.9 6.4 18.6 14.1 11.1 BNP Paribas Mid Cap Fund Growth ₹104.584
↑ 0.95 ₹2,658 300 -5.5 2.8 2.8 13.7 11.9 2.5 Aditya Birla Sun Life Midcap Fund Growth ₹806.64
↑ 8.40 ₹6,966 1,000 -3 7.3 3 13.1 11.2 4.4 TATA Mid Cap Growth Fund Growth ₹431.335
↑ 4.26 ₹6,240 150 -5.9 1.4 -0.2 12 11.7 5.8 Note: Returns up to 1 year are on absolute basis & more than 1 year are on CAGR basis. as on 9 Oct 26 Research Highlights & Commentary of 4 Funds showcased
Commentary ICICI Prudential MidCap Fund BNP Paribas Mid Cap Fund Aditya Birla Sun Life Midcap Fund TATA Mid Cap Growth Fund Point 1 Highest AUM (₹8,403 Cr). Bottom quartile AUM (₹2,658 Cr). Upper mid AUM (₹6,966 Cr). Lower mid AUM (₹6,240 Cr). Point 2 Established history (21+ yrs). Established history (20+ yrs). Established history (24+ yrs). Oldest track record among peers (32 yrs). Point 3 Rating: 2★ (lower mid). Top rated. Rating: 3★ (upper mid). Rating: 2★ (bottom quartile). Point 4 Risk profile: Moderately High. Risk profile: High. Risk profile: Moderately High. Risk profile: Moderately High. Point 5 5Y return: 14.09% (top quartile). 5Y return: 11.89% (upper mid). 5Y return: 11.23% (bottom quartile). 5Y return: 11.71% (lower mid). Point 6 3Y return: 18.63% (top quartile). 3Y return: 13.70% (upper mid). 3Y return: 13.07% (lower mid). 3Y return: 12.00% (bottom quartile). Point 7 1Y return: 6.38% (top quartile). 1Y return: 2.79% (lower mid). 1Y return: 2.97% (upper mid). 1Y return: -0.24% (bottom quartile). Point 8 Alpha: 6.99 (top quartile). Alpha: 2.09 (upper mid). Alpha: -0.53 (lower mid). Alpha: -1.08 (bottom quartile). Point 9 Sharpe: 0.84 (top quartile). Sharpe: 0.62 (upper mid). Sharpe: 0.46 (lower mid). Sharpe: 0.43 (bottom quartile). Point 10 Information ratio: 1.17 (top quartile). Information ratio: -0.14 (upper mid). Information ratio: -0.35 (lower mid). Information ratio: -0.64 (bottom quartile). ICICI Prudential MidCap Fund
BNP Paribas Mid Cap Fund
Aditya Birla Sun Life Midcap Fund
TATA Mid Cap Growth Fund
SIP-നുള്ള മികച്ച സ്മോൾ ക്യാപ് ഫണ്ടുകൾ
Fund NAV Net Assets (Cr) Min SIP Investment 3 MO (%) 6 MO (%) 1 YR (%) 3 YR (%) 5 YR (%) 2025 (%) IDBI Small Cap Fund Growth ₹34.2065
↑ 0.26 ₹832 500 2 21.3 12.1 16 14.9 -13.4 DSP Small Cap Fund Growth ₹223.036
↑ 0.76 ₹21,659 500 1.2 17.1 15.8 15.7 15.2 -2.8 Sundaram Small Cap Fund Growth ₹286.362
↑ 1.91 ₹4,155 100 -1.1 14.9 10.1 14.2 13.4 0.4 Aditya Birla Sun Life Small Cap Fund Growth ₹97.1267
↑ 0.63 ₹6,226 1,000 2.1 18.4 15 13.8 11.1 -3.7 Nippon India Small Cap Fund Growth ₹178.915
↑ 1.20 ₹82,580 100 -0.2 13.2 6.5 13.7 16.2 -4.7 Note: Returns up to 1 year are on absolute basis & more than 1 year are on CAGR basis. as on 9 Oct 26 Research Highlights & Commentary of 5 Funds showcased
Commentary IDBI Small Cap Fund DSP Small Cap Fund Sundaram Small Cap Fund Aditya Birla Sun Life Small Cap Fund Nippon India Small Cap Fund Point 1 Bottom quartile AUM (₹832 Cr). Upper mid AUM (₹21,659 Cr). Bottom quartile AUM (₹4,155 Cr). Lower mid AUM (₹6,226 Cr). Highest AUM (₹82,580 Cr). Point 2 Established history (9+ yrs). Established history (19+ yrs). Oldest track record among peers (21 yrs). Established history (19+ yrs). Established history (16+ yrs). Point 3 Not Rated. Rating: 4★ (upper mid). Rating: 3★ (bottom quartile). Top rated. Rating: 4★ (lower mid). Point 4 Risk profile: Moderately High. Risk profile: Moderately High. Risk profile: Moderately High. Risk profile: Moderately High. Risk profile: Moderately High. Point 5 5Y return: 14.90% (lower mid). 5Y return: 15.15% (upper mid). 5Y return: 13.45% (bottom quartile). 5Y return: 11.11% (bottom quartile). 5Y return: 16.19% (top quartile). Point 6 3Y return: 16.00% (top quartile). 3Y return: 15.74% (upper mid). 3Y return: 14.25% (lower mid). 3Y return: 13.84% (bottom quartile). 3Y return: 13.72% (bottom quartile). Point 7 1Y return: 12.06% (lower mid). 1Y return: 15.77% (top quartile). 1Y return: 10.07% (bottom quartile). 1Y return: 15.05% (upper mid). 1Y return: 6.53% (bottom quartile). Point 8 Alpha: 8.28 (upper mid). Alpha: 9.89 (top quartile). Alpha: 6.87 (lower mid). Alpha: 0.00 (bottom quartile). Alpha: 1.64 (bottom quartile). Point 9 Sharpe: 0.70 (lower mid). Sharpe: 0.71 (upper mid). Sharpe: 0.65 (bottom quartile). Sharpe: 0.84 (top quartile). Sharpe: 0.44 (bottom quartile). Point 10 Information ratio: 0.29 (upper mid). Information ratio: 0.47 (top quartile). Information ratio: 0.12 (lower mid). Information ratio: 0.00 (bottom quartile). Information ratio: -0.15 (bottom quartile). IDBI Small Cap Fund
DSP Small Cap Fund
Sundaram Small Cap Fund
Aditya Birla Sun Life Small Cap Fund
Nippon India Small Cap Fund
SIP-നുള്ള മികച്ച ELSS (നികുതി ലാഭിക്കൽ മ്യൂച്വൽ ഫണ്ടുകൾ).
Fund NAV Net Assets (Cr) Min SIP Investment 3 MO (%) 6 MO (%) 1 YR (%) 3 YR (%) 5 YR (%) 2025 (%) IDBI Equity Advantage Fund Growth ₹43.39
↑ 0.04 ₹485 500 9.7 15.1 16.9 20.8 10 HDFC Long Term Advantage Fund Growth ₹595.168
↑ 0.28 ₹1,318 500 1.2 15.4 35.5 20.6 17.4 Motilal Oswal Long Term Equity Fund Growth ₹55.0438
↑ 0.47 ₹5,134 500 0.3 10.7 4.9 19.1 15.2 -9.1 Baroda Pioneer ELSS 96 Growth ₹68.6676
↑ 0.33 ₹210 500 -6.1 -3.5 17.6 16.7 11.6 JM Tax Gain Fund Growth ₹50.2727
↑ 0.42 ₹242 500 0.1 11.1 1.7 14.1 11.3 2.5 Note: Returns up to 1 year are on absolute basis & more than 1 year are on CAGR basis. as on 28 Jul 23 Research Highlights & Commentary of 5 Funds showcased
Commentary IDBI Equity Advantage Fund HDFC Long Term Advantage Fund Motilal Oswal Long Term Equity Fund Baroda Pioneer ELSS 96 JM Tax Gain Fund Point 1 Lower mid AUM (₹485 Cr). Upper mid AUM (₹1,318 Cr). Highest AUM (₹5,134 Cr). Bottom quartile AUM (₹210 Cr). Bottom quartile AUM (₹242 Cr). Point 2 Established history (13+ yrs). Oldest track record among peers (25 yrs). Established history (11+ yrs). Established history (11+ yrs). Established history (18+ yrs). Point 3 Top rated. Rating: 3★ (upper mid). Not Rated. Not Rated. Rating: 3★ (lower mid). Point 4 Risk profile: Moderately High. Risk profile: Moderately High. Risk profile: Moderately High. Risk profile: Moderately High. Risk profile: Moderately High. Point 5 5Y return: 9.97% (bottom quartile). 5Y return: 17.39% (top quartile). 5Y return: 15.21% (upper mid). 5Y return: 11.62% (lower mid). 5Y return: 11.34% (bottom quartile). Point 6 3Y return: 20.84% (top quartile). 3Y return: 20.64% (upper mid). 3Y return: 19.07% (lower mid). 3Y return: 16.70% (bottom quartile). 3Y return: 14.06% (bottom quartile). Point 7 1Y return: 16.92% (lower mid). 1Y return: 35.51% (top quartile). 1Y return: 4.95% (bottom quartile). 1Y return: 17.56% (upper mid). 1Y return: 1.72% (bottom quartile). Point 8 Alpha: 1.78 (bottom quartile). Alpha: 1.75 (bottom quartile). Alpha: 11.90 (top quartile). Alpha: 5.69 (upper mid). Alpha: 5.40 (lower mid). Point 9 Sharpe: 1.21 (lower mid). Sharpe: 2.27 (upper mid). Sharpe: 0.62 (bottom quartile). Sharpe: 2.51 (top quartile). Sharpe: 0.22 (bottom quartile). Point 10 Information ratio: -1.13 (bottom quartile). Information ratio: -0.15 (bottom quartile). Information ratio: 0.76 (top quartile). Information ratio: -0.09 (lower mid). Information ratio: 0.70 (upper mid). IDBI Equity Advantage Fund
HDFC Long Term Advantage Fund
Motilal Oswal Long Term Equity Fund
Baroda Pioneer ELSS 96
JM Tax Gain Fund
SIP-നുള്ള മികച്ച സെക്ടർ ഫണ്ടുകൾ
Fund NAV Net Assets (Cr) Min SIP Investment 3 MO (%) 6 MO (%) 1 YR (%) 3 YR (%) 5 YR (%) 2025 (%) SBI Healthcare Opportunities Fund Growth ₹494.758
↑ 3.02 ₹5,796 500 -0.4 17.9 15 21.4 16.3 -3.5 BOI AXA Manufacturing and Infrastructure Fund Growth ₹65.02
↑ 0.48 ₹949 1,000 -1.4 10.6 13 19.6 18.1 7.8 UTI Healthcare Fund Growth ₹325.289
↑ 1.65 ₹1,444 500 -0.9 17.5 12.1 21.2 13.8 -3.1 SBI Magnum Global Fund Growth ₹390.392
↑ 1.33 ₹6,718 500 -0.1 12.9 11.8 5.3 6.5 -5.6 Aditya Birla Sun Life Infrastructure Fund Growth ₹104.26
↑ 0.68 ₹1,251 1,000 -0.9 10.9 9.9 15.1 15.4 0.7 Note: Returns up to 1 year are on absolute basis & more than 1 year are on CAGR basis. as on 9 Oct 26 Research Highlights & Commentary of 5 Funds showcased
Commentary SBI Healthcare Opportunities Fund BOI AXA Manufacturing and Infrastructure Fund UTI Healthcare Fund SBI Magnum Global Fund Aditya Birla Sun Life Infrastructure Fund Point 1 Upper mid AUM (₹5,796 Cr). Bottom quartile AUM (₹949 Cr). Lower mid AUM (₹1,444 Cr). Highest AUM (₹6,718 Cr). Bottom quartile AUM (₹1,251 Cr). Point 2 Established history (21+ yrs). Established history (16+ yrs). Oldest track record among peers (27 yrs). Established history (21+ yrs). Established history (20+ yrs). Point 3 Rating: 2★ (upper mid). Not Rated. Rating: 1★ (bottom quartile). Rating: 2★ (lower mid). Top rated. Point 4 Risk profile: High. Risk profile: High. Risk profile: High. Risk profile: Moderately High. Risk profile: High. Point 5 5Y return: 16.32% (upper mid). 5Y return: 18.11% (top quartile). 5Y return: 13.81% (bottom quartile). 5Y return: 6.51% (bottom quartile). 5Y return: 15.44% (lower mid). Point 6 3Y return: 21.41% (top quartile). 3Y return: 19.62% (lower mid). 3Y return: 21.17% (upper mid). 3Y return: 5.29% (bottom quartile). 3Y return: 15.09% (bottom quartile). Point 7 1Y return: 15.04% (top quartile). 1Y return: 13.04% (upper mid). 1Y return: 12.09% (lower mid). 1Y return: 11.79% (bottom quartile). 1Y return: 9.87% (bottom quartile). Point 8 Alpha: 4.67 (lower mid). Alpha: 0.00 (bottom quartile). Alpha: 1.26 (bottom quartile). Alpha: 6.24 (upper mid). Alpha: 12.80 (top quartile). Point 9 Sharpe: 1.17 (top quartile). Sharpe: 0.91 (lower mid). Sharpe: 0.94 (upper mid). Sharpe: 0.78 (bottom quartile). Sharpe: 0.60 (bottom quartile). Point 10 Information ratio: 0.08 (lower mid). Information ratio: 0.00 (bottom quartile). Information ratio: 0.18 (top quartile). Information ratio: -0.80 (bottom quartile). Information ratio: 0.10 (upper mid). SBI Healthcare Opportunities Fund
BOI AXA Manufacturing and Infrastructure Fund
UTI Healthcare Fund
SBI Magnum Global Fund
Aditya Birla Sun Life Infrastructure Fund
എസ്ഐപിയ്ക്കായുള്ള മികച്ച ഫോക്കസ്ഡ് ഫണ്ടുകൾ
Fund NAV Net Assets (Cr) Min SIP Investment 3 MO (%) 6 MO (%) 1 YR (%) 3 YR (%) 5 YR (%) 2025 (%) Sundaram Select Focus Fund Growth ₹264.968
↓ -1.18 ₹1,354 100 -5 8.5 24.5 17 17.3 ICICI Prudential Focused Equity Fund Growth ₹89.94
↑ 0.79 ₹17,949 100 -5.5 0.3 -4 14.8 12.4 15.4 Motilal Oswal Focused 25 Fund Growth ₹53.4494
↑ 0.58 ₹1,827 500 8.6 26.9 23 13.8 9.4 -1.7 HDFC Focused 30 Fund Growth ₹223.223
↑ 2.80 ₹28,201 300 -3.4 0.4 -5.1 13.5 14.7 10.9 SBI Focused Equity Fund Growth ₹382.007
↓ -6.86 ₹51,248 500 -1.4 6.2 6.6 13.1 9.4 15.7 Note: Returns up to 1 year are on absolute basis & more than 1 year are on CAGR basis. as on 24 Dec 21 Research Highlights & Commentary of 5 Funds showcased
Commentary Sundaram Select Focus Fund ICICI Prudential Focused Equity Fund Motilal Oswal Focused 25 Fund HDFC Focused 30 Fund SBI Focused Equity Fund Point 1 Bottom quartile AUM (₹1,354 Cr). Lower mid AUM (₹17,949 Cr). Bottom quartile AUM (₹1,827 Cr). Upper mid AUM (₹28,201 Cr). Highest AUM (₹51,248 Cr). Point 2 Oldest track record among peers (24 yrs). Established history (17+ yrs). Established history (13+ yrs). Established history (22+ yrs). Established history (22+ yrs). Point 3 Top rated. Rating: 2★ (bottom quartile). Rating: 3★ (upper mid). Rating: 3★ (lower mid). Rating: 2★ (bottom quartile). Point 4 Risk profile: Moderately High. Risk profile: Moderately High. Risk profile: Moderately High. Risk profile: Moderately High. Risk profile: Moderately High. Point 5 5Y return: 17.29% (top quartile). 5Y return: 12.38% (lower mid). 5Y return: 9.38% (bottom quartile). 5Y return: 14.74% (upper mid). 5Y return: 9.42% (bottom quartile). Point 6 3Y return: 17.03% (top quartile). 3Y return: 14.80% (upper mid). 3Y return: 13.83% (lower mid). 3Y return: 13.48% (bottom quartile). 3Y return: 13.06% (bottom quartile). Point 7 1Y return: 24.49% (top quartile). 1Y return: -3.96% (bottom quartile). 1Y return: 22.99% (upper mid). 1Y return: -5.11% (bottom quartile). 1Y return: 6.65% (lower mid). Point 8 Alpha: -5.62 (bottom quartile). Alpha: 0.82 (lower mid). Alpha: 21.70 (top quartile). Alpha: -1.72 (bottom quartile). Alpha: 11.09 (upper mid). Point 9 Sharpe: 1.85 (top quartile). Sharpe: 0.08 (bottom quartile). Sharpe: 1.22 (upper mid). Sharpe: -0.04 (bottom quartile). Sharpe: 0.61 (lower mid). Point 10 Information ratio: -0.52 (bottom quartile). Information ratio: 1.30 (top quartile). Information ratio: 0.14 (bottom quartile). Information ratio: 0.69 (upper mid). Information ratio: 0.60 (lower mid). Sundaram Select Focus Fund
ICICI Prudential Focused Equity Fund
Motilal Oswal Focused 25 Fund
HDFC Focused 30 Fund
SBI Focused Equity Fund
SIP-നുള്ള മികച്ച മൂല്യ ഫണ്ടുകൾ
Fund NAV Net Assets (Cr) Min SIP Investment 3 MO (%) 6 MO (%) 1 YR (%) 3 YR (%) 5 YR (%) 2025 (%) HDFC Capital Builder Value Fund Growth ₹756.578
↑ 7.16 ₹8,266 300 -2.4 4.6 1.7 14 11.5 8.6 Aditya Birla Sun Life Pure Value Fund Growth ₹130.925
↑ 1.20 ₹6,925 1,000 -2.6 6.4 5.8 12.2 11.6 2.6 Nippon India Value Fund Growth ₹209.212
↑ 2.00 ₹9,043 100 -6.6 -2.6 -8.3 11.5 10.8 4.2 Tata Equity PE Fund Growth ₹337.178
↑ 5.12 ₹8,656 150 -2.7 -0.4 -4.1 11.3 10.9 3.7 Tata Equity P/E Fund Regular Plan - Dividend Trigger A (5%) Normal Dividend, Reinvestment ₹125.424
↑ 1.90 ₹8,656 150 -2.7 -0.4 -4.1 11.3 10.9 3.7 Note: Returns up to 1 year are on absolute basis & more than 1 year are on CAGR basis. as on 9 Oct 26 Research Highlights & Commentary of 5 Funds showcased
Commentary HDFC Capital Builder Value Fund Aditya Birla Sun Life Pure Value Fund Nippon India Value Fund Tata Equity PE Fund Tata Equity P/E Fund Regular Plan - Dividend Trigger A (5%) Point 1 Bottom quartile AUM (₹8,266 Cr). Bottom quartile AUM (₹6,925 Cr). Highest AUM (₹9,043 Cr). Upper mid AUM (₹8,656 Cr). Lower mid AUM (₹8,656 Cr). Point 2 Oldest track record among peers (32 yrs). Established history (18+ yrs). Established history (21+ yrs). Established history (22+ yrs). Established history (17+ yrs). Point 3 Rating: 3★ (upper mid). Rating: 3★ (lower mid). Not Rated. Top rated. Not Rated. Point 4 Risk profile: Moderately High. Risk profile: Moderately High. Risk profile: Moderately High. Risk profile: Moderately High. Risk profile: Moderately High. Point 5 5Y return: 11.51% (upper mid). 5Y return: 11.63% (top quartile). 5Y return: 10.79% (bottom quartile). 5Y return: 10.92% (lower mid). 5Y return: 10.88% (bottom quartile). Point 6 3Y return: 13.96% (top quartile). 3Y return: 12.20% (upper mid). 3Y return: 11.53% (lower mid). 3Y return: 11.28% (bottom quartile). 3Y return: 11.25% (bottom quartile). Point 7 1Y return: 1.73% (upper mid). 1Y return: 5.78% (top quartile). 1Y return: -8.28% (bottom quartile). 1Y return: -4.11% (bottom quartile). 1Y return: -4.11% (lower mid). Point 8 Alpha: 5.61 (upper mid). Alpha: 11.48 (top quartile). Alpha: -1.87 (bottom quartile). Alpha: 1.44 (lower mid). Alpha: 1.44 (bottom quartile). Point 9 Sharpe: 0.38 (upper mid). Sharpe: 0.70 (top quartile). Sharpe: -0.04 (bottom quartile). Sharpe: 0.16 (lower mid). Sharpe: 0.16 (bottom quartile). Point 10 Information ratio: 1.76 (top quartile). Information ratio: 0.47 (lower mid). Information ratio: 0.72 (upper mid). Information ratio: 0.31 (bottom quartile). Information ratio: 0.30 (bottom quartile). HDFC Capital Builder Value Fund
Aditya Birla Sun Life Pure Value Fund
Nippon India Value Fund
Tata Equity PE Fund
Tata Equity P/E Fund Regular Plan - Dividend Trigger A (5%)
SIP കാൽക്കുലേറ്റർ
മ്യൂച്വൽ ഫണ്ടുകളിൽ നിക്ഷേപിക്കുമ്പോൾ ഒരു നിക്ഷേപകന് ഉപയോഗിക്കാൻ കഴിയുന്ന കാര്യക്ഷമമായ ഉപകരണങ്ങളിലൊന്നാണ് SIP കാൽക്കുലേറ്റർ. ഒരാൾക്ക് ഒരു കാർ/വീട് വാങ്ങാനോ, റിട്ടയർമെന്റ് പ്ലാൻ ചെയ്യാനോ, ഒരു കുട്ടിയുടെ ഉന്നത വിദ്യാഭ്യാസത്തിനോ അല്ലെങ്കിൽ മറ്റേതെങ്കിലും ആസ്തിക്കോ വേണ്ടി നിക്ഷേപിക്കണമെന്നുണ്ടെങ്കിൽ, അതിന് SIP കാൽക്കുലേറ്റർ ഉപയോഗിക്കാം. പ്രത്യേക സാമ്പത്തിക ലക്ഷ്യത്തിലെത്താൻ നിക്ഷേപത്തിന് ആവശ്യമായ നിക്ഷേപത്തിന്റെ അളവും സമയ കാലയളവും കണക്കാക്കാൻ ഇത് സഹായിക്കുന്നു. അതിനാൽ, സാധാരണ ചോദ്യങ്ങൾ "എത്രയാണ്ഒരു എസ്ഐപിയിൽ നിക്ഷേപിക്കുക അല്ലെങ്കിൽ ആ സമയം വരെ ഞാൻ എങ്ങനെ നിക്ഷേപിക്കണം", ഈ കാൽക്കുലേറ്റർ ഉപയോഗിച്ച് പരിഹരിക്കുന്നു.
ഒരു SIP കാൽക്കുലേറ്റർ ഉപയോഗിക്കുമ്പോൾ, ചില വേരിയബിളുകൾ പൂരിപ്പിക്കേണ്ടതുണ്ട്, അതിൽ (ചിത്രം ചുവടെ നൽകിയിരിക്കുന്നു)-
- ആവശ്യമുള്ള നിക്ഷേപ കാലയളവ്
- കണക്കാക്കിയ പ്രതിമാസ SIP തുക
- പ്രതീക്ഷിച്ചത്പണപ്പെരുപ്പം വരും വർഷങ്ങളിലെ നിരക്ക് (വാർഷികം).
- നിക്ഷേപങ്ങളുടെ ദീർഘകാല വളർച്ചാ നിരക്ക്
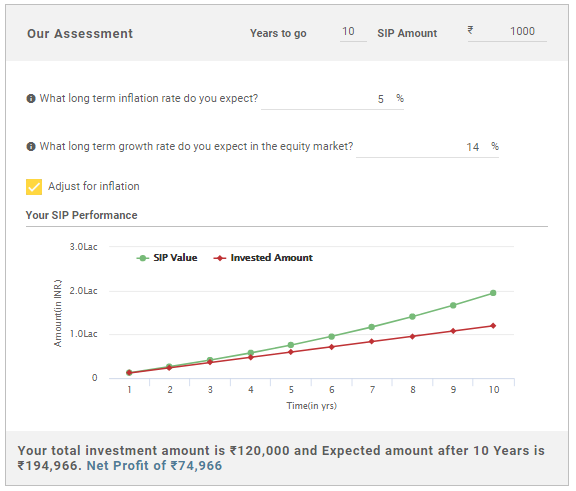
മുകളിൽ പറഞ്ഞിരിക്കുന്ന എല്ലാ വിവരങ്ങളും നിങ്ങൾ ഫീഡ് ചെയ്തുകഴിഞ്ഞാൽ, സൂചിപ്പിച്ച വർഷങ്ങളുടെ എണ്ണത്തിന് ശേഷം നിങ്ങൾക്ക് ലഭിക്കുന്ന തുക (നിങ്ങളുടെ SIP റിട്ടേണുകൾ) കാൽക്കുലേറ്റർ നിങ്ങൾക്ക് നൽകും. നിങ്ങളുടെ അറ്റാദായവും ഹൈലൈറ്റ് ചെയ്യപ്പെടും, അതനുസരിച്ച് നിങ്ങളുടെ ലക്ഷ്യ പൂർത്തീകരണം നിങ്ങൾക്ക് കണക്കാക്കാം.
മികച്ച മ്യൂച്വൽ ഫണ്ടുകളിൽ എങ്ങനെ നിക്ഷേപിക്കാം?
Fincash.com-ൽ ആജീവനാന്ത സൗജന്യ നിക്ഷേപ അക്കൗണ്ട് തുറക്കുക.
നിങ്ങളുടെ രജിസ്ട്രേഷനും KYC പ്രക്രിയയും പൂർത്തിയാക്കുക
രേഖകൾ അപ്ലോഡ് ചെയ്യുക (പാൻ, ആധാർ മുതലായവ).കൂടാതെ, നിങ്ങൾ നിക്ഷേപിക്കാൻ തയ്യാറാണ്!
ഇവിടെ നൽകിയിരിക്കുന്ന വിവരങ്ങൾ കൃത്യമാണെന്ന് ഉറപ്പാക്കാൻ എല്ലാ ശ്രമങ്ങളും നടത്തിയിട്ടുണ്ട്. എന്നിരുന്നാലും, ഡാറ്റയുടെ കൃത്യത സംബന്ധിച്ച് യാതൊരു ഉറപ്പും നൽകുന്നില്ല. എന്തെങ്കിലും നിക്ഷേപം നടത്തുന്നതിന് മുമ്പ് സ്കീം വിവര രേഖ ഉപയോഗിച്ച് പരിശോധിക്കുക.
You Might Also Like










AMFI Registration No. 112358 | CIN: U74999MH2016PTC282153
Shepard Technologies Pvt. Ltd. (with ARN code 112358) makes no warranties or representations, express or implied, on products offered through the platform. It accepts no liability for any damages or losses, however caused, in connection with the use of, or on the reliance of its product or related services. Terms and conditions of the website are applicable.
©2026 Shepard Technologies Private Limited. All Rights Reserved