8 सर्वोत्तम आंतरराष्ट्रीय म्युच्युअल फंड 2022
आंतरराष्ट्रीयम्युच्युअल फंड शिवाय परदेशी बाजारात गुंतवणूक करणारे फंड आहेतगुंतवणूकदारच्या राहण्याचा देश. दुसरीकडे,जागतिक निधी परदेशी बाजारपेठांमध्ये तसेच गुंतवणूकदाराच्या राहत्या देशात गुंतवणूक करा. आंतरराष्ट्रीय म्युच्युअल फंडांना "परदेशी निधी" म्हणून देखील ओळखले जाते आणि ते 'निधीचा निधी' रणनीती.
आंतरराष्ट्रीय म्युच्युअल फंड हे गेल्या काही वर्षांत स्थानिक बाजारातील अस्थिरतेमुळे गुंतवणूकदारांसाठी आकर्षक गुंतवणूक पर्याय बनले आहेत.अर्थव्यवस्था त्याच्या चढ-उतारांमधून जात आहे.
भारतातील आंतरराष्ट्रीय म्युच्युअल फंडांची पार्श्वभूमी
रिझर्व्हच्या परवानगीनेबँक भारताचे (RBI), आंतरराष्ट्रीय म्युच्युअल फंड 2007 मध्ये भारतात उघडले गेले. प्रत्येक फंडाला USD 500 दशलक्ष निधी मिळण्याची परवानगी आहे.
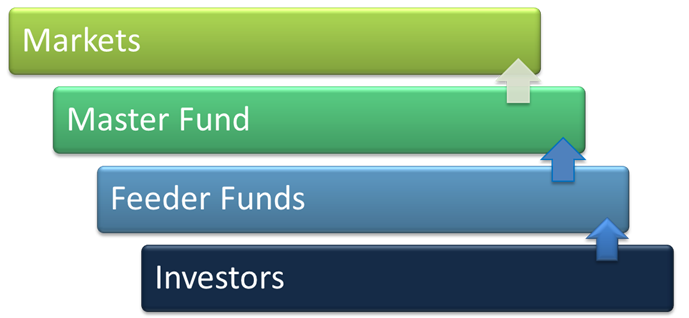
आंतरराष्ट्रीय म्युच्युअल फंडांची मास्टर-फीडर संरचना
इंटरनॅशनल म्युच्युअल फंड मास्टर-फीडर स्ट्रक्चर फॉलो करतात. मास्टर-फीडर स्ट्रक्चर ही तीन-स्तरीय रचना असते जिथे गुंतवणूकदार त्यांचे पैसे फीडर फंडमध्ये ठेवतात जे नंतर मास्टर फंडमध्ये गुंतवणूक करतात. मास्टर फंड नंतर पैसे गुंतवतोबाजार. फीडर फंड ऑन-शोअरवर आधारित आहे, म्हणजे भारतात, तर, मास्टर फंड ऑफ-शोअर (लक्समबर्ग इत्यादीसारख्या परदेशी भूगोलात) आधारित आहे.
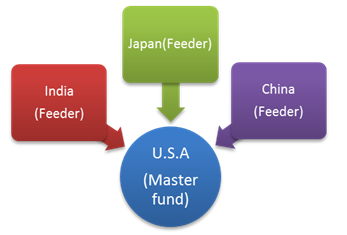
मास्टर फंडामध्ये अनेक फीडर फंड असू शकतात. उदाहरणार्थ,
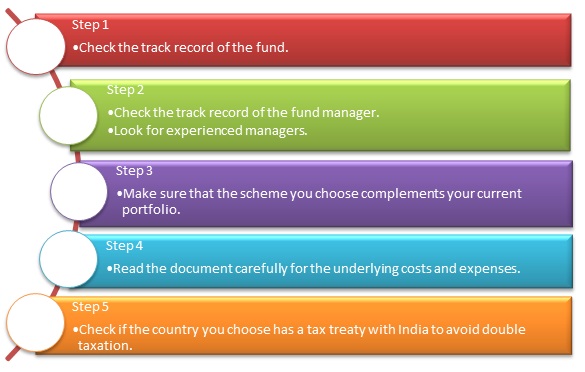
आंतरराष्ट्रीय म्युच्युअल फंड कसा निवडायचा?
योग्य फंडाची निवड करताना काही गोष्टी लक्षात ठेवल्या पाहिजेत.
आर्थिक वर्ष 22 - 23 मध्ये गुंतवणूक करण्यासाठी सर्वोत्तम आंतरराष्ट्रीय म्युच्युअल फंड
The primary investment objective of the Scheme is to seek capital appreciation by investing predominantly in the units of BlackRock Global Funds – World Mining Fund. The Scheme may, at the discretion of the Investment Manager, also invest in the units of other similar overseas mutual fund schemes, which may
constitute a significant part of its corpus. The Scheme may also invest a certain portion of its corpus in money market securities and/or money market/liquid schemes of DSP BlackRock Mutual Fund, in order to meet liquidity requirements from time to time. Research Highlights for DSP World Mining Fund Below is the key information for DSP World Mining Fund Returns up to 1 year are on "The primary investment objective of the Scheme is to seek capital appreciation by investing predominantly in units of MLIIF - WGF. The Scheme may, at the discretion of the Investment Manager, also invest in the units of other similar overseas mutual fund schemes, which may constitute a significant part of its corpus. The Scheme may also invest a certain portion of its corpus in money market securities and/or units of money market/liquid schemes of DSP Merrill Lynch Mutual Fund, in order to meet liquidity requirements from time to time. However, there is no assurance that the investment objective of the Scheme will be realized." Research Highlights for DSP World Gold Fund Below is the key information for DSP World Gold Fund Returns up to 1 year are on The primary investment objective of the Scheme is to seek to provide long term capital growth by investing predominantly in the JPMorgan Funds - Emerging Markets Opportunities Fund, an equity fund which invests primarily in an aggressively managed portfolio of emerging market companies Research Highlights for Edelweiss Emerging Markets Opportunities Equity Off-shore Fund Below is the key information for Edelweiss Emerging Markets Opportunities Equity Off-shore Fund Returns up to 1 year are on The investment objective of the scheme is to provide long-term capital appreciation by investing in an overseas mutual fund scheme that invests in a diversified portfolio of securities as prescribed by SEBI from time to time in global emerging markets. Research Highlights for Kotak Global Emerging Market Fund Below is the key information for Kotak Global Emerging Market Fund Returns up to 1 year are on The primary investment objective of the Scheme is to seek capital appreciation by investing predominantly in the units of BlackRock Global Funds – World Energy Fund and BlackRock Global Funds – New Energy Fund. The Scheme may, at the discretion of the Investment Manager, also invest in the units of other similar overseas mutual fund schemes, which may constitute a significant part of its corpus. The Scheme may also invest a certain portion of its corpus in money market securities
and/or money market/liquid schemes of DSP BlackRock Mutual Fund, in order to meet liquidity
requirements from time to time. Research Highlights for DSP World Energy Fund Below is the key information for DSP World Energy Fund Returns up to 1 year are on The primary investment objective of the Scheme is to seek capital appreciation by investing predominantly in units of BGF – USFEF. The Scheme may, at the discretion of the Investment Manager also invest in the units of other similar overseas mutual fund schemes, which may constitute a significant part of its corpus. The Scheme may also invest a certain portion of its corpus in money market securities and/or money market/liquid schemes of DSP BlackRock Mutual Fund, in order to meet liquidity requirements from time to time. However, there is no assurance that the investment objective of the Scheme will be realized. It shall be noted ‘similar overseas mutual fund schemes’ shall have investment objective, investment strategy and risk profile/consideration similar to those of BGF – USFEF. Research Highlights for DSP US Flexible Equity Fund Below is the key information for DSP US Flexible Equity Fund Returns up to 1 year are on An open-end diversified equity fund that seeks to provide medium to long term appreciation through investments primarily in Asian Companies / sectors (excluding Japan) with long term potential across market capitalisation. Research Highlights for Franklin Asian Equity Fund Below is the key information for Franklin Asian Equity Fund Returns up to 1 year are on The primary investment objective of Reliance Japan Equity Fund is to provide long term capital appreciation to investors by primarily investing in equity and equity related securities of companies listed on the recognized stock exchanges of Japan and the secondary objective is to generate consistent returns by investing in debt and money market securities of India. However, there can be no assurance or guarantee that the investment objective of the scheme will be achieved. Research Highlights for Nippon India Japan Equity Fund Below is the key information for Nippon India Japan Equity Fund Returns up to 1 year are on Fund NAV Net Assets (Cr) Min SIP Investment 3 MO (%) 6 MO (%) 1 YR (%) 3 YR (%) 5 YR (%) 2025 (%) DSP World Mining Fund Growth ₹29.5133
↑ 0.29 ₹187 500 -9.6 3.4 69.7 23.6 15 79 DSP World Gold Fund Growth ₹50.0235
↑ 0.83 ₹1,679 500 -19.8 -11.2 67.6 44.7 22.6 167.1 Edelweiss Emerging Markets Opportunities Equity Off-shore Fund Growth ₹28.5583
↑ 0.45 ₹250 1,000 16 30 65.9 27.6 10.2 41.1 Kotak Global Emerging Market Fund Growth ₹39.397
↑ 0.33 ₹1,793 1,000 13.9 23.3 54 26 11 39.1 DSP World Energy Fund Growth ₹29.3381
↑ 0.33 ₹122 500 5.6 20.6 50.4 17.9 12.3 39.2 DSP US Flexible Equity Fund Growth ₹93.7161
↑ 1.39 ₹1,323 500 15.8 19.8 47.3 27.4 18.2 33.8 Franklin Asian Equity Fund Growth ₹44.9329
↑ 0.28 ₹870 500 17.2 22.3 46.3 21.1 7.6 23.7 Nippon India Japan Equity Fund Growth ₹27.5127
↑ 0.19 ₹348 100 10.4 19.5 38.3 19.7 10.4 19.8 Note: Returns up to 1 year are on absolute basis & more than 1 year are on CAGR basis. as on 9 Jul 26 Research Highlights & Commentary of 8 Funds showcased
Commentary DSP World Mining Fund DSP World Gold Fund Edelweiss Emerging Markets Opportunities Equity Off-shore Fund Kotak Global Emerging Market Fund DSP World Energy Fund DSP US Flexible Equity Fund Franklin Asian Equity Fund Nippon India Japan Equity Fund Point 1 Bottom quartile AUM (₹187 Cr). Top quartile AUM (₹1,679 Cr). Lower mid AUM (₹250 Cr). Highest AUM (₹1,793 Cr). Bottom quartile AUM (₹122 Cr). Upper mid AUM (₹1,323 Cr). Upper mid AUM (₹870 Cr). Lower mid AUM (₹348 Cr). Point 2 Established history (16+ yrs). Oldest track record among peers (18 yrs). Established history (12+ yrs). Established history (18+ yrs). Established history (16+ yrs). Established history (13+ yrs). Established history (18+ yrs). Established history (11+ yrs). Point 3 Rating: 3★ (upper mid). Rating: 3★ (lower mid). Rating: 3★ (lower mid). Rating: 3★ (bottom quartile). Rating: 2★ (bottom quartile). Top rated. Rating: 5★ (top quartile). Rating: 4★ (upper mid). Point 4 Risk profile: High. Risk profile: High. Risk profile: High. Risk profile: High. Risk profile: High. Risk profile: High. Risk profile: High. Risk profile: High. Point 5 5Y return: 14.96% (upper mid). 5Y return: 22.59% (top quartile). 5Y return: 10.19% (bottom quartile). 5Y return: 11.02% (lower mid). 5Y return: 12.31% (upper mid). 5Y return: 18.23% (top quartile). 5Y return: 7.64% (bottom quartile). 5Y return: 10.35% (lower mid). Point 6 3Y return: 23.57% (lower mid). 3Y return: 44.67% (top quartile). 3Y return: 27.56% (top quartile). 3Y return: 25.99% (upper mid). 3Y return: 17.87% (bottom quartile). 3Y return: 27.37% (upper mid). 3Y return: 21.06% (lower mid). 3Y return: 19.71% (bottom quartile). Point 7 1Y return: 69.71% (top quartile). 1Y return: 67.61% (top quartile). 1Y return: 65.94% (upper mid). 1Y return: 54.02% (upper mid). 1Y return: 50.38% (lower mid). 1Y return: 47.32% (lower mid). 1Y return: 46.30% (bottom quartile). 1Y return: 38.32% (bottom quartile). Point 8 Alpha: 0.00 (top quartile). Alpha: -0.46 (lower mid). Alpha: 5.56 (top quartile). Alpha: -1.76 (lower mid). Alpha: 0.00 (upper mid). Alpha: -3.23 (bottom quartile). Alpha: 0.00 (upper mid). Alpha: -4.04 (bottom quartile). Point 9 Sharpe: 2.76 (top quartile). Sharpe: 1.77 (lower mid). Sharpe: 2.62 (upper mid). Sharpe: 2.29 (lower mid). Sharpe: 4.00 (top quartile). Sharpe: 2.57 (upper mid). Sharpe: 1.73 (bottom quartile). Sharpe: 1.59 (bottom quartile). Point 10 Information ratio: 0.00 (top quartile). Information ratio: -0.78 (bottom quartile). Information ratio: -0.40 (lower mid). Information ratio: -0.25 (lower mid). Information ratio: 0.00 (upper mid). Information ratio: 0.13 (top quartile). Information ratio: 0.00 (upper mid). Information ratio: -1.05 (bottom quartile). DSP World Mining Fund
DSP World Gold Fund
Edelweiss Emerging Markets Opportunities Equity Off-shore Fund
Kotak Global Emerging Market Fund
DSP World Energy Fund
DSP US Flexible Equity Fund
Franklin Asian Equity Fund
Nippon India Japan Equity Fund
10 कोटी अधिकचे आणि मागील एका वर्षाच्या रिटर्नवर क्रमवारी लावलेले.1. DSP World Mining Fund
DSP World Mining Fund
Growth Launch Date 29 Dec 09 NAV (09 Jul 26) ₹29.5133 ↑ 0.29 (1.00 %) Net Assets (Cr) ₹187 on 31 May 26 Category Equity - Global AMC DSP BlackRock Invmt Managers Pvt. Ltd. Rating ☆☆☆ Risk High Expense Ratio 1.14 Sharpe Ratio 2.76 Information Ratio 0 Alpha Ratio 0 Min Investment 1,000 Min SIP Investment 500 Exit Load 0-12 Months (1%),12 Months and above(NIL) Growth of 10,000 investment over the years.
Date Value 30 Jun 21 ₹10,000 30 Jun 22 ₹9,282 30 Jun 23 ₹10,814 30 Jun 24 ₹11,032 30 Jun 25 ₹11,747 30 Jun 26 ₹20,331 Returns for DSP World Mining Fund
absolute basis & more than 1 year are on CAGR (Compound Annual Growth Rate) basis. as on 9 Jul 26 Duration Returns 1 Month -8.5% 3 Month -9.6% 6 Month 3.4% 1 Year 69.7% 3 Year 23.6% 5 Year 15% 10 Year 15 Year Since launch 6.8% Historical performance (Yearly) on absolute basis
Year Returns 2025 79% 2024 -8.1% 2023 0% 2022 12.2% 2021 18% 2020 34.9% 2019 21.5% 2018 -9.4% 2017 21.1% 2016 49.7% Fund Manager information for DSP World Mining Fund
Name Since Tenure Kaivalya Nadkarni 1 May 25 1.17 Yr. Data below for DSP World Mining Fund as on 31 May 26
Equity Sector Allocation
Sector Value Basic Materials 93.17% Energy 1.11% Asset Allocation
Asset Class Value Cash 5.71% Equity 94.28% Debt 0.01% Top Securities Holdings / Portfolio
Name Holding Value Quantity BGF World Mining I2
Investment Fund | -96% ₹180 Cr 141,035 Treps / Reverse Repo Investments
CBLO/Reverse Repo | -4% ₹7 Cr Net Receivables/Payables
Net Current Assets | -0% ₹0 Cr 2. DSP World Gold Fund
DSP World Gold Fund
Growth Launch Date 14 Sep 07 NAV (09 Jul 26) ₹50.0235 ↑ 0.83 (1.69 %) Net Assets (Cr) ₹1,679 on 31 May 26 Category Equity - Global AMC DSP BlackRock Invmt Managers Pvt. Ltd. Rating ☆☆☆ Risk High Expense Ratio 1.41 Sharpe Ratio 1.77 Information Ratio -0.78 Alpha Ratio -0.46 Min Investment 1,000 Min SIP Investment 500 Exit Load 0-12 Months (1%),12 Months and above(NIL) Growth of 10,000 investment over the years.
Date Value 30 Jun 21 ₹10,000 30 Jun 22 ₹8,181 30 Jun 23 ₹9,294 30 Jun 24 ₹10,640 30 Jun 25 ₹16,808 30 Jun 26 ₹27,693 Returns for DSP World Gold Fund
absolute basis & more than 1 year are on CAGR (Compound Annual Growth Rate) basis. as on 9 Jul 26 Duration Returns 1 Month -4.4% 3 Month -19.8% 6 Month -11.2% 1 Year 67.6% 3 Year 44.7% 5 Year 22.6% 10 Year 15 Year Since launch 8.9% Historical performance (Yearly) on absolute basis
Year Returns 2025 167.1% 2024 15.9% 2023 7% 2022 -7.7% 2021 -9% 2020 31.4% 2019 35.1% 2018 -10.7% 2017 -4% 2016 52.7% Fund Manager information for DSP World Gold Fund
Name Since Tenure Kaivalya Nadkarni 1 May 25 1.17 Yr. Data below for DSP World Gold Fund as on 31 May 26
Equity Sector Allocation
Sector Value Basic Materials 94.47% Asset Allocation
Asset Class Value Cash 3.62% Equity 94.47% Debt 0% Other 1.91% Top Securities Holdings / Portfolio
Name Holding Value Quantity BGF World Gold I2
Investment Fund | -68% ₹1,141 Cr 1,005,044 VanEck Gold Miners ETF
- | GDX29% ₹490 Cr 573,719 Treps / Reverse Repo Investments
CBLO/Reverse Repo | -3% ₹54 Cr Net Receivables/Payables
Net Current Assets | -0% -₹6 Cr 3. Edelweiss Emerging Markets Opportunities Equity Off-shore Fund
Edelweiss Emerging Markets Opportunities Equity Off-shore Fund
Growth Launch Date 7 Jul 14 NAV (09 Jul 26) ₹28.5583 ↑ 0.45 (1.61 %) Net Assets (Cr) ₹250 on 31 May 26 Category Equity - Global AMC Edelweiss Asset Management Limited Rating ☆☆☆ Risk High Expense Ratio 1.04 Sharpe Ratio 2.62 Information Ratio -0.4 Alpha Ratio 5.56 Min Investment 5,000 Min SIP Investment 1,000 Exit Load 0-1 Years (1%),1 Years and above(NIL) Growth of 10,000 investment over the years.
Date Value 30 Jun 21 ₹10,000 30 Jun 22 ₹7,234 30 Jun 23 ₹7,605 30 Jun 24 ₹8,447 30 Jun 25 ₹9,445 30 Jun 26 ₹15,783 Returns for Edelweiss Emerging Markets Opportunities Equity Off-shore Fund
absolute basis & more than 1 year are on CAGR (Compound Annual Growth Rate) basis. as on 9 Jul 26 Duration Returns 1 Month 0% 3 Month 16% 6 Month 30% 1 Year 65.9% 3 Year 27.6% 5 Year 10.2% 10 Year 15 Year Since launch 9.1% Historical performance (Yearly) on absolute basis
Year Returns 2025 41.1% 2024 5.9% 2023 5.5% 2022 -16.8% 2021 -5.9% 2020 21.7% 2019 25.1% 2018 -7.2% 2017 30% 2016 9.8% Fund Manager information for Edelweiss Emerging Markets Opportunities Equity Off-shore Fund
Name Since Tenure Bhavesh Jain 9 Apr 18 8.23 Yr. Bharat Lahoti 1 Oct 21 4.75 Yr. Data below for Edelweiss Emerging Markets Opportunities Equity Off-shore Fund as on 31 May 26
Equity Sector Allocation
Sector Value Technology 35.88% Financial Services 20.6% Consumer Cyclical 10.01% Communication Services 7.79% Industrials 5.82% Energy 5.13% Basic Materials 2.8% Consumer Defensive 1.98% Utility 1.27% Health Care 0.52% Asset Allocation
Asset Class Value Cash 6.04% Equity 93.14% Debt 0.01% Other 0.49% Top Securities Holdings / Portfolio
Name Holding Value Quantity JPM Emerging Mkts Opps I acc USD
Investment Fund | -96% ₹241 Cr 102,137
↑ 3,897 Clearing Corporation Of India Ltd.
CBLO/Reverse Repo | -4% ₹10 Cr Net Receivables/(Payables)
CBLO | -0% -₹1 Cr Accrued Interest
CBLO | -0% ₹0 Cr 4. Kotak Global Emerging Market Fund
Kotak Global Emerging Market Fund
Growth Launch Date 26 Sep 07 NAV (09 Jul 26) ₹39.397 ↑ 0.33 (0.85 %) Net Assets (Cr) ₹1,793 on 31 May 26 Category Equity - Global AMC Kotak Mahindra Asset Management Co Ltd Rating ☆☆☆ Risk High Expense Ratio 1.64 Sharpe Ratio 2.29 Information Ratio -0.25 Alpha Ratio -1.76 Min Investment 5,000 Min SIP Investment 1,000 Exit Load 0-1 Years (1%),1 Years and above(NIL) Growth of 10,000 investment over the years.
Date Value 30 Jun 21 ₹10,000 30 Jun 22 ₹7,904 30 Jun 23 ₹8,130 30 Jun 24 ₹9,267 30 Jun 25 ₹10,468 30 Jun 26 ₹16,878 Returns for Kotak Global Emerging Market Fund
absolute basis & more than 1 year are on CAGR (Compound Annual Growth Rate) basis. as on 9 Jul 26 Duration Returns 1 Month -2.7% 3 Month 13.9% 6 Month 23.3% 1 Year 54% 3 Year 26% 5 Year 11% 10 Year 15 Year Since launch 7.6% Historical performance (Yearly) on absolute basis
Year Returns 2025 39.1% 2024 5.9% 2023 10.8% 2022 -15% 2021 -0.5% 2020 29.1% 2019 21.4% 2018 -14.4% 2017 30.4% 2016 -1.2% Fund Manager information for Kotak Global Emerging Market Fund
Name Since Tenure Arjun Khanna 9 May 19 7.15 Yr. Data below for Kotak Global Emerging Market Fund as on 31 May 26
Equity Sector Allocation
Sector Value Technology 43.42% Financial Services 19.61% Industrials 8.58% Consumer Cyclical 8.12% Basic Materials 6.67% Communication Services 5.05% Energy 4.51% Health Care 0.71% Asset Allocation
Asset Class Value Cash 3.32% Equity 96.68% Top Securities Holdings / Portfolio
Name Holding Value Quantity CI Emerging Markets Class A
Investment Fund | -98% ₹1,762 Cr 4,589,366
↑ 100,988 Triparty Repo
CBLO/Reverse Repo | -2% ₹33 Cr Net Current Assets/(Liabilities)
Net Current Assets | -0% -₹2 Cr 5. DSP World Energy Fund
DSP World Energy Fund
Growth Launch Date 14 Aug 09 NAV (09 Jul 26) ₹29.3381 ↑ 0.33 (1.12 %) Net Assets (Cr) ₹122 on 31 May 26 Category Equity - Global AMC DSP BlackRock Invmt Managers Pvt. Ltd. Rating ☆☆ Risk High Expense Ratio 1.18 Sharpe Ratio 4 Information Ratio 0 Alpha Ratio 0 Min Investment 1,000 Min SIP Investment 500 Exit Load 0-12 Months (1%),12 Months and above(NIL) Growth of 10,000 investment over the years.
Date Value 30 Jun 21 ₹10,000 30 Jun 22 ₹8,249 30 Jun 23 ₹10,979 30 Jun 24 ₹10,687 30 Jun 25 ₹11,189 30 Jun 26 ₹18,095 Returns for DSP World Energy Fund
absolute basis & more than 1 year are on CAGR (Compound Annual Growth Rate) basis. as on 9 Jul 26 Duration Returns 1 Month -3.9% 3 Month 5.6% 6 Month 20.6% 1 Year 50.4% 3 Year 17.9% 5 Year 12.3% 10 Year 15 Year Since launch 6.6% Historical performance (Yearly) on absolute basis
Year Returns 2025 39.2% 2024 -6.8% 2023 12.9% 2022 -8.6% 2021 29.5% 2020 0% 2019 18.2% 2018 -11.3% 2017 -1.9% 2016 22.5% Fund Manager information for DSP World Energy Fund
Name Since Tenure Kaivalya Nadkarni 1 May 25 1.17 Yr. Data below for DSP World Energy Fund as on 31 May 26
Equity Sector Allocation
Sector Value Industrials 36.73% Utility 22.76% Technology 22.09% Basic Materials 9.94% Consumer Cyclical 0.71% Asset Allocation
Asset Class Value Cash 7.75% Equity 92.23% Debt 0.02% Top Securities Holdings / Portfolio
Name Holding Value Quantity BGF Sustainable Energy I2
Investment Fund | -97% ₹118 Cr 404,670 Treps / Reverse Repo Investments
CBLO/Reverse Repo | -3% ₹4 Cr Net Receivables/Payables
Net Current Assets | -0% ₹0 Cr 6. DSP US Flexible Equity Fund
DSP US Flexible Equity Fund
Growth Launch Date 3 Aug 12 NAV (09 Jul 26) ₹93.7161 ↑ 1.39 (1.50 %) Net Assets (Cr) ₹1,323 on 31 May 26 Category Equity - Global AMC DSP BlackRock Invmt Managers Pvt. Ltd. Rating ☆☆☆☆☆ Risk High Expense Ratio 1.55 Sharpe Ratio 2.57 Information Ratio 0.13 Alpha Ratio -3.23 Min Investment 1,000 Min SIP Investment 500 Exit Load 0-12 Months (1%),12 Months and above(NIL) Growth of 10,000 investment over the years.
Date Value 30 Jun 21 ₹10,000 30 Jun 22 ₹9,273 30 Jun 23 ₹11,265 30 Jun 24 ₹13,557 30 Jun 25 ₹15,785 30 Jun 26 ₹23,371 Returns for DSP US Flexible Equity Fund
absolute basis & more than 1 year are on CAGR (Compound Annual Growth Rate) basis. as on 9 Jul 26 Duration Returns 1 Month 0.4% 3 Month 15.8% 6 Month 19.8% 1 Year 47.3% 3 Year 27.4% 5 Year 18.2% 10 Year 15 Year Since launch 17.4% Historical performance (Yearly) on absolute basis
Year Returns 2025 33.8% 2024 17.8% 2023 22% 2022 -5.9% 2021 24.2% 2020 22.6% 2019 27.5% 2018 -1.1% 2017 15.5% 2016 9.8% Fund Manager information for DSP US Flexible Equity Fund
Name Since Tenure Kaivalya Nadkarni 1 May 25 1.17 Yr. Data below for DSP US Flexible Equity Fund as on 31 May 26
Equity Sector Allocation
Sector Value Technology 33.05% Industrials 13.62% Financial Services 12.17% Communication Services 12.05% Consumer Cyclical 9.62% Health Care 7.65% Basic Materials 2.45% Energy 2.43% Asset Allocation
Asset Class Value Cash 6.96% Equity 93.02% Debt 0.01% Top Securities Holdings / Portfolio
Name Holding Value Quantity BGF US Flexible Equity I2
Investment Fund | -96% ₹1,265 Cr 1,784,131
↓ -32,921 Treps / Reverse Repo Investments
CBLO/Reverse Repo | -4% ₹59 Cr Net Receivables/Payables
Net Current Assets | -0% -₹2 Cr 7. Franklin Asian Equity Fund
Franklin Asian Equity Fund
Growth Launch Date 16 Jan 08 NAV (10 Jul 26) ₹44.9329 ↑ 0.28 (0.62 %) Net Assets (Cr) ₹870 on 31 May 26 Category Equity - Global AMC Franklin Templeton Asst Mgmt(IND)Pvt Ltd Rating ☆☆☆☆☆ Risk High Expense Ratio 2.54 Sharpe Ratio 1.73 Information Ratio 0 Alpha Ratio 0 Min Investment 5,000 Min SIP Investment 500 Exit Load 0-3 Years (1%),3 Years and above(NIL) Growth of 10,000 investment over the years.
Date Value 30 Jun 21 ₹10,000 30 Jun 22 ₹7,878 30 Jun 23 ₹7,912 30 Jun 24 ₹8,612 30 Jun 25 ₹9,560 30 Jun 26 ₹14,112 Returns for Franklin Asian Equity Fund
absolute basis & more than 1 year are on CAGR (Compound Annual Growth Rate) basis. as on 9 Jul 26 Duration Returns 1 Month 3.6% 3 Month 17.2% 6 Month 22.3% 1 Year 46.3% 3 Year 21.1% 5 Year 7.6% 10 Year 15 Year Since launch 8.5% Historical performance (Yearly) on absolute basis
Year Returns 2025 23.7% 2024 14.4% 2023 0.7% 2022 -14.5% 2021 -5.9% 2020 25.8% 2019 28.2% 2018 -13.6% 2017 35.5% 2016 7.2% Fund Manager information for Franklin Asian Equity Fund
Name Since Tenure Sandeep Manam 18 Oct 21 4.7 Yr. Shyam Sriram 26 Sep 24 1.76 Yr. Data below for Franklin Asian Equity Fund as on 31 May 26
Equity Sector Allocation
Sector Value Technology 32.45% Consumer Cyclical 15.53% Financial Services 11.03% Industrials 10.11% Health Care 5.7% Real Estate 4.83% Energy 3.46% Basic Materials 3.42% Communication Services 2.83% Utility 2.24% Consumer Defensive 1.74% Asset Allocation
Asset Class Value Cash 6.65% Equity 93.35% Top Securities Holdings / Portfolio
Name Holding Value Quantity Taiwan Semiconductor Manufacturing Co Ltd (Technology)
Equity, Since 31 Mar 09 | 23309% ₹81 Cr 114,000
↑ 41,000 Samsung Electronics Co Ltd (Technology)
Equity, Since 31 Mar 08 | 0059307% ₹62 Cr 30,867
↑ 8,934 SK Hynix Inc (Technology)
Equity, Since 30 Jun 20 | 0006605% ₹47 Cr 3,222
↑ 655 MediaTek Inc (Technology)
Equity, Since 31 Aug 20 | 24543% ₹25 Cr 19,000 ICICI Bank Ltd (Financial Services)
Equity, Since 31 Dec 25 | ICICIBANK3% ₹24 Cr 191,115
↑ 43,880 Yageo Corp (Technology)
Equity, Since 30 Jun 25 | 23272% ₹19 Cr 86,000 Tencent Holdings Ltd (Communication Services)
Equity, Since 31 Jul 14 | NNND2% ₹18 Cr 34,400
↑ 5,200 HDFC Bank Ltd (Financial Services)
Equity, Since 31 Dec 25 | HDFCBANK2% ₹17 Cr 224,505
↑ 71,852 Larsen & Toubro Ltd (Industrials)
Equity, Since 31 Mar 24 | LT2% ₹16 Cr 39,999
↑ 5,662 Eternal Ltd (Consumer Cyclical)
Equity, Since 31 Jul 21 | ETERNAL2% ₹16 Cr 639,163
↑ 237,879 8. Nippon India Japan Equity Fund
Nippon India Japan Equity Fund
Growth Launch Date 26 Aug 14 NAV (10 Jul 26) ₹27.5127 ↑ 0.19 (0.69 %) Net Assets (Cr) ₹348 on 31 May 26 Category Equity - Global AMC Nippon Life Asset Management Ltd. Rating ☆☆☆☆ Risk High Expense Ratio 2.45 Sharpe Ratio 1.59 Information Ratio -1.05 Alpha Ratio -4.04 Min Investment 5,000 Min SIP Investment 100 Exit Load 0-1 Years (1%),1 Years and above(NIL) Growth of 10,000 investment over the years.
Date Value 30 Jun 21 ₹10,000 30 Jun 22 ₹8,067 30 Jun 23 ₹9,515 30 Jun 24 ₹10,476 30 Jun 25 ₹12,157 30 Jun 26 ₹15,868 Returns for Nippon India Japan Equity Fund
absolute basis & more than 1 year are on CAGR (Compound Annual Growth Rate) basis. as on 9 Jul 26 Duration Returns 1 Month 2.9% 3 Month 10.4% 6 Month 19.5% 1 Year 38.3% 3 Year 19.7% 5 Year 10.4% 10 Year 15 Year Since launch 10.4% Historical performance (Yearly) on absolute basis
Year Returns 2025 19.8% 2024 9.3% 2023 18.7% 2022 -15.3% 2021 5.7% 2020 2019 2018 2017 2016 Fund Manager information for Nippon India Japan Equity Fund
Name Since Tenure Kinjal Desai 25 May 18 8.1 Yr. Amber Singhania 11 Mar 26 0.3 Yr. Data below for Nippon India Japan Equity Fund as on 31 May 26
Equity Sector Allocation
Sector Value Industrials 21.36% Technology 17.79% Consumer Cyclical 14.59% Financial Services 12.68% Communication Services 6.9% Consumer Defensive 5.67% Real Estate 4.38% Basic Materials 3.29% Health Care 3.08% Asset Allocation
Asset Class Value Cash 10.26% Equity 89.74% Top Securities Holdings / Portfolio
Name Holding Value Quantity TDK Corp (Technology)
Equity, Since 30 Jun 22 | TDK5% ₹18 Cr 73,600 Recruit Holdings Co Ltd (Communication Services)
Equity, Since 30 Jun 23 | 1RH4% ₹15 Cr 23,600 Tokyo Electron Ltd (Technology)
Equity, Since 31 Jul 18 | 80354% ₹13 Cr 4,000 Keyence Corp (Technology)
Equity, Since 30 Jun 23 | KEE4% ₹12 Cr 2,600 Sumitomo Electric Industries Ltd (Consumer Cyclical)
Equity, Since 30 Jun 24 | SMO4% ₹12 Cr 16,300 ORIX Corp (Financial Services)
Equity, Since 30 Jun 24 | 85913% ₹12 Cr 32,200 Fast Retailing Co Ltd (Consumer Cyclical)
Equity, Since 31 Jul 15 | 99833% ₹12 Cr 2,400 BayCurrent Inc (Industrials)
Equity, Since 30 Jun 22 | 65323% ₹12 Cr 34,800 Shin-Etsu Chemical Co Ltd (Basic Materials)
Equity, Since 30 Jun 17 | 40633% ₹11 Cr 24,600 Tokio Marine Holdings Inc (Financial Services)
Equity, Since 30 Jun 22 | 87663% ₹11 Cr 26,000
आंतरराष्ट्रीय म्युच्युअल फंडाचे प्रकार
1. इमर्जिंग मार्केट फंड
या प्रकारचा म्युच्युअल फंड भारत, चीन, रशिया, ब्राझील इत्यादी उदयोन्मुख बाजारपेठांमध्ये गुंतवणूक करतो. चीन यूएसएला मागे टाकून जगातील सर्वात मोठा कार उत्पादक बनला आहे. नैसर्गिक वायूमध्ये रशिया हा मोठा खेळाडू आहे. भारतामध्ये वेगाने वाढणारी सेवा अर्थव्यवस्था आधार आहे. येत्या काही वर्षांत या देशांची प्रचंड वाढ होण्याची अपेक्षा आहे ज्यामुळे ते गुंतवणूकदारांसाठी एक लोकप्रिय पर्याय बनतील.
बिर्ला सन लाइफ इंटरनॅशनल इक्विटी प्लॅन ए, कोटक ग्लोबल इमर्जिंग मार्केट फंड आणि प्रिन्सिपल ग्लोबल अपॉर्च्युनिटीज फंड या उदयोन्मुख बाजारपेठांमध्ये गुंतवणूक करणाऱ्या काही सर्वोत्तम आंतरराष्ट्रीय म्युच्युअल फंड योजना आहेत.
Talk to our investment specialist
2. विकसित बाजार निधी
विकसित मार्केट फंड हा एक आकर्षक पर्याय आहे कारण सर्वसाधारणपणे परिपक्व बाजार अधिक स्थिर असतात. तसेच, त्यांच्याकडे अर्थव्यवस्था किंवा अर्थव्यवस्थेतील चलन जोखीम, राजकीय अस्थिरता इत्यादीसारख्या उदयोन्मुख बाजारपेठांशी संबंधित समस्या नाहीत ज्यामुळे त्यांना कमी धोका निर्माण होतो. विकसित बाजारपेठांमध्ये गुंतवणूक करणाऱ्या काही योजना DWS ग्लोबल थीमॅटिक आहेतसुमारे निधी इ.
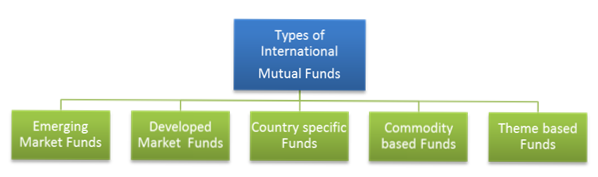
3. देश विशिष्ट निधी
नावाप्रमाणेच, हा प्रकार केवळ विशिष्ट देशात किंवा जगाच्या भागामध्ये गुंतवणूक करतो. परंतु, देश-विशिष्ट फंड पोर्टफोलिओमध्ये विविधता आणण्याच्या संपूर्ण उद्देशाला अपयशी ठरतात कारण ते सर्व अंडी एकाच टोपलीत घालतात. तथापि, जेव्हा विविध कारणांमुळे विशिष्ट देशांमध्ये संधी उपलब्ध होतात, तेव्हा हे फंड एक चांगला पर्याय बनतात.
रिलायन्स जपानइक्विटी फंड, कोटक यूएस इक्विटीज फंड आणिमिरे मालमत्ता चायना अॅडव्हांटेज फंड काही देश-विशिष्ट योजना आहेत.
4. कमोडिटी बेस्ड फंड
हे फंड सोने, मौल्यवान धातू, कच्चे तेल, गहू इत्यादी वस्तूंमध्ये गुंतवणूक करतात.महागाई हेज, अशा प्रकारे गुंतवणूकदारांचे संरक्षण करते. तसेच, हे फंड बहु-कमोडिटी असू शकतात किंवा एकाच कमोडिटीवर केंद्रित असू शकतात.
सर्वोत्तम कमोडिटी आधारित आंतरराष्ट्रीय म्युच्युअल फंड म्हणजे डीएसपी ब्लॅक रॉक वर्ल्ड गोल्ड फंड, आयएनजी ऑप्टिमिक्स ग्लोबल कमोडिटीज, मिरे अॅसेट ग्लोबल कमोडिटी स्टॉक्स, बिर्ला सन लाइफ कमोडिटी इक्विटीज - ग्लोबल अॅग्री फंड इ.
5. थीम आधारित निधी
थीम आधारित फंड किंवा थीमॅटिक फंड एखाद्या विशिष्ट थीममध्ये गुंतवणूक करतात. उदाहरणार्थ, जर थीम पायाभूत सुविधा असेल, तर ती पायाभूत सुविधा बांधकाम कंपन्यांमध्ये तसेच सिमेंट, स्टील इ. सारख्या पायाभूत सुविधा व्यवसायाशी संबंधित कंपन्यांमध्ये गुंतवणूक करेल.
ते बर्याचदा क्षेत्रीय निधीमध्ये गोंधळलेले असतात जे केवळ विशिष्ट उद्योगावर केंद्रित असतात. उदाहरणार्थ, फार्मास्युटिकल सेक्टोरल फंड फक्त फार्मा कंपन्यांमध्ये गुंतवणूक करतात. च्या तुलनेतक्षेत्र निधी, थीमॅटिक फंड ही एक व्यापक संकल्पना आहे. हे अधिक वैविध्य आणि कमी जोखीम देते कारण गुंतवणूक विविध उद्योगांमध्ये पसरलेली आहे.
काही थीम आधारित फंड म्हणजे DSPBR वर्ल्ड एनर्जी फंड, L&T ग्लोबल रिअल अॅसेट्स फंड इ.
आंतरराष्ट्रीय म्युच्युअल फंडात गुंतवणूक का करावी?
1. विविधीकरण
चा मुख्य हेतूगुंतवणूक आंतरराष्ट्रीय म्युच्युअल फंडामध्ये विविधता आहे. वैविध्यपूर्ण रिटर्न्स ऑप्टिमाइझ करण्यात आणि पोर्टफोलिओची एकूण जोखीम कमी करण्यात मदत करते. गुंतवणुकीमधील कमी किंवा नकारात्मक सहसंबंध हे सुनिश्चित करतात की परतावा केवळ एका क्षेत्रावर किंवा अर्थव्यवस्थेवर अवलंबून नाही. अशा प्रकारे, पोर्टफोलिओ संतुलित करणे आणि गुंतवणूकदाराचे संरक्षण करणे.
2. गुंतवणुकीत सुलभता
तुम्ही इक्विटी, कमोडिटीज, रिअल इस्टेट आणि एक्सचेंज ट्रेडेड फंड (ईटीएफ) सुद्धा. आंतरराष्ट्रीय म्युच्युअल फंडाची युनिट्स खरेदी करणे खूप सोपे आहे आणि ते फंड व्यवस्थापकाचे कौशल्य देखील प्रदान करतात जे इतर गुंतवणूकीच्या मार्गांमध्ये उपलब्ध नाही.
3. आंतरराष्ट्रीय प्रदर्शन
आंतरराष्ट्रीय म्युच्युअल फंड देशांतर्गत सीमांच्या पलीकडे गुंतवणूकदारांचे क्षितिज विस्तारण्यास मदत करतात. तसेच, आंतरराष्ट्रीय गुंतवणुकीमुळे देशांतर्गत बाजारात गुंतवणूकदाराचे होणारे नुकसान भरून काढण्यास मदत होते.
4. चलन चढउतार
आंतरराष्ट्रीय म्युच्युअल फंड योजना ठरवतातनाही (निव्वळ मालमत्ता मूल्य) प्रचलित विनिमय दर वापरून. विनिमय दर दररोज, किंवा त्याहूनही अधिक, प्रत्येक मिनिटाला चढ-उतार होतात.
याचा अर्थ यूएस डॉलर्समध्ये गुंतवणूक करणाऱ्या योजनेसाठी, डॉलर-रुपयाच्या हालचालीनुसार योजनेच्या NAV वर परिणाम होईल. रुपया जितका घसरतो तितका नफा जास्त असतो, असे निरीक्षण आहे. हे आंतरराष्ट्रीय म्युच्युअल फंड अधिक आकर्षक बनवते कारण रुपया आता खाली जात आहे.
5. देश विशिष्ट एक्सपोजर
जर गुंतवणूकदाराला दुसऱ्या देशाच्या वाढीचा संपूर्ण फायदा घ्यायचा असेल, तर आंतरराष्ट्रीय म्युच्युअल फंड हे जाण्याचा मार्ग आहे. पणफ्लिप पोर्टफोलिओ ही केवळ एका अर्थव्यवस्थेवर अवलंबून आहे. त्यामुळे धोका वाढतोघटक.
आंतरराष्ट्रीय म्युच्युअल फंडांची कर आकारणी
भारतातील आंतरराष्ट्रीय म्युच्युअल फंडांची कर उपचार पद्धती सारखीच आहेकर्ज निधी. जर गुंतवणुकदाराने अल्प मुदतीची म्हणजेच पेक्षा कमी गुंतवणूक केली असेल36 महिने, ते त्याच्या एकूण मध्ये समाविष्ट केले जातीलउत्पन्न आणि लागू स्लॅब दरानुसार कर आकारला जाईल.
जर गुंतवणूक 36 महिन्यांपेक्षा जास्त काळ ठेवली असेल, तर गुंतवणूकदार इंडेक्सेशन लाभांसाठी पात्र आहे. योजनांमधून होणारा कोणताही फायदा कर आकारला जाईल@ 10% इंडेक्सेशनशिवाय किंवा20% अनुक्रमणिका सह.
इंटरनॅशनल म्युच्युअल फंडात ऑनलाइन गुंतवणूक कशी करावी?
Fincash.com वर आजीवन मोफत गुंतवणूक खाते उघडा.
तुमची नोंदणी आणि KYC प्रक्रिया पूर्ण करा
दस्तऐवज अपलोड करा (PAN, आधार इ.).आणि, तुम्ही गुंतवणूक करण्यास तयार आहात!
तज्ञांच्या मते, गुंतवणूकदाराने पोर्टफोलिओपैकी सुमारे 10-12% गुंतवणूक आंतरराष्ट्रीय म्युच्युअल फंडांमध्ये केली पाहिजे. त्यामुळे आत्ताच मूलभूत गोष्टींचा अंतर्भाव करून, आजच आंतरराष्ट्रीय म्युच्युअल फंडांसह तो पोर्टफोलिओ तयार करण्यास सुरुवात करा.
वारंवार विचारले जाणारे प्रश्न
1. आंतरराष्ट्रीय म्युच्युअल फंडामध्ये गुंतवणूक करण्याचे काय फायदे आहेत?
अ: हे तुमच्या गुंतवणुकीच्या पोर्टफोलिओमध्ये वैविध्य आणते, ज्यामुळे तुम्हाला अधिक चांगले आणि वैविध्यपूर्ण परतावा मिळतो. यामुळे तुमचा पोर्टफोलिओही संतुलित राहतो. या कंपन्यांकडे परदेशी निधी असल्याने, तुम्ही तुमच्या गुंतवणुकीवर चांगला परतावा मिळण्याची अपेक्षा करू शकता.
2. भारतापेक्षा कमी वाढ करणाऱ्या कंपन्यांमध्ये मी गुंतवणूक करू शकतो का?
अ: होय, तुम्ही करू शकता, परंतु ते तुम्ही ज्या वित्तीय संस्थेमध्ये गुंतवणूक करत आहात त्यावर अवलंबून असेल. तुम्ही परदेशी कंपनीच्या रोख्यांमध्ये थेट गुंतवणूक करू शकत नाही. विशिष्ट सुरक्षिततेमध्ये गुंतवणूक करण्यात मदत करण्यासाठी तुम्हाला ब्रोकर किंवा वित्तीय संस्थेची आवश्यकता असेल.
3. फ्रँकलिन इंडिया फीडर काय आहे?
अ: फ्रँकलिन इंडिया फीडर किंवा फ्रँकलिन यूएस अपॉर्च्युनिटीज फंड हा सर्वात यशस्वी आंतरराष्ट्रीय म्युच्युअल फंडांपैकी एक आहे. हा फंड तुम्हाला युनायटेड स्टेट्समधील तंत्रज्ञान, आरोग्यसेवा, ग्राहक चक्रीय, वित्तीय सेवा आणि अशा अनेक औद्योगिक क्षेत्रांमध्ये गुंतलेल्या कंपन्यांच्या एकाधिक सिक्युरिटीजमध्ये गुंतवणूक करण्याची परवानगी देतो. हे म्युच्युअल फंड तुम्हाला तुमच्या गुंतवणुकीच्या पोर्टफोलिओमध्ये विविधता आणण्याची परवानगी देतात, ज्यामुळे एकाच गुंतवणुकीद्वारे एकाधिक सिक्युरिटीजमध्ये गुंतवणूक करणे सोपे होते. लॉन्च झाल्यापासून, फ्रँकलिन इंडिया फीडरने परतावा दिला आहे19.9%.
4. ब्लॅकरॉक वर्ल्ड मायनिंग फंड म्हणजे काय?
अ: हे फ्रँकलिनपेक्षा वेगळे आहे कारण त्यात फक्त आवश्यक साहित्य आणि आर्थिक सेवांमध्ये इक्विटी क्षेत्र आहे. हा उच्च-जोखीम असलेला म्युच्युअल फंड मानला जातो, परंतु उत्कृष्ट परतावा देण्यासाठी ओळखला जातो. दडीएसपी ब्लॅकरॉक जागतिक खाणकामाने जवळपास परतावा दिला आहे34.9% 3 वर्षांच्या गुंतवणूक कालावधीसाठी.
5. आंतरराष्ट्रीय म्युच्युअल फंडांच्या कमाईवर कर आकारला जातो का?
अ: होय,कमाई आंतरराष्ट्रीय म्युच्युअल फंडांवर कर आकारला जातो. या निधीतून तुम्ही कमावलेला लाभांश स्रोतावर कर कपात किंवा येथे TDS साठी जबाबदार आहे७.५% 31 मार्च 2021 पर्यंत, आणि म्युच्युअल फंड हाऊस ते कापतात. जर तुम्ही 3 वर्षांसाठी गुंतवणूक केली असेल, तर ती अल्प-मुदतीच्या गुंतवणुकीत येईल, आणि जर जास्त असेल, तर तुम्हाला ती दीर्घकालीन गुंतवणुकीत वर्गीकृत करावी लागेल. कर आकारणी स्लॅब देखील गुंतवणूक कोणत्या वेळेसाठी केली आहे यावर अवलंबून असेल.
6. आंतरराष्ट्रीय म्युच्युअल फंडाचा मुख्य धोका काय आहे?
अ: आंतरराष्ट्रीय म्युच्युअल फंडाची प्राथमिक जोखीम म्हणजे परकीय चलन दराचे चढउतार. रुपयाच्या तुलनेत परकीय चलन दरात चढ-उतार झाल्यास त्याचा तुमच्या गुंतवणुकीवर विपरीत परिणाम होऊ शकतो.
7. परदेशी म्युच्युअल फंडात कोणी गुंतवणूक करावी?
अ: तुम्ही तुमच्या गुंतवणुकीच्या पोर्टफोलिओमध्ये विविधता आणू इच्छित असाल आणि भौगोलिक वैविध्य जोडू इच्छित असाल, तर तुम्ही परदेशी म्युच्युअल फंडात गुंतवणूक करण्याचा विचार करू शकता.
येथे प्रदान केलेली माहिती अचूक असल्याची खात्री करण्यासाठी सर्व प्रयत्न केले गेले आहेत. तथापि, डेटाच्या अचूकतेबद्दल कोणतीही हमी दिली जात नाही. कृपया कोणतीही गुंतवणूक करण्यापूर्वी योजना माहिती दस्तऐवजासह सत्यापित करा.


AMFI Registration No. 112358 | CIN: U74999MH2016PTC282153
Shepard Technologies Pvt. Ltd. (with ARN code 112358) makes no warranties or representations, express or implied, on products offered through the platform. It accepts no liability for any damages or losses, however caused, in connection with the use of, or on the reliance of its product or related services. Terms and conditions of the website are applicable.
©2026 Shepard Technologies Private Limited. All Rights Reserved
Very good article I got all the required information.