SIPs ਬਨਾਮ ਇਕਮੁਸ਼ਤ ਰਕਮ
SIPs ਬਨਾਮ ਇਕਮੁਸ਼ਤ ਰਕਮਨਿਵੇਸ਼? ਇੱਥੇ ਕਈ ਲੇਖ ਹਨ ਜੋ ਕਹਿੰਦੇ ਹਨ ਕਿ ਯੋਜਨਾਬੱਧ ਨਿਵੇਸ਼ ਯੋਜਨਾਵਾਂ (ਜਾਂ SIPs) ਲਈ ਲਏ ਜਾਣ ਦਾ ਸਭ ਤੋਂ ਵਧੀਆ ਰਸਤਾ ਹੈਮਿਉਚੁਅਲ ਫੰਡਾਂ ਵਿੱਚ ਨਿਵੇਸ਼ ਕਰਨਾ. ਵੱਖ - ਵੱਖSIP ਕੈਲਕੁਲੇਟਰ ਉਸ ਟੀਚੇ ਲਈ ਯੋਜਨਾ ਬਣਾਉਣ ਵਿੱਚ ਤੁਹਾਡੀ ਮਦਦ ਕਰਦੇ ਹਨ, ਬਹੁਤ ਸਾਰੀਆਂ ਵੈਬਸਾਈਟਾਂ, ਅਤੇ ਵਿੱਤੀ ਯੋਜਨਾਕਾਰ ਵੀ ਇਸਦੀ ਵਕਾਲਤ ਕਰਨਗੇਸਿਖਰ SIP ਨਿਵੇਸ਼ ਕਰਨ ਦੀ ਯੋਜਨਾ ਹੈ। ਜ਼ਿਆਦਾਤਰ ਰੁਪਏ ਦੀ ਲਾਗਤ ਔਸਤ ਅਤੇ SIP ਦੇ ਲਾਭਾਂ ਬਾਰੇ ਗੱਲ ਕਰਨਗੇ, ਇਹ ਦੱਸਦੇ ਹੋਏ ਕਿ ਸਟਾਕ ਵਿੱਚ ਆਉਣਾਬਜ਼ਾਰ ਇੱਕਮੁਸ਼ਤ ਨਿਵੇਸ਼ ਦੁਆਰਾ ਸਭ ਤੋਂ ਵਧੀਆ ਤਰੀਕਾ ਨਹੀਂ ਹੋ ਸਕਦਾ। ਜਦੋਂ ਕਿ ਕੋਈ ਐਸਆਈਪੀ ਲਈ ਸਭ ਤੋਂ ਵਧੀਆ ਮਿਉਚੁਅਲ ਫੰਡ ਵਿੱਚ ਦਾਖਲ ਹੋ ਸਕਦਾ ਹੈ, ਕੀ ਕੋਈ ਨਿਵੇਸ਼ ਮੋਡ ਵਜੋਂ ਐਸਆਈਪੀ ਦੀ ਵਰਤੋਂ ਕਰਕੇ ਇੱਕਮੁਸ਼ਤ ਨਿਵੇਸ਼ ਨਾਲੋਂ ਬਿਹਤਰ ਰਿਟਰਨ ਦੀ ਉਮੀਦ ਕਰ ਸਕਦਾ ਹੈ?
SIP ਜਾਂ ਇਕਮੁਸ਼ਤ ਰਕਮ: ਸਮੇਂ ਲਈ ਨਿਵੇਸ਼ ਕਰੋ ਨਾ ਕਿ ਸਮੇਂ ਲਈ
ਨਿਵੇਸ਼ ਹਮੇਸ਼ਾ ਰਿਟਰਨ ਪੈਦਾ ਕਰਨ ਦੀ ਯੋਗਤਾ ਬਾਰੇ ਹੁੰਦਾ ਹੈ। ਭਾਵੇਂ ਇਹ ਇਕਮੁਸ਼ਤ ਨਿਵੇਸ਼ ਹੋਵੇ ਜਾਂ ਯੋਜਨਾਬੱਧਨਿਵੇਸ਼ ਯੋਜਨਾ, ਕਿਸੇ ਨੂੰ ਸਮਝਦਾਰੀ ਅਤੇ ਸਹੀ ਫੈਸਲੇ ਲੈਣ ਦੀ ਲੋੜ ਹੈ। ਵਿੱਚ ਨਿਵੇਸ਼ ਕਰ ਰਿਹਾ ਹੈਮਿਉਚੁਅਲ ਫੰਡ ਦੀ ਚੋਣ ਕਰਨ ਬਾਰੇ ਹਮੇਸ਼ਾ ਨਹੀਂ ਹੁੰਦਾਵਧੀਆ ਮਿਉਚੁਅਲ ਫੰਡ ਜਾਂਵਧੀਆ SIP ਯੋਜਨਾਵਾਂ. ਹੋਰ ਵੀ ਬਹੁਤ ਕੁਝ ਹੈ ਜਿਸ 'ਤੇ ਵਿਚਾਰ ਕਰਨ ਦੀ ਲੋੜ ਹੈ। ਖਾਸ ਤੌਰ 'ਤੇ, ਜੇਕਰ ਕੋਈ ਸ਼ੇਅਰ ਬਾਜ਼ਾਰਾਂ ਵਿੱਚ ਨਿਵੇਸ਼ ਕਰਨ ਬਾਰੇ ਸੋਚ ਰਿਹਾ ਹੈ, ਤਾਂ ਕਿਸੇ ਨੂੰ ਹੋਰ ਵੀ ਸਾਵਧਾਨ ਰਹਿਣ ਦੀ ਲੋੜ ਹੈ। ਸਟਾਕ ਮਾਰਕੀਟ ਦਾ ਵਿਸ਼ਲੇਸ਼ਣ (ਬੀ.ਐਸ.ਈ. ਸੈਂਸੈਕਸ ਨੂੰ ਬੈਂਚਮਾਰਕ ਵਜੋਂ ਲੈਣਾ) ਇਹ ਸਿੱਧ ਕਰਦਾ ਹੈ ਕਿ ਜੇਕਰ ਕੋਈ ਲੰਬੇ ਸਮੇਂ ਲਈ ਨਿਵੇਸ਼ ਕਰਦਾ ਹੈ ਤਾਂ ਰਿਟਰਨ ਕਮਾਉਣ ਦੀ ਸੰਭਾਵਨਾ ਵੱਧ ਜਾਂਦੀ ਹੈ। ਜਿਵੇਂ ਕਿ ਹੇਠਾਂ ਦਿੱਤੀ ਸਾਰਣੀ ਤੋਂ ਕੋਈ ਦੇਖ ਸਕਦਾ ਹੈ, ਜੇਕਰ ਕੋਈ ਸਿਰਫ਼ ਸੰਖਿਆਵਾਂ ਦੁਆਰਾ ਜਾਂਦਾ ਹੈ, ਤਾਂ 30% ਸੰਭਾਵਨਾ ਹੈ ਕਿ ਤੁਹਾਨੂੰ ਨੁਕਸਾਨ ਹੋ ਸਕਦਾ ਹੈ ਜੇਕਰ ਤੁਸੀਂ ਸਿਰਫ 1 ਸਾਲ ਲਈ ਸਟਾਕ ਮਾਰਕੀਟ ਵਿੱਚ ਨਿਵੇਸ਼ ਕਰਨ ਦੀ ਯੋਜਨਾ ਬਣਾਉਂਦੇ ਹੋ।
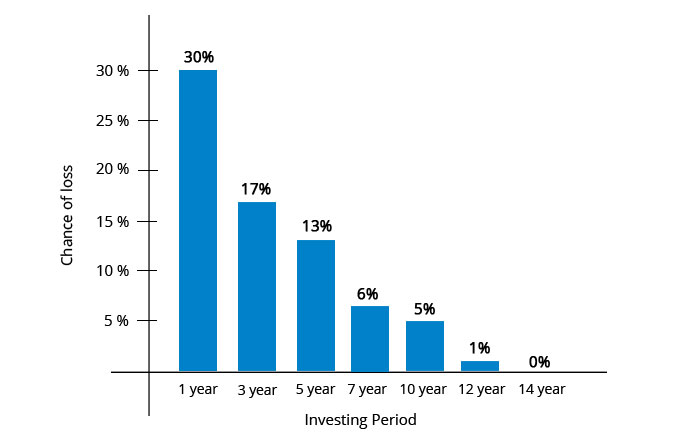
ਇਸਲਈ ਜ਼ਿਆਦਾਤਰ ਸਲਾਹਕਾਰ ਜਦੋਂ ਇਕੁਇਟੀ ਨਿਵੇਸ਼ਾਂ ਬਾਰੇ ਗੱਲ ਕਰਦੇ ਹਨ ਤਾਂ ਹਮੇਸ਼ਾ ਇਸ ਨਾਲ ਸਬੰਧਤ ਹੁੰਦੇ ਹਨਇਕੁਇਟੀ "ਲੰਮੀ ਮਿਆਦ ਦੇ ਨਿਵੇਸ਼" ਦੇ ਨਾਲ. ਜੇਕਰ ਕੋਈ 5 ਸਾਲਾਂ ਲਈ ਨਿਵੇਸ਼ ਕਰਨ ਦੀ ਯੋਜਨਾ ਬਣਾਉਂਦਾ ਹੈ ਤਾਂ ਘਾਟੇ ਦੀ ਸੰਭਾਵਨਾ 13% ਤੱਕ ਘੱਟ ਜਾਂਦੀ ਹੈ। ਅਤੇ ਜੇਕਰ ਕੋਈ ਸੱਚਮੁੱਚ ਲੰਬੀ ਮਿਆਦ (10 ਸਾਲਾਂ ਤੋਂ ਵੱਧ) ਹੈ, ਤਾਂ ਨੁਕਸਾਨ ਕਰਨ ਦੀ ਸਮਰੱਥਾ ਜ਼ੀਰੋ ਵੱਲ ਜਾਂਦੀ ਹੈ। ਇਸ ਲਈ, ਜੇ ਕੋਈ ਸਟਾਕ ਮਾਰਕੀਟ ਤੋਂ ਪੈਸਾ ਕਮਾਉਣ ਵਿੱਚ ਸੱਚਮੁੱਚ ਦਿਲਚਸਪੀ ਰੱਖਦਾ ਹੈ, ਤਾਂ ਇਹ ਸਟਾਕ ਮਾਰਕੀਟ ਵਿੱਚ ਸਮਾਂ ਬਿਤਾਉਣ ਬਾਰੇ ਹੈ. (ਸਮਾਂ ਮਾਰਕ ਕਰਨ ਦੀ ਬਜਾਏ!)

SIPs ਜਾਂ ਇੱਕਮੁਸ਼ਤ ਰਕਮ: ਇੱਕ ਵਿਸ਼ਲੇਸ਼ਣ
ਇਹ ਬਿਲਕੁਲ ਸਪੱਸ਼ਟ ਹੈ ਕਿ ਇਕੁਇਟੀ ਬਾਜ਼ਾਰਾਂ ਵਿੱਚ ਨਿਵੇਸ਼ ਕਰਨਾ ਇੱਕ ਲੰਬੇ ਸਮੇਂ ਦੀ ਖੇਡ ਹੈ। ਬਹੁਤ ਸਾਰੇ ਲੋਕ ਇਸ ਗੱਲ ਦੀ ਵਕਾਲਤ ਕਰਦੇ ਹਨ ਕਿ SIPs ਦੇ ਲਾਭ ਰੁਪਏ ਦੀ ਲਾਗਤ ਤੋਂ ਅਨੁਸ਼ਾਸਿਤ ਨਿਵੇਸ਼ ਤੱਕ ਵਧਦੇ ਹਨ, ਪਰ ਇੱਕ ਵੱਡੇ ਸਵਾਲ ਦਾ ਜਵਾਬ ਦਿੱਤਾ ਜਾਣਾ ਹੈ, ਕੀ SIP ਇੱਕਮੁਸ਼ਤ ਨਿਵੇਸ਼ ਨਾਲੋਂ ਬਿਹਤਰ ਰਿਟਰਨ ਪ੍ਰਦਾਨ ਕਰਦੇ ਹਨ?
ਅਸੀਂ 1979 (ਬੀ. ਐੱਸ. ਈ. ਸੈਂਸੈਕਸ ਦੀ ਸ਼ੁਰੂਆਤ ਤੋਂ) ਤੋਂ ਬਾਅਦ ਦੇ ਇਕੁਇਟੀ ਬਾਜ਼ਾਰਾਂ ਨੂੰ ਦੇਖ ਕੇ ਇਸ ਸਵਾਲ ਦੀ ਡੂੰਘੀ ਸਮਝ ਪ੍ਰਾਪਤ ਕਰਨ ਦੀ ਕੋਸ਼ਿਸ਼ ਕੀਤੀ। ਬੀਐਸਈ ਸੈਂਸੈਕਸ ਭਾਰਤ ਵਿੱਚ ਚੋਟੀ ਦੀਆਂ 30 ਕੰਪਨੀਆਂ ਦੀ ਇੱਕ ਰਚਨਾ ਹੈ ਅਤੇ ਇਹ ਇਕੁਇਟੀ ਮਾਰਕੀਟ ਦੀ ਪ੍ਰਤੀਨਿਧਤਾ ਹੈ। ਇਸ ਡੇਟਾ ਦਾ ਵਿਸ਼ਲੇਸ਼ਣ ਕਰਦੇ ਹੋਏ, ਅਸੀਂ ਇਹ ਦੇਖਣ ਲਈ ਕੁਝ ਸਮਝ ਪ੍ਰਾਪਤ ਕਰ ਸਕਦੇ ਹਾਂ ਕਿ ਕੀ SIPs ਜਾਂ ਇਕਮੁਸ਼ਤ ਰਕਮ, ਜੋ ਕਿ ਬਿਹਤਰ ਹੈ.
Talk to our investment specialist
ਸਟਾਕ ਮਾਰਕੀਟ ਦੇ ਸਭ ਤੋਂ ਮਾੜੇ ਦੌਰ
ਨਿਵੇਸ਼ ਸ਼ੁਰੂ ਕਰਨ ਦਾ ਸਭ ਤੋਂ ਮਾੜਾ ਸਮਾਂ ਸਤੰਬਰ 1994 ਦੇ ਆਸਪਾਸ ਸੀ (ਇਹ ਉਹ ਸਮਾਂ ਸੀ ਜਦੋਂ ਸਟਾਕ ਮਾਰਕੀਟ ਸਿਖਰ 'ਤੇ ਸੀ)। ਵਾਸਤਵ ਵਿੱਚ, ਜੇਕਰ ਕੋਈ ਮਾਰਕੀਟ ਡੇਟਾ ਨੂੰ ਵੇਖਦਾ ਹੈਨਿਵੇਸ਼ਕ ਜਿਸ ਨੇ ਇੱਕਮੁਸ਼ਤ ਨਿਵੇਸ਼ ਕੀਤਾ ਸੀ, ਉਹ 59 ਮਹੀਨਿਆਂ (ਲਗਭਗ 5 ਸਾਲ!) ਲਈ ਨਕਾਰਾਤਮਕ ਰਿਟਰਨ 'ਤੇ ਬੈਠੇ ਸਨ। 1999 ਦੇ ਲਗਭਗ ਜੁਲਾਈ ਵਿੱਚ ਨਿਵੇਸ਼ਕ ਵੀ ਟੁੱਟ ਗਿਆ। ਅਗਲੇ ਸਾਲ ਹਾਲਾਂਕਿ ਕੁਝ ਰਿਟਰਨ ਪੈਦਾ ਹੋਏ ਸਨ, ਪਰ ਬਾਅਦ ਵਿੱਚ 2000 ਦੇ ਸਟਾਕ ਮਾਰਕੀਟ ਕਰੈਸ਼ ਕਾਰਨ ਇਹ ਰਿਟਰਨ ਥੋੜ੍ਹੇ ਸਮੇਂ ਲਈ ਰਹੇ। ਹੋਰ 4 ਸਾਲ ਤਕ ਦੁੱਖ ਝੱਲਣ ਤੋਂ ਬਾਅਦ (ਨਕਾਰਾਤਮਕ ਰਿਟਰਨ ਦੇ ਨਾਲ) ਅਤੇ ਨਿਵੇਸ਼ਕ ਅੰਤ ਵਿੱਚ ਅਕਤੂਬਰ 2003 ਵਿੱਚ ਸਕਾਰਾਤਮਕ ਹੋ ਗਿਆ। ਇਹ ਇੱਕਮੁਸ਼ਤ ਨਿਵੇਸ਼ ਕਰਨ ਦਾ ਸਭ ਤੋਂ ਬੁਰਾ ਸਮਾਂ ਸੀ।
SIP ਨਿਵੇਸ਼ਕ ਨੂੰ ਕੀ ਹੋਇਆ? ਯੋਜਨਾਬੱਧ ਨਿਵੇਸ਼ ਯੋਜਨਾ ਨਿਵੇਸ਼ਕ ਸਿਰਫ 19 ਮਹੀਨਿਆਂ ਲਈ ਨਕਾਰਾਤਮਕ ਸੀ ਅਤੇ ਮੁਨਾਫੇ ਪੋਸਟ ਕਰਨਾ ਸ਼ੁਰੂ ਕਰ ਦਿੱਤਾ, ਹਾਲਾਂਕਿ, ਇਹ ਥੋੜ੍ਹੇ ਸਮੇਂ ਲਈ ਸਨ। ਐਸਆਈਪੀ ਨਿਵੇਸ਼ਕ ਅੰਤਰਿਮ ਨੁਕਸਾਨ ਝੱਲਣ ਤੋਂ ਬਾਅਦ ਮਈ 1999 ਤੱਕ ਦੁਬਾਰਾ ਵੱਧ ਗਏ ਸਨ। ਹਾਲਾਂਕਿ ਯਾਤਰਾ ਅਜੇ ਵੀ ਅਸਥਿਰ ਰਹੀ, SIP ਨਿਵੇਸ਼ਕਾਂ ਨੇ ਪੋਰਟਫੋਲੀਓ ਵਿੱਚ ਬਹੁਤ ਪਹਿਲਾਂ ਮੁਨਾਫਾ ਦਿਖਾਇਆ. ਇੱਕਮੁਸ਼ਤ ਨਿਵੇਸ਼ਕ ਲਈ ਵੱਧ ਤੋਂ ਵੱਧ ਨੁਕਸਾਨ ਲਗਭਗ 40% ਸੀ, ਜਦੋਂ ਕਿ SIP ਨਿਵੇਸ਼ਕ ਲਈ 23% ਸੀ। ਯੋਜਨਾਬੱਧ ਨਿਵੇਸ਼ ਯੋਜਨਾ ਨਿਵੇਸ਼ਕ ਕੋਲ ਪੋਰਟਫੋਲੀਓ ਵਿੱਚ ਘੱਟ ਨੁਕਸਾਨ ਦੇ ਨਾਲ-ਨਾਲ ਤੇਜ਼ੀ ਨਾਲ ਰਿਕਵਰੀ ਦੀ ਮਿਆਦ ਸੀ।
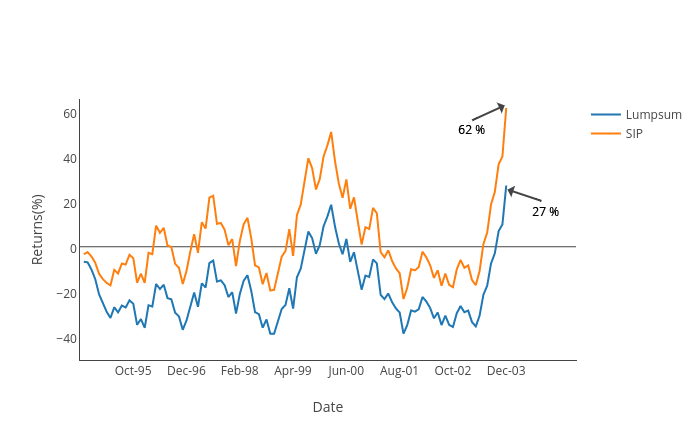
ਨਿਵੇਸ਼ ਸ਼ੁਰੂ ਕਰਨ ਲਈ ਇੱਕ ਹੋਰ ਬਹੁਤ ਹੀ ਉਦਾਸ ਸਮਾਂ ਮਾਰਚ 2000 ਦੇ ਆਸਪਾਸ ਸੀ (ਇਹ ਉਹ ਸਮਾਂ ਸੀ ਜਦੋਂ ਸਟਾਕ ਮਾਰਕੀਟ ਸਿਖਰ 'ਤੇ ਸੀ, ਦੁਬਾਰਾ!) ਵਾਸਤਵ ਵਿੱਚ, ਜੇਕਰ ਕੋਈ ਬਜ਼ਾਰ ਦੇ ਅੰਕੜਿਆਂ 'ਤੇ ਨਜ਼ਰ ਮਾਰਦਾ ਹੈ ਤਾਂ ਨਿਵੇਸ਼ਕ ਜਿਸਨੇ ਇੱਕਮੁਸ਼ਤ ਨਿਵੇਸ਼ ਕੀਤਾ ਸੀ, ਸਿੱਧੇ 45 ਮਹੀਨਿਆਂ (ਲਗਭਗ 4 ਸਾਲ!) ਲਈ ਨਕਾਰਾਤਮਕ ਰਿਟਰਨ 'ਤੇ ਬੈਠਾ ਸੀ। ਨਿਵੇਸ਼ਕ ਦਸੰਬਰ 2003 ਵਿੱਚ ਵੀ ਟੁੱਟ ਗਿਆ। ਅਗਲੇ ਸਾਲ ਭਾਵੇਂ ਕੁਝ ਰਿਟਰਨ ਪੈਦਾ ਹੋਏ ਸਨ, ਪਰ 2004 ਵਿੱਚ ਦੁਬਾਰਾ ਫਿਸਲਣ ਕਾਰਨ ਇਹ ਰਿਟਰਨ ਥੋੜ੍ਹੇ ਸਮੇਂ ਲਈ ਰਹਿ ਗਏ ਸਨ। ਇੱਕ ਹੋਰ ਸਾਲ ਤਕ ਦੁੱਖ ਝੱਲਣ ਤੋਂ ਬਾਅਦ, ਨਿਵੇਸ਼ਕ ਅੰਤ ਵਿੱਚ ਸਤੰਬਰ 2004 ਵਿੱਚ ਸਕਾਰਾਤਮਕ ਹੋ ਗਿਆ। ਇੱਕਮੁਸ਼ਤ ਨਿਵੇਸ਼ ਕਰਨ ਦਾ ਇੱਕ ਹੋਰ ਬੁਰਾ ਸਮਾਂ ਸੀ।
SIP ਨਿਵੇਸ਼ਕ ਦੀ ਕਹਾਣੀ ਕੀ ਸੀ ਜਿਸਨੇ ਮਾਰਚ 2000 ਵਿੱਚ ਨਿਵੇਸ਼ ਕਰਨਾ ਸ਼ੁਰੂ ਕੀਤਾ ਸੀ? ਜੇਕਰ ਕਿਸੇ ਨੇ ਬਰਾਬਰ ਰਕਮਾਂ ਦੀ ਮਾਸਿਕ ਰਕਮ ਦਾ ਨਿਵੇਸ਼ ਕੀਤਾ, ਤਾਂ ਨਿਵੇਸ਼ਕ ਜੂਨ 2003 ਵਿੱਚ ਸਕਾਰਾਤਮਕ ਸੀ ਅਤੇ ਸਤੰਬਰ 2004 ਤੱਕ, ਪੋਰਟਫੋਲੀਓ ਕੁੱਲ ਮਿਲਾ ਕੇ 45% ਵੱਧ ਗਿਆ ਸੀ। (ਜਦੋਂ ਇਕਮੁਸ਼ਤ ਨਿਵੇਸ਼ਕ ਵੀ ਤੋੜ ਰਿਹਾ ਸੀ)। ਨੋਟ ਕਰਨ ਲਈ ਇਕ ਹੋਰ ਪਹਿਲੂ ਹੈ ਵੱਧ ਤੋਂ ਵੱਧ ਨੁਕਸਾਨ, ਇਕਮੁਸ਼ਤ ਨਿਵੇਸ਼ਕ ਨੂੰ ਸਤੰਬਰ 2001 ਤੱਕ ਲਗਭਗ 50% ਦਾ ਨੁਕਸਾਨ ਹੋਇਆ ਹੈ, ਤੁਲਨਾਤਮਕ ਤੌਰ 'ਤੇ, SIP ਪੋਰਟਫੋਲੀਓ ਦਾ ਨੁਕਸਾਨ ਉਸੇ ਸਮੇਂ 28% ਸੀ।
ਅਸੀਂ ਉਪਰੋਕਤ ਤੋਂ ਜੋ ਪ੍ਰਾਪਤ ਕਰ ਸਕਦੇ ਹਾਂ ਉਹ ਇਹ ਹੈ ਕਿ ਜਦੋਂ ਸਟਾਕ ਮਾਰਕੀਟ ਇੱਕ ਮਾੜੇ ਸਮੇਂ ਵਿੱਚ ਹੁੰਦਾ ਹੈ, ਤਾਂ SIP ਵਿੱਚ ਰਹਿਣਾ ਹਮੇਸ਼ਾਂ ਬਿਹਤਰ ਹੁੰਦਾ ਹੈ ਕਿਉਂਕਿ ਰਿਕਵਰੀ ਤੇਜ਼ ਹੁੰਦੀ ਹੈ ਅਤੇ ਪੋਰਟਫੋਲੀਓ ਵਿੱਚ ਵੀ ਘੱਟ ਨੁਕਸਾਨ ਹੁੰਦਾ ਹੈ।
ਸਟਾਕ ਮਾਰਕੀਟ ਦੇ ਵਧੀਆ ਦੌਰ
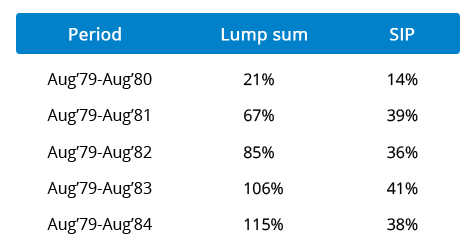
ਸਟਾਕ ਮਾਰਕੀਟ ਦੇ 1979 ਤੋਂ 2016 ਤੱਕ ਦੇ ਪਿਛਲੇ 37 ਸਾਲਾਂ ਦੇ ਅੰਕੜਿਆਂ 'ਤੇ ਨਜ਼ਰ ਮਾਰਦੇ ਹੋਏ, ਕੋਈ ਸਮਝਦਾ ਹੈ ਕਿ ਜੇਕਰ ਕਿਸੇ ਨੇ (1979 - ਬੀ.ਐੱਸ.ਈ. ਸੈਂਸੈਕਸ ਦੀ ਸ਼ੁਰੂਆਤ ਦਾ ਸਮਾਂ) ਤੋਂ ਪਹਿਲਾਂ ਨਿਵੇਸ਼ ਕੀਤਾ, ਤਾਂ ਕਿਸੇ ਨੇ ਪੋਰਟਫੋਲੀਓ ਵਿੱਚ ਸ਼ਾਇਦ ਹੀ ਕੋਈ ਨਕਾਰਾਤਮਕ ਰਿਟਰਨ ਦੇਖਿਆ।
ਅਗਸਤ 1979 ਤੋਂ ਇੱਕ 5-ਸਾਲ ਦਾ ਵਿਸ਼ਲੇਸ਼ਣ ਦਰਸਾਉਂਦਾ ਹੈ ਕਿ ਇੱਕਮੁਸ਼ਤ ਰਕਮ ਅਤੇ ਸਿਸਟਮੈਟਿਕ ਇਨਵੈਸਟਮੈਂਟ ਪਲਾਨ ਪੋਰਟਫੋਲੀਓ ਦੋਵਾਂ ਨੇ ਉੱਥੇ ਤੋਂ ਕਿਸੇ ਵੀ ਸਮੇਂ ਦੀ ਮਿਆਦ ਵਿੱਚ ਸ਼ਾਇਦ ਹੀ ਕੋਈ ਘਾਟਾ ਪਾਇਆ। ਜਿਵੇਂ ਕਿ ਕੋਈ ਹੇਠਾਂ ਦਿੱਤੇ ਗ੍ਰਾਫ ਤੋਂ ਦੇਖ ਸਕਦਾ ਹੈ, ਦੋਵੇਂ ਪੋਰਟਫੋਲੀਓ ਨੇ ਸਾਲ-ਦਰ-ਸਾਲ ਸ਼ਾਨਦਾਰ ਮੁਨਾਫਾ ਪੋਸਟ ਕੀਤਾ। ਹਰ ਸਾਲ ਦੇ ਅੰਤ ਵਿੱਚ, ਇੱਕਮੁਸ਼ਤ ਪੋਰਟਫੋਲੀਓ ਨੇ SIP ਪੋਰਟਫੋਲੀਓ ਨੂੰ ਪਛਾੜ ਦਿੱਤਾ ਅਤੇ ਲੀਡ ਮਾਰਜਿਨ ਨੂੰ ਵੀ ਵਧਾਇਆ।
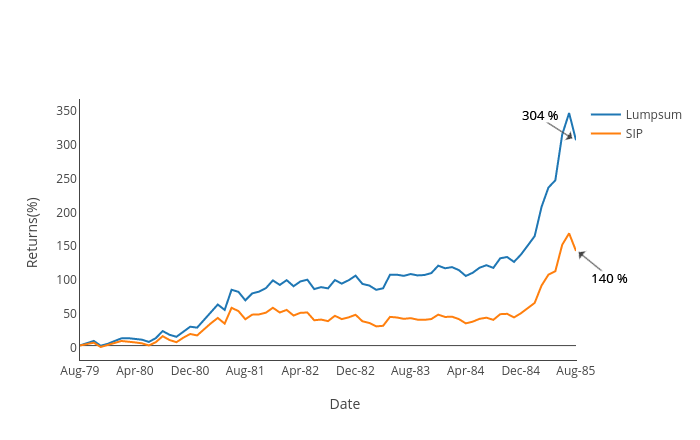
ਇਸ ਲਈ, ਜੇਕਰ ਮਾਰਕੀਟ ਦੇ ਇੱਕ ਪਾਸੇ ਵਧਣ ਦੀ ਉਮੀਦ ਕੀਤੀ ਜਾਂਦੀ ਹੈ, ਤਾਂ ਇੱਕਮੁਸ਼ਤ ਰਕਮ ਹਮੇਸ਼ਾ ਬਿਹਤਰ ਵਿਕਲਪ ਹੁੰਦੀ ਹੈ।
ਬਿਹਤਰ ਨਿਵੇਸ਼ ਮੋਡ ਕਿਹੜਾ ਹੈ?
ਜਦੋਂ ਕਿ ਅਸੀਂ ਸਟਾਕ ਮਾਰਕੀਟ ਦੇ ਸਾਰੇ ਸਮੇਂ ਦਾ ਵਿਸ਼ਲੇਸ਼ਣ ਕਰ ਸਕਦੇ ਹਾਂ, ਕੀ ਅਸੀਂ ਸੱਚਮੁੱਚ ਇਹ ਫੈਸਲਾ ਕਰ ਸਕਦੇ ਹਾਂ ਕਿ ਕਿਹੜਾ ਬਿਹਤਰ ਹੈ? ਇਸ ਦਾ ਜਵਾਬ ਵਿਅਕਤੀਗਤ ਤੋਂ ਵਿਅਕਤੀਗਤ ਤੱਕ ਵੱਖਰਾ ਹੁੰਦਾ ਹੈ,ਨਕਦ ਵਹਾਅ, ਨਿਵੇਸ਼ (ਜਾਂ ਰੱਖਣ) ਦੀ ਮਿਆਦ, ਬਾਹਰ ਜਾਣ ਵਾਲੇ ਨਕਦ ਪ੍ਰਵਾਹ ਜਾਂ ਲੋੜਾਂ ਆਦਿ। SIP ਬੱਚਤ ਦੀ ਆਦਤ ਪੈਦਾ ਕਰਨ ਲਈ ਇੱਕ ਵਧੀਆ ਸਾਧਨ ਹਨ, ਇਹ ਵਿਅਕਤੀਆਂ ਦੇ ਨਿਵੇਸ਼ ਨੂੰ ਸਟਾਕ ਮਾਰਕੀਟ ਵਿੱਚ ਬਦਲਦੇ ਹਨ। ਜੇਕਰ ਤੁਸੀਂ ਇਕੁਇਟੀ ਵਿੱਚ ਨਿਵੇਸ਼ ਕਰਨ ਦੀ ਯੋਜਨਾ ਬਣਾਉਂਦੇ ਹੋ, ਤਾਂ ਕਿਸੇ ਨੂੰ ਲੰਬੇ ਸਮੇਂ ਲਈ ਨਿਵੇਸ਼ ਕਰਨ ਦੀ ਯੋਜਨਾ ਬਣਾਉਣੀ ਪੈਂਦੀ ਹੈ, ਜਿੱਥੇ ਅਸੀਂ ਸਪੱਸ਼ਟ ਤੌਰ 'ਤੇ ਜਾਣਦੇ ਹਾਂ ਕਿ ਰਿਟਰਨ ਪੈਦਾ ਕਰਨ ਦੀ ਸਮਰੱਥਾ ਸਮੇਂ ਦੇ ਨਾਲ ਵਧਦੀ ਹੈ। ਇਸ ਤੋਂ ਇਲਾਵਾ, ਜੇਕਰ ਕੋਈ ਮਹਿਸੂਸ ਕਰਦਾ ਹੈ ਕਿ ਬਜ਼ਾਰ ਖਰਾਬ ਹੋ ਸਕਦੇ ਹਨ ਨਾ ਕਿ ਸਿੱਧੀ ਲਾਈਨ, ਤਾਂ SIPs ਮਾਰਕੀਟ ਵਿੱਚ ਦਾਖਲ ਹੋਣ ਲਈ ਇੱਕ ਵਧੀਆ ਸਾਧਨ ਹਨ। ਇਸ ਤੋਂ ਇਲਾਵਾ, ਡੇਟਾ ਦਿਖਾਉਂਦਾ ਹੈ ਕਿ SIPs ਇਹ ਵੀ ਯਕੀਨੀ ਬਣਾਉਂਦਾ ਹੈ ਕਿ ਨਿਵੇਸ਼ਕ ਨੂੰ ਕਿਸੇ ਵੀ ਸਮੇਂ ਘੱਟ ਨੁਕਸਾਨ ਹੁੰਦਾ ਹੈ।
ਜੇਕਰ ਇਹ ਮਹਿਸੂਸ ਕੀਤਾ ਜਾ ਰਿਹਾ ਹੈ ਕਿ ਬਜ਼ਾਰ ਉਲਟ ਪਾਸੇ ਧਰਮ ਨਿਰਪੱਖ (ਇਕ ਤਰਫਾ) ਹੋਵੇਗਾ, ਤਾਂ ਉਸ ਸਥਿਤੀ ਵਿੱਚ, ਇਕਮੁਸ਼ਤ ਨਿਵੇਸ਼ ਹੀ ਜਾਣ ਦਾ ਰਸਤਾ ਹੋਵੇਗਾ।
ਭਾਰਤ 2022 ਵਿੱਚ ਵਧੀਆ ਪ੍ਰਦਰਸ਼ਨ ਕਰਨ ਵਾਲੀਆਂ SIP ਯੋਜਨਾਵਾਂ
The primary investment objective of the Scheme is to seek capital appreciation by investing predominantly in the units of BlackRock Global Funds – World Mining Fund. The Scheme may, at the discretion of the Investment Manager, also invest in the units of other similar overseas mutual fund schemes, which may
constitute a significant part of its corpus. The Scheme may also invest a certain portion of its corpus in money market securities and/or money market/liquid schemes of DSP BlackRock Mutual Fund, in order to meet liquidity requirements from time to time. Below is the key information for DSP World Mining Fund Returns up to 1 year are on "The primary investment objective of the Scheme is to seek capital appreciation by investing predominantly in units of MLIIF - WGF. The Scheme may, at the discretion of the Investment Manager, also invest in the units of other similar overseas mutual fund schemes, which may constitute a significant part of its corpus. The Scheme may also invest a certain portion of its corpus in money market securities and/or units of money market/liquid schemes of DSP Merrill Lynch Mutual Fund, in order to meet liquidity requirements from time to time. However, there is no assurance that the investment objective of the Scheme will be realized." Research Highlights for DSP World Gold Fund Below is the key information for DSP World Gold Fund Returns up to 1 year are on The primary investment objective of the Scheme is to seek to provide long term capital growth by investing predominantly in the JPMorgan Funds - Emerging Markets Opportunities Fund, an equity fund which invests primarily in an aggressively managed portfolio of emerging market companies Research Highlights for Edelweiss Emerging Markets Opportunities Equity Off-shore Fund Below is the key information for Edelweiss Emerging Markets Opportunities Equity Off-shore Fund Returns up to 1 year are on An open-end diversified equity fund that seeks to provide medium to long term appreciation through investments primarily in Asian Companies / sectors (excluding Japan) with long term potential across market capitalisation. Research Highlights for Franklin Asian Equity Fund Below is the key information for Franklin Asian Equity Fund Returns up to 1 year are on The primary investment objective of the Scheme is to seek capital appreciation by investing predominantly in the units of BlackRock Global Funds – World Energy Fund and BlackRock Global Funds – New Energy Fund. The Scheme may, at the discretion of the Investment Manager, also invest in the units of other similar overseas mutual fund schemes, which may constitute a significant part of its corpus. The Scheme may also invest a certain portion of its corpus in money market securities
and/or money market/liquid schemes of DSP BlackRock Mutual Fund, in order to meet liquidity
requirements from time to time. Research Highlights for DSP World Energy Fund Below is the key information for DSP World Energy Fund Returns up to 1 year are on 1. DSP World Mining Fund
DSP World Mining Fund
Growth Launch Date 29 Dec 09 NAV (30 Jul 26) ₹30.7162 ↑ 0.88 (2.94 %) Net Assets (Cr) ₹164 on 30 Jun 26 Category Equity - Global AMC DSP BlackRock Invmt Managers Pvt. Ltd. Rating ☆☆☆ Risk High Expense Ratio 1.14 Sharpe Ratio 1.74 Information Ratio 0 Alpha Ratio 0 Min Investment 1,000 Min SIP Investment 500 Exit Load 0-12 Months (1%),12 Months and above(NIL) Growth of 10,000 investment over the years.
Date Value 31 Jul 21 ₹10,000 31 Jul 22 ₹8,812 31 Jul 23 ₹11,045 31 Jul 24 ₹10,685 31 Jul 25 ₹11,685 31 Jul 26 ₹19,837 Returns for DSP World Mining Fund
absolute basis & more than 1 year are on CAGR (Compound Annual Growth Rate) basis. as on 30 Jul 26 Duration Returns 1 Month 3.6% 3 Month -3.7% 6 Month -3.6% 1 Year 69.4% 3 Year 23.2% 5 Year 15.1% 10 Year 15 Year Since launch 7% Historical performance (Yearly) on absolute basis
Year Returns 2025 79% 2024 -8.1% 2023 0% 2022 12.2% 2021 18% 2020 34.9% 2019 21.5% 2018 -9.4% 2017 21.1% 2016 49.7% Fund Manager information for DSP World Mining Fund
Name Since Tenure Kaivalya Nadkarni 1 May 25 1.17 Yr. Data below for DSP World Mining Fund as on 30 Jun 26
Equity Sector Allocation
Sector Value Basic Materials 93.17% Energy 1.11% Asset Allocation
Asset Class Value Cash 5.71% Equity 94.28% Debt 0.01% Top Securities Holdings / Portfolio
Name Holding Value Quantity BGF World Mining I2
Investment Fund | -96% ₹180 Cr 141,035 Treps / Reverse Repo Investments
CBLO/Reverse Repo | -4% ₹7 Cr Net Receivables/Payables
Net Current Assets | -0% ₹0 Cr 2. DSP World Gold Fund
DSP World Gold Fund
Growth Launch Date 14 Sep 07 NAV (30 Jul 26) ₹50.4247 ↑ 1.63 (3.33 %) Net Assets (Cr) ₹1,433 on 30 Jun 26 Category Equity - Global AMC DSP BlackRock Invmt Managers Pvt. Ltd. Rating ☆☆☆ Risk High Expense Ratio 1.41 Sharpe Ratio 1.22 Information Ratio -0.5 Alpha Ratio 2.12 Min Investment 1,000 Min SIP Investment 500 Exit Load 0-12 Months (1%),12 Months and above(NIL) Growth of 10,000 investment over the years.
Date Value 31 Jul 21 ₹10,000 31 Jul 22 ₹7,373 31 Jul 23 ₹9,366 31 Jul 24 ₹11,150 31 Jul 25 ₹16,504 31 Jul 26 ₹26,355 Returns for DSP World Gold Fund
absolute basis & more than 1 year are on CAGR (Compound Annual Growth Rate) basis. as on 30 Jul 26 Duration Returns 1 Month 2.3% 3 Month -12.7% 6 Month -17.8% 1 Year 62.8% 3 Year 43.6% 5 Year 22.1% 10 Year 15 Year Since launch 8.9% Historical performance (Yearly) on absolute basis
Year Returns 2025 167.1% 2024 15.9% 2023 7% 2022 -7.7% 2021 -9% 2020 31.4% 2019 35.1% 2018 -10.7% 2017 -4% 2016 52.7% Fund Manager information for DSP World Gold Fund
Name Since Tenure Kaivalya Nadkarni 1 May 25 1.17 Yr. Data below for DSP World Gold Fund as on 30 Jun 26
Equity Sector Allocation
Sector Value Basic Materials 94.47% Asset Allocation
Asset Class Value Cash 3.62% Equity 94.47% Debt 0% Other 1.91% Top Securities Holdings / Portfolio
Name Holding Value Quantity BGF World Gold I2
Investment Fund | -68% ₹1,141 Cr 1,005,044 VanEck Gold Miners ETF
- | GDX29% ₹490 Cr 573,719 Treps / Reverse Repo Investments
CBLO/Reverse Repo | -3% ₹54 Cr Net Receivables/Payables
Net Current Assets | -0% -₹6 Cr 3. Edelweiss Emerging Markets Opportunities Equity Off-shore Fund
Edelweiss Emerging Markets Opportunities Equity Off-shore Fund
Growth Launch Date 7 Jul 14 NAV (30 Jul 26) ₹26.7341 ↑ 0.45 (1.70 %) Net Assets (Cr) ₹259 on 30 Jun 26 Category Equity - Global AMC Edelweiss Asset Management Limited Rating ☆☆☆ Risk High Expense Ratio 1.04 Sharpe Ratio 2.2 Information Ratio -0.41 Alpha Ratio 6.3 Min Investment 5,000 Min SIP Investment 1,000 Exit Load 0-1 Years (1%),1 Years and above(NIL) Growth of 10,000 investment over the years.
Date Value 31 Jul 21 ₹10,000 31 Jul 22 ₹7,821 31 Jul 23 ₹8,604 31 Jul 24 ₹9,029 31 Jul 25 ₹10,507 31 Jul 26 ₹16,349 Returns for Edelweiss Emerging Markets Opportunities Equity Off-shore Fund
absolute basis & more than 1 year are on CAGR (Compound Annual Growth Rate) basis. as on 30 Jul 26 Duration Returns 1 Month -7.1% 3 Month 0.6% 6 Month 12% 1 Year 50.9% 3 Year 22.8% 5 Year 9.7% 10 Year 15 Year Since launch 8.5% Historical performance (Yearly) on absolute basis
Year Returns 2025 41.1% 2024 5.9% 2023 5.5% 2022 -16.8% 2021 -5.9% 2020 21.7% 2019 25.1% 2018 -7.2% 2017 30% 2016 9.8% Fund Manager information for Edelweiss Emerging Markets Opportunities Equity Off-shore Fund
Name Since Tenure Bhavesh Jain 9 Apr 18 8.23 Yr. Bharat Lahoti 1 Oct 21 4.75 Yr. Data below for Edelweiss Emerging Markets Opportunities Equity Off-shore Fund as on 30 Jun 26
Equity Sector Allocation
Sector Value Technology 35.88% Financial Services 20.6% Consumer Cyclical 10.01% Communication Services 7.79% Industrials 5.82% Energy 5.13% Basic Materials 2.8% Consumer Defensive 1.98% Utility 1.27% Health Care 0.52% Asset Allocation
Asset Class Value Cash 6.04% Equity 93.14% Debt 0.01% Other 0.49% Top Securities Holdings / Portfolio
Name Holding Value Quantity JPM Emerging Mkts Opps I acc USD
Investment Fund | -96% ₹241 Cr 102,137
↑ 3,897 Clearing Corporation Of India Ltd.
CBLO/Reverse Repo | -4% ₹10 Cr Net Receivables/(Payables)
CBLO | -0% -₹1 Cr Accrued Interest
CBLO | -0% ₹0 Cr 4. Franklin Asian Equity Fund
Franklin Asian Equity Fund
Growth Launch Date 16 Jan 08 NAV (31 Jul 26) ₹44.1026 ↑ 2.12 (5.04 %) Net Assets (Cr) ₹979 on 30 Jun 26 Category Equity - Global AMC Franklin Templeton Asst Mgmt(IND)Pvt Ltd Rating ☆☆☆☆☆ Risk High Expense Ratio 2.54 Sharpe Ratio 1.54 Information Ratio 0 Alpha Ratio 0 Min Investment 5,000 Min SIP Investment 500 Exit Load 0-3 Years (1%),3 Years and above(NIL) Growth of 10,000 investment over the years.
Date Value 31 Jul 21 ₹10,000 31 Jul 22 ₹8,345 31 Jul 23 ₹8,886 31 Jul 24 ₹9,355 31 Jul 25 ₹10,562 31 Jul 26 ₹14,752 Returns for Franklin Asian Equity Fund
absolute basis & more than 1 year are on CAGR (Compound Annual Growth Rate) basis. as on 30 Jul 26 Duration Returns 1 Month -2.7% 3 Month 9.3% 6 Month 14.1% 1 Year 39.7% 3 Year 18.4% 5 Year 8.1% 10 Year 15 Year Since launch 8.3% Historical performance (Yearly) on absolute basis
Year Returns 2025 23.7% 2024 14.4% 2023 0.7% 2022 -14.5% 2021 -5.9% 2020 25.8% 2019 28.2% 2018 -13.6% 2017 35.5% 2016 7.2% Fund Manager information for Franklin Asian Equity Fund
Name Since Tenure Sandeep Manam 18 Oct 21 4.7 Yr. Shyam Sriram 26 Sep 24 1.76 Yr. Data below for Franklin Asian Equity Fund as on 30 Jun 26
Equity Sector Allocation
Sector Value Technology 32.45% Consumer Cyclical 15.53% Financial Services 11.03% Industrials 10.11% Health Care 5.7% Real Estate 4.83% Energy 3.46% Basic Materials 3.42% Communication Services 2.83% Utility 2.24% Consumer Defensive 1.74% Asset Allocation
Asset Class Value Cash 6.65% Equity 93.35% Top Securities Holdings / Portfolio
Name Holding Value Quantity Taiwan Semiconductor Manufacturing Co Ltd (Technology)
Equity, Since 31 Mar 09 | 23309% ₹81 Cr 114,000
↑ 41,000 Samsung Electronics Co Ltd (Technology)
Equity, Since 31 Mar 08 | 0059307% ₹62 Cr 30,867
↑ 8,934 SK Hynix Inc (Technology)
Equity, Since 30 Jun 20 | 0006605% ₹47 Cr 3,222
↑ 655 MediaTek Inc (Technology)
Equity, Since 31 Aug 20 | 24543% ₹25 Cr 19,000 ICICI Bank Ltd (Financial Services)
Equity, Since 31 Dec 25 | ICICIBANK3% ₹24 Cr 191,115
↑ 43,880 Yageo Corp (Technology)
Equity, Since 30 Jun 25 | 23272% ₹19 Cr 86,000 Tencent Holdings Ltd (Communication Services)
Equity, Since 31 Jul 14 | NNND2% ₹18 Cr 34,400
↑ 5,200 HDFC Bank Ltd (Financial Services)
Equity, Since 31 Dec 25 | HDFCBANK2% ₹17 Cr 224,505
↑ 71,852 Larsen & Toubro Ltd (Industrials)
Equity, Since 31 Mar 24 | LT2% ₹16 Cr 39,999
↑ 5,662 Eternal Ltd (Consumer Cyclical)
Equity, Since 31 Jul 21 | ETERNAL2% ₹16 Cr 639,163
↑ 237,879 5. DSP World Energy Fund
DSP World Energy Fund
Growth Launch Date 14 Aug 09 NAV (30 Jul 26) ₹28.3086 ↑ 0.67 (2.42 %) Net Assets (Cr) ₹117 on 30 Jun 26 Category Equity - Global AMC DSP BlackRock Invmt Managers Pvt. Ltd. Rating ☆☆ Risk High Expense Ratio 1.18 Sharpe Ratio 2.76 Information Ratio 0 Alpha Ratio 0 Min Investment 1,000 Min SIP Investment 500 Exit Load 0-12 Months (1%),12 Months and above(NIL) Growth of 10,000 investment over the years.
Date Value 31 Jul 21 ₹10,000 31 Jul 22 ₹9,575 31 Jul 23 ₹11,538 31 Jul 24 ₹11,246 31 Jul 25 ₹12,513 31 Jul 26 ₹17,462 Returns for DSP World Energy Fund
absolute basis & more than 1 year are on CAGR (Compound Annual Growth Rate) basis. as on 30 Jul 26 Duration Returns 1 Month -5.4% 3 Month -4.6% 6 Month 8.2% 1 Year 39.5% 3 Year 15.2% 5 Year 11.9% 10 Year 15 Year Since launch 6.3% Historical performance (Yearly) on absolute basis
Year Returns 2025 39.2% 2024 -6.8% 2023 12.9% 2022 -8.6% 2021 29.5% 2020 0% 2019 18.2% 2018 -11.3% 2017 -1.9% 2016 22.5% Fund Manager information for DSP World Energy Fund
Name Since Tenure Kaivalya Nadkarni 1 May 25 1.17 Yr. Data below for DSP World Energy Fund as on 30 Jun 26
Equity Sector Allocation
Sector Value Industrials 36.73% Utility 22.76% Technology 22.09% Basic Materials 9.94% Consumer Cyclical 0.71% Asset Allocation
Asset Class Value Cash 7.75% Equity 92.23% Debt 0.02% Top Securities Holdings / Portfolio
Name Holding Value Quantity BGF Sustainable Energy I2
Investment Fund | -97% ₹118 Cr 404,670 Treps / Reverse Repo Investments
CBLO/Reverse Repo | -3% ₹4 Cr Net Receivables/Payables
Net Current Assets | -0% ₹0 Cr
ਇੱਕਮੁਸ਼ਤ ਰੂਟ ਜਾਂ SIPs ਦੁਆਰਾ ਨਿਵੇਸ਼ ਕਰਨ ਦੀ ਅੰਤਮ ਚੋਣ ਬਹੁਤ ਸਾਰੇ ਕਾਰਕਾਂ ਦੀ ਸਮਾਪਤੀ ਹੋਵੇਗੀ, ਹਾਲਾਂਕਿ, ਨਿਵੇਸ਼ਕ ਨੂੰ ਇਹਨਾਂ ਸਭ ਨੂੰ ਧਿਆਨ ਵਿੱਚ ਰੱਖਣਾ ਚਾਹੀਦਾ ਹੈਜੋਖਮ ਦੀ ਭੁੱਖ ਵਧੀਆ ਰਸਤਾ ਚੁਣਨ ਲਈ. ਚੰਗੀ ਤਰ੍ਹਾਂ ਚੁਣੋ, ਸਮਝਦਾਰੀ ਨਾਲ ਚੁਣੋ, ਨਿਵੇਸ਼ ਕਰਦੇ ਰਹੋ!
ਇਹ ਯਕੀਨੀ ਬਣਾਉਣ ਲਈ ਸਾਰੇ ਯਤਨ ਕੀਤੇ ਗਏ ਹਨ ਕਿ ਇੱਥੇ ਦਿੱਤੀ ਗਈ ਜਾਣਕਾਰੀ ਸਹੀ ਹੈ। ਹਾਲਾਂਕਿ, ਡੇਟਾ ਦੀ ਸ਼ੁੱਧਤਾ ਬਾਰੇ ਕੋਈ ਗਾਰੰਟੀ ਨਹੀਂ ਦਿੱਤੀ ਗਈ ਹੈ। ਕਿਰਪਾ ਕਰਕੇ ਕੋਈ ਵੀ ਨਿਵੇਸ਼ ਕਰਨ ਤੋਂ ਪਹਿਲਾਂ ਸਕੀਮ ਜਾਣਕਾਰੀ ਦਸਤਾਵੇਜ਼ ਨਾਲ ਤਸਦੀਕ ਕਰੋ।


AMFI Registration No. 112358 | CIN: U74999MH2016PTC282153
Shepard Technologies Pvt. Ltd. (with ARN code 112358) makes no warranties or representations, express or implied, on products offered through the platform. It accepts no liability for any damages or losses, however caused, in connection with the use of, or on the reliance of its product or related services. Terms and conditions of the website are applicable.
©2026 Shepard Technologies Private Limited. All Rights Reserved
Research Highlights for DSP World Mining Fund