ELSS vs పన్ను ఆదా FD
ఈక్విటీ లింక్డ్ సేవింగ్స్ స్కీమ్ (ELSS)
ELSS ఒక్కటేమ్యూచువల్ ఫండ్ 80C తగ్గింపులకు అర్హులు. ఇది డైవర్సిఫైడ్ ఈక్విటీ మ్యూచువల్ ఫండ్, ఇది రూ. వరకు పన్ను మినహాయింపులను అందిస్తుంది. సంవత్సరానికి 1.5 లక్షల కిందసెక్షన్ 80C యొక్కఆదాయ పన్ను చట్టం (IT చట్టం 1961).

ఫిబ్రవరి బడ్జెట్ 2018 ప్రవేశపెట్టడానికి ముందు, దాని రిటర్న్లు పూర్తిగా పన్ను రహితంగా ఉన్నాయి. అయితే, ఇప్పుడు ఇది 10% దీర్ఘకాలానికి లోబడి ఉందిరాజధాని మీ ఉంటే పన్ను లాభాలుమూలధన లాభాలు రూ. మించిపోయింది. ఒక సంవత్సరం తర్వాత 1 లక్ష. 10% పన్ను తగ్గింపు తర్వాత కూడా, ఇతర పన్ను-పొదుపు సాధనాలతో పోలిస్తే ELSS అత్యుత్తమ రాబడిని అందించే సామర్థ్యాన్ని కలిగి ఉంది. ELSS పెట్టుబడుల పెర్క్లు వీటికే పరిమితం కావుపన్నులు రక్షించబడింది. దిసమ్మేళనం యొక్క శక్తి మీరు 5 సంవత్సరాలు (పన్ను ఆదా కాలవ్యవధి) కోసం పెట్టుబడి పెడితే మీ పెట్టుబడి రెట్టింపు అవుతుందని నిర్ధారిస్తుందిఎఫ్ డి) దానికి అదనంగా, కనీస లాక్-ఇన్ వ్యవధి 3 సంవత్సరాలు మాత్రమే.
పన్ను ఆదా ఫిక్స్డ్ డిపాజిట్లు
పెట్టుబడి పెడుతున్నారు బ్యాంకుల వద్ద ఉన్న ఫిక్స్డ్ డిపాజిట్లలోని డబ్బు వ్యక్తులు మరియు HUFలు పన్నును క్లెయిమ్ చేయడానికి అనుమతిస్తుందితగ్గింపు రూ. 1,50,000 ఒక ఆర్థిక సంవత్సరంలో. ఈ డిపాజిట్లకు 5 సంవత్సరాల లాక్-ఇన్ వ్యవధి ఉంటుంది. అయితే, మీరు ఈ డిపాజిట్ను ముందుగానే ఉపసంహరించుకోలేరు. కానీ మీరు మీ FDలపై పోటీ రేట్లలో లోన్లను పొందవచ్చు. అయితే, ఈ డిపాజిట్లపై వచ్చే వడ్డీ అనేది వ్యక్తి యొక్క పన్ను విధించదగిన ఉపాంత పన్ను రేటు (పన్ను బ్రాకెట్ ప్రకారం).
పన్ను సేవర్ FD యొక్క ముఖ్యాంశాలు
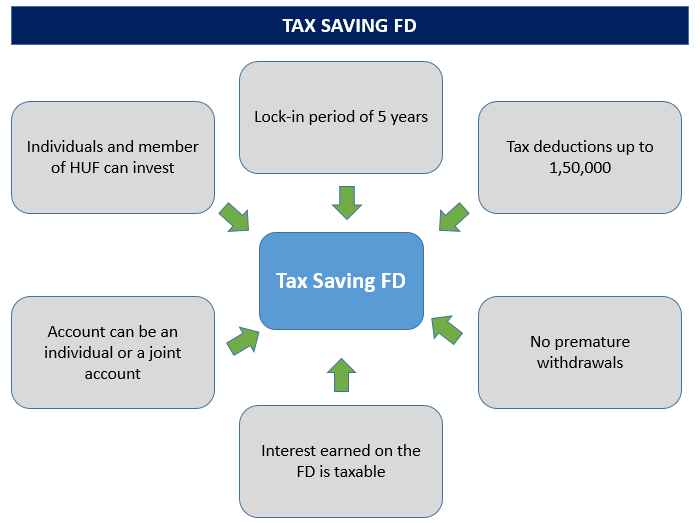
యొక్క ముఖ్యాంశాలను చూద్దాంపన్ను ఆదా ఎఫ్ డి -
- వ్యక్తులు మరియు సభ్యులు మాత్రమేహిందూ అవిభక్త కుటుంబం (HUF)లో పెట్టుబడి పెట్టవచ్చుపన్ను ఆదా FD పథకం
- పన్ను ఆదా చేసే FD యొక్క కనీస పెట్టుబడి మొత్తం మారుతూ ఉంటుందిబ్యాంక్ బ్యాంకుకు
- పన్ను ఆదా చేసే FD యొక్క లాక్-ఇన్ వ్యవధి ఐదు సంవత్సరాలు
- మీరు రూ. వరకు పన్ను మినహాయింపులను పొందవచ్చు. 1,50,000
- ముందస్తు ఉపసంహరణకు ఎటువంటి నిబంధన లేదు
- మీరు ఈ పన్ను ఆదా చేసే FDకి వ్యతిరేకంగా లోన్ కోసం దరఖాస్తు చేయలేరు
- ఈ పన్ను ఆదా చేసే FDలలో పెట్టుబడిని ఏదైనా ప్రైవేట్ లేదా ప్రభుత్వ రంగ బ్యాంకులో చేయవచ్చు (సహకార మరియు గ్రామీణ బ్యాంకులు మినహా)
- పెట్టుబడి పెట్టారుతపాలా కార్యాలయము ఐదు సంవత్సరాలకు పైగా కాల డిపాజిట్ కూడా పన్ను ఆదా FDగా అర్హత పొందుతుంది
- మీరు పోస్టాఫీసు FDని ఒక పోస్టాఫీసు నుండి మరొక పోస్టాఫీసుకు బదిలీ చేయవచ్చు
- ఈ రకమైన FD నుండి వచ్చే వడ్డీకి పన్ను విధించబడుతుంది మరియు మూలం నుండి తీసివేయబడుతుంది
- పన్ను ఆదా డిపాజిట్ ఖాతాను వ్యక్తిగతంగా మరియు ఉమ్మడిగా తెరవవచ్చు.
- జాయింట్ ఖాతా విషయంలో, జాయింట్ ఖాతా యొక్క మొదటి హోల్డర్ ద్వారా పన్ను ప్రయోజనం పొందబడుతుంది
Talk to our investment specialist
ELSS vs FD - పోలిక
వివిధ పారామితులపై ELSS మరియు పన్ను ఆదా FDల మధ్య తేడాల యొక్క శీఘ్ర అవలోకనం ఇక్కడ ఉంది:
| పరామితి | ఎఫ్ డి | ELSS |
|---|---|---|
| పదవీకాలం | 5 సంవత్సరాల లాక్-ఇన్ | 3 సంవత్సరాల లాక్-ఇన్ |
| తిరిగి వస్తుంది | 7.00 - 8.00 % (సంయుక్త వార్షికంగా) | హామీ ఇవ్వబడిన డివివిడెండ్ / రిటర్న్ లేదుసంత సాధారణంగా సంవత్సరానికి 16 - 17% లింక్ చేయబడింది |
| కనిష్ట పెట్టుబడి | రూ. 1000 | రూ. 500 |
| గరిష్టంగా పెట్టుబడి | ఎగువ పరిమితి లేదు | ఎగువ పరిమితి లేదు |
| 80c కింద తగ్గింపుకు అర్హమైన మొత్తం | రూ. 1.5 లక్షలు | రూ. 1.5 లక్షలు |
| వడ్డీ/రిటర్న్ కోసం పన్ను | వడ్డీ పన్ను విధించబడుతుంది | రూ.ల వరకు లాభపడుతుంది. 1 లక్ష పన్ను ఉచితం. రూ. కంటే ఎక్కువ లాభాలకు 10% పన్ను వర్తిస్తుంది. 1 లక్ష |
| భద్రత/రేటింగ్లు | సురక్షితమైనది | బిట్ రిస్కీ |
| ద్రవ్యత | మీరు 5 సంవత్సరాలలోపు పన్ను ఆదా చేసే FDని ఉపసంహరించుకోలేరు | మీరు 3 సంవత్సరాల తర్వాత ELSS నుండి నిష్క్రమించవచ్చు లేదా ఉపసంహరించుకోవచ్చు. |
| ఆన్లైన్ ఎంపిక | అన్ని బ్యాంకులు ఆన్లైన్ను అందించవుసౌకర్యం FD తెరవడానికి | ఒకరు ఆన్లైన్లో ELSSని ప్రారంభించవచ్చు – మొత్తంగా లేదాSIP |
టాప్ ELSS మ్యూచువల్ ఫండ్స్ FY 22 - 23
Fund NAV Net Assets (Cr) 3 MO (%) 6 MO (%) 1 YR (%) 3 YR (%) 5 YR (%) 2025 (%) IDBI Equity Advantage Fund Growth ₹43.39
↑ 0.04 ₹485 9.7 15.1 16.9 20.8 10 Motilal Oswal Long Term Equity Fund Growth ₹54.6311
↑ 0.63 ₹4,862 1.9 12.3 5.2 20.2 16.3 -9.1 Baroda Pioneer ELSS 96 Growth ₹68.6676
↑ 0.33 ₹210 -6.1 -3.5 17.6 16.7 11.6 JM Tax Gain Fund Growth ₹51.8462
↑ 0.32 ₹232 9.8 9.5 8.3 15.8 14.8 2.5 BNP Paribas Long Term Equity Fund (ELSS) Growth ₹100.713
↑ 0.73 ₹897 4.8 3.9 6.6 15.3 12.4 4.8 Note: Returns up to 1 year are on absolute basis & more than 1 year are on CAGR basis. as on 28 Jul 23 Research Highlights & Commentary of 5 Funds showcased
Commentary IDBI Equity Advantage Fund Motilal Oswal Long Term Equity Fund Baroda Pioneer ELSS 96 JM Tax Gain Fund BNP Paribas Long Term Equity Fund (ELSS) Point 1 Lower mid AUM (₹485 Cr). Highest AUM (₹4,862 Cr). Bottom quartile AUM (₹210 Cr). Bottom quartile AUM (₹232 Cr). Upper mid AUM (₹897 Cr). Point 2 Established history (12+ yrs). Established history (11+ yrs). Established history (11+ yrs). Established history (18+ yrs). Oldest track record among peers (20 yrs). Point 3 Top rated. Not Rated. Not Rated. Rating: 3★ (upper mid). Rating: 3★ (lower mid). Point 4 Risk profile: Moderately High. Risk profile: Moderately High. Risk profile: Moderately High. Risk profile: Moderately High. Risk profile: Moderately High. Point 5 5Y return: 9.97% (bottom quartile). 5Y return: 16.33% (top quartile). 5Y return: 11.62% (bottom quartile). 5Y return: 14.83% (upper mid). 5Y return: 12.36% (lower mid). Point 6 3Y return: 20.84% (top quartile). 3Y return: 20.25% (upper mid). 3Y return: 16.70% (lower mid). 3Y return: 15.80% (bottom quartile). 3Y return: 15.34% (bottom quartile). Point 7 1Y return: 16.92% (upper mid). 1Y return: 5.16% (bottom quartile). 1Y return: 17.56% (top quartile). 1Y return: 8.30% (lower mid). 1Y return: 6.64% (bottom quartile). Point 8 Alpha: 1.78 (bottom quartile). Alpha: 6.27 (top quartile). Alpha: 5.69 (upper mid). Alpha: 4.31 (lower mid). Alpha: 2.78 (bottom quartile). Point 9 Sharpe: 1.21 (upper mid). Sharpe: 0.02 (lower mid). Sharpe: 2.51 (top quartile). Sharpe: -0.11 (bottom quartile). Sharpe: -0.15 (bottom quartile). Point 10 Information ratio: -1.13 (bottom quartile). Information ratio: 0.76 (top quartile). Information ratio: -0.09 (bottom quartile). Information ratio: 0.50 (lower mid). Information ratio: 0.58 (upper mid). IDBI Equity Advantage Fund
Motilal Oswal Long Term Equity Fund
Baroda Pioneer ELSS 96
JM Tax Gain Fund
BNP Paribas Long Term Equity Fund (ELSS)
* కింద AUM 100 - 15000 కోట్ల మధ్య ఉన్న & ఫండ్ వయస్సు 3 సంవత్సరాల పైన ఉన్న ఫండ్ల జాబితా క్రింద ఉంది. 3 సంవత్సరాల పనితీరు ఆధారంగా. The Scheme will seek to invest predominantly in a diversified portfolio of equity and equity related instruments with the objective to provide investors with opportunities for capital appreciation and income along with the benefit of income-tax deduction(under section 80C of the Income-tax Act, 1961) on their investments. Investments in this scheme would be subject to a statutory lock-in of 3 years from the date of allotment to be eligible for income-tax benefits under Section 80C. There can be no assurance that the investment objective under the scheme will be realized. Below is the key information for IDBI Equity Advantage Fund Returns up to 1 year are on (Erstwhile Motilal Oswal MOSt Focused Long Term Fund) The investment objective of the Scheme is to generate long-term capital appreciation from a diversified portfolio of predominantly equity and equity related instruments. However, there can be no assurance or guarantee that the investment objective of the Scheme would be achieved. Research Highlights for Motilal Oswal Long Term Equity Fund Below is the key information for Motilal Oswal Long Term Equity Fund Returns up to 1 year are on The main objective of the scheme is to provide the investor long term capital growth as also tax benefit under section 80C of the Income Tax Act, 1961. Research Highlights for Baroda Pioneer ELSS 96 Below is the key information for Baroda Pioneer ELSS 96 Returns up to 1 year are on The investment objective is to generate long-term capital growth from a diversified and actively managed portfolio of equity and equity related securities and to enable investors a deduction from total income, as permitted under the Income Tax Act, 1961 from time to time. However, there can be no assurance that the investment objectives of the Scheme will be realized. The Scheme does not guarantee/indicate any returns. Research Highlights for JM Tax Gain Fund Below is the key information for JM Tax Gain Fund Returns up to 1 year are on The investment objective of the Scheme is to generate long-term capital growth from a diversified and actively managed portfolio of equity and equity related securities along with income tax rebate, as may be prevalent fromtime to time. However, there can be no assurance that the investment objective of the Scheme will be achieved. The Scheme does not guarantee / indicate any returns. Research Highlights for BNP Paribas Long Term Equity Fund (ELSS) Below is the key information for BNP Paribas Long Term Equity Fund (ELSS) Returns up to 1 year are on 1. IDBI Equity Advantage Fund
IDBI Equity Advantage Fund
Growth Launch Date 10 Sep 13 NAV (28 Jul 23) ₹43.39 ↑ 0.04 (0.09 %) Net Assets (Cr) ₹485 on 30 Jun 23 Category Equity - ELSS AMC IDBI Asset Management Limited Rating ☆☆☆ Risk Moderately High Expense Ratio 2.39 Sharpe Ratio 1.21 Information Ratio -1.13 Alpha Ratio 1.78 Min Investment 500 Min SIP Investment 500 Exit Load NIL Growth of 10,000 investment over the years.
Date Value Returns for IDBI Equity Advantage Fund
absolute basis & more than 1 year are on CAGR (Compound Annual Growth Rate) basis. as on 28 Jul 23 Duration Returns 1 Month 3.1% 3 Month 9.7% 6 Month 15.1% 1 Year 16.9% 3 Year 20.8% 5 Year 10% 10 Year 15 Year Since launch 16% Historical performance (Yearly) on absolute basis
Year Returns 2025 2024 2023 2022 2021 2020 2019 2018 2017 2016 Fund Manager information for IDBI Equity Advantage Fund
Name Since Tenure Data below for IDBI Equity Advantage Fund as on 30 Jun 23
Equity Sector Allocation
Sector Value Asset Allocation
Asset Class Value Top Securities Holdings / Portfolio
Name Holding Value Quantity 2. Motilal Oswal Long Term Equity Fund
Motilal Oswal Long Term Equity Fund
Growth Launch Date 21 Jan 15 NAV (31 Jul 26) ₹54.6311 ↑ 0.63 (1.17 %) Net Assets (Cr) ₹4,862 on 30 Jun 26 Category Equity - ELSS AMC Motilal Oswal Asset Management Co. Ltd Rating Risk Moderately High Expense Ratio 1.65 Sharpe Ratio 0.02 Information Ratio 0.76 Alpha Ratio 6.27 Min Investment 500 Min SIP Investment 500 Exit Load NIL Growth of 10,000 investment over the years.
Date Value 31 Jul 21 ₹10,000 31 Jul 22 ₹9,920 31 Jul 23 ₹12,253 31 Jul 24 ₹19,527 31 Jul 25 ₹20,258 Returns for Motilal Oswal Long Term Equity Fund
absolute basis & more than 1 year are on CAGR (Compound Annual Growth Rate) basis. as on 28 Jul 23 Duration Returns 1 Month -1.8% 3 Month 1.9% 6 Month 12.3% 1 Year 5.2% 3 Year 20.2% 5 Year 16.3% 10 Year 15 Year Since launch 15.9% Historical performance (Yearly) on absolute basis
Year Returns 2025 -9.1% 2024 47.7% 2023 37% 2022 1.8% 2021 32.1% 2020 8.8% 2019 13.2% 2018 -8.7% 2017 44% 2016 12.5% Fund Manager information for Motilal Oswal Long Term Equity Fund
Name Since Tenure Ajay Khandelwal 11 Dec 23 2.55 Yr. Ankit Agarwal 16 Mar 26 0.29 Yr. Rakesh Shetty 22 Nov 22 3.61 Yr. Atul Mehra 1 Oct 24 1.75 Yr. Data below for Motilal Oswal Long Term Equity Fund as on 30 Jun 26
Equity Sector Allocation
Sector Value Financial Services 25.8% Industrials 23.55% Consumer Cyclical 16.57% Basic Materials 13.61% Technology 13.23% Health Care 4.78% Asset Allocation
Asset Class Value Cash 2.46% Equity 97.54% Top Securities Holdings / Portfolio
Name Holding Value Quantity Multi Commodity Exchange of India Ltd (Financial Services)
Equity, Since 29 Feb 24 | MCX7% ₹337 Cr 1,140,862
↓ -55,178 OneSource Specialty Pharma Ltd (Healthcare)
Equity, Since 31 Jan 25 | ONESOURCE5% ₹223 Cr 1,221,228 Zen Technologies Ltd (Industrials)
Equity, Since 31 Dec 24 | ZENTEC4% ₹203 Cr 1,218,528 Muthoot Finance Ltd (Financial Services)
Equity, Since 30 Jun 25 | MUTHOOTFIN4% ₹197 Cr 588,318
↑ 41,444 Ather Energy Ltd (Consumer Cyclical)
Equity, Since 31 Oct 25 | ATHERENERG4% ₹192 Cr 1,990,789
↓ -310,680 Waaree Energies Ltd (Technology)
Equity, Since 31 Oct 24 | WAAREEENER4% ₹188 Cr 600,000
↓ -27,718 Jain Resource Recycling Ltd (Basic Materials)
Equity, Since 31 Oct 25 | JAINREC4% ₹187 Cr 5,000,000
↓ -11,074 PTC Industries Ltd (Industrials)
Equity, Since 30 Sep 24 | 5390064% ₹186 Cr 115,181 Suzlon Energy Ltd (Industrials)
Equity, Since 31 Jan 24 | SUZLON4% ₹185 Cr 32,483,092 Apar Industries Ltd (Industrials)
Equity, Since 31 Dec 23 | APARINDS4% ₹176 Cr 134,000
↓ -48,754 3. Baroda Pioneer ELSS 96
Baroda Pioneer ELSS 96
Growth Launch Date 2 Mar 15 NAV (11 Mar 22) ₹68.6676 ↑ 0.33 (0.48 %) Net Assets (Cr) ₹210 on 31 Jan 22 Category Equity - ELSS AMC Baroda Pioneer Asset Management Co. Ltd. Rating Risk Moderately High Expense Ratio 2.55 Sharpe Ratio 2.51 Information Ratio -0.09 Alpha Ratio 5.69 Min Investment 500 Min SIP Investment 500 Exit Load NIL Growth of 10,000 investment over the years.
Date Value Returns for Baroda Pioneer ELSS 96
absolute basis & more than 1 year are on CAGR (Compound Annual Growth Rate) basis. as on 28 Jul 23 Duration Returns 1 Month -3.9% 3 Month -6.1% 6 Month -3.5% 1 Year 17.6% 3 Year 16.7% 5 Year 11.6% 10 Year 15 Year Since launch 8.4% Historical performance (Yearly) on absolute basis
Year Returns 2025 2024 2023 2022 2021 2020 2019 2018 2017 2016 Fund Manager information for Baroda Pioneer ELSS 96
Name Since Tenure Data below for Baroda Pioneer ELSS 96 as on 31 Jan 22
Equity Sector Allocation
Sector Value Asset Allocation
Asset Class Value Top Securities Holdings / Portfolio
Name Holding Value Quantity 4. JM Tax Gain Fund
JM Tax Gain Fund
Growth Launch Date 31 Mar 08 NAV (31 Jul 26) ₹51.8462 ↑ 0.32 (0.61 %) Net Assets (Cr) ₹232 on 30 Jun 26 Category Equity - ELSS AMC JM Financial Asset Management Limited Rating ☆☆☆ Risk Moderately High Expense Ratio 2.37 Sharpe Ratio -0.11 Information Ratio 0.5 Alpha Ratio 4.31 Min Investment 500 Min SIP Investment 500 Exit Load NIL Growth of 10,000 investment over the years.
Date Value 31 Jul 21 ₹10,000 31 Jul 22 ₹10,560 31 Jul 23 ₹12,857 31 Jul 24 ₹19,571 31 Jul 25 ₹18,435 Returns for JM Tax Gain Fund
absolute basis & more than 1 year are on CAGR (Compound Annual Growth Rate) basis. as on 28 Jul 23 Duration Returns 1 Month 4% 3 Month 9.8% 6 Month 9.5% 1 Year 8.3% 3 Year 15.8% 5 Year 14.8% 10 Year 15 Year Since launch 9.4% Historical performance (Yearly) on absolute basis
Year Returns 2025 2.5% 2024 29% 2023 30.9% 2022 0.5% 2021 32.2% 2020 18.3% 2019 14.9% 2018 -4.6% 2017 42.6% 2016 5.2% Fund Manager information for JM Tax Gain Fund
Name Since Tenure Satish Ramanathan 1 Oct 24 1.75 Yr. Asit Bhandarkar 31 Dec 21 4.5 Yr. Ruchi Fozdar 4 Oct 24 1.74 Yr. Deepak Gupta 11 Apr 25 1.22 Yr. Data below for JM Tax Gain Fund as on 30 Jun 26
Equity Sector Allocation
Sector Value Financial Services 27.9% Consumer Cyclical 17.25% Technology 11.32% Industrials 9.8% Basic Materials 8.63% Health Care 6.75% Consumer Defensive 3.63% Real Estate 3.5% Energy 3.16% Utility 2.72% Communication Services 2.7% Asset Allocation
Asset Class Value Cash 2.63% Equity 97.37% Top Securities Holdings / Portfolio
Name Holding Value Quantity HDFC Bank Ltd (Financial Services)
Equity, Since 31 Dec 11 | HDFCBANK3% ₹7 Cr 98,262 Reliance Industries Ltd (Energy)
Equity, Since 30 Jun 25 | RELIANCE3% ₹7 Cr 53,400 Syrma SGS Technology Ltd (Technology)
Equity, Since 31 May 25 | SYRMA3% ₹6 Cr 59,457 ICICI Bank Ltd (Financial Services)
Equity, Since 31 Mar 22 | ICICIBANK3% ₹6 Cr 48,500 Larsen & Toubro Ltd (Industrials)
Equity, Since 30 Nov 10 | LT3% ₹6 Cr 14,947 Adani Power Ltd (Utilities)
Equity, Since 31 Mar 26 | ADANIPOWER3% ₹6 Cr 249,000 Bharti Airtel Ltd (Communication Services)
Equity, Since 31 Mar 24 | BHARTIARTL3% ₹6 Cr 32,950 Karur Vysya Bank Ltd (Financial Services)
Equity, Since 30 Apr 25 | KARURVYSYA3% ₹6 Cr 199,000 Lupin Ltd (Healthcare)
Equity, Since 31 May 25 | LUPIN3% ₹6 Cr 25,000 Polycab India Ltd (Industrials)
Equity, Since 31 Jul 25 | POLYCAB3% ₹6 Cr 5,900 5. BNP Paribas Long Term Equity Fund (ELSS)
BNP Paribas Long Term Equity Fund (ELSS)
Growth Launch Date 5 Jan 06 NAV (31 Jul 26) ₹100.713 ↑ 0.73 (0.73 %) Net Assets (Cr) ₹897 on 30 Jun 26 Category Equity - ELSS AMC BNP Paribas Asset Mgmt India Pvt. Ltd Rating ☆☆☆ Risk Moderately High Expense Ratio 2.21 Sharpe Ratio -0.15 Information Ratio 0.58 Alpha Ratio 2.78 Min Investment 500 Min SIP Investment 500 Exit Load NIL Growth of 10,000 investment over the years.
Date Value 31 Jul 21 ₹10,000 31 Jul 22 ₹10,148 31 Jul 23 ₹11,674 31 Jul 24 ₹16,605 31 Jul 25 ₹16,796 Returns for BNP Paribas Long Term Equity Fund (ELSS)
absolute basis & more than 1 year are on CAGR (Compound Annual Growth Rate) basis. as on 28 Jul 23 Duration Returns 1 Month 2.9% 3 Month 4.8% 6 Month 3.9% 1 Year 6.6% 3 Year 15.3% 5 Year 12.4% 10 Year 15 Year Since launch 11.9% Historical performance (Yearly) on absolute basis
Year Returns 2025 4.8% 2024 23.6% 2023 31.3% 2022 -2.1% 2021 23.6% 2020 17.8% 2019 14.3% 2018 -9.3% 2017 42.3% 2016 -6.6% Fund Manager information for BNP Paribas Long Term Equity Fund (ELSS)
Name Since Tenure Sanjay Chawla 14 Mar 22 4.3 Yr. Yash Mehta 1 May 26 0.16 Yr. Data below for BNP Paribas Long Term Equity Fund (ELSS) as on 30 Jun 26
Equity Sector Allocation
Sector Value Financial Services 28.78% Industrials 15.65% Consumer Cyclical 14.19% Basic Materials 8.98% Technology 7.08% Health Care 6.37% Energy 5.79% Consumer Defensive 4.17% Communication Services 3.01% Utility 1.38% Asset Allocation
Asset Class Value Cash 4.57% Equity 95.4% Top Securities Holdings / Portfolio
Name Holding Value Quantity HDFC Bank Ltd (Financial Services)
Equity, Since 31 Oct 08 | HDFCBANK5% ₹41 Cr 550,000
↓ -106,320 Reliance Industries Ltd (Energy)
Equity, Since 31 Oct 18 | RELIANCE4% ₹37 Cr 281,800 Hitachi Energy India Ltd Ordinary Shares (Industrials)
Equity, Since 31 Aug 23 | POWERINDIA4% ₹34 Cr 8,766 State Bank of India (Financial Services)
Equity, Since 31 Mar 22 | SBIN4% ₹32 Cr 330,000
↑ 52,000 ICICI Bank Ltd (Financial Services)
Equity, Since 31 Oct 12 | ICICIBANK4% ₹31 Cr 250,000
↓ -79,900 Bharat Heavy Electricals Ltd (Industrials)
Equity, Since 30 Nov 24 | BHEL3% ₹29 Cr 701,626
↓ -119,754 Bharti Airtel Ltd (Communication Services)
Equity, Since 31 May 19 | BHARTIARTL3% ₹27 Cr 144,966 Larsen & Toubro Ltd (Industrials)
Equity, Since 30 Apr 20 | LT3% ₹26 Cr 65,000
↑ 5,000 Hindalco Industries Ltd (Basic Materials)
Equity, Since 28 Feb 25 | HINDALCO3% ₹25 Cr 220,000 Navin Fluorine International Ltd (Basic Materials)
Equity, Since 31 Jul 24 | NAVINFLUOR3% ₹23 Cr 31,685
మీరు ELSS లేదా పన్ను ఆదా FDలలో పెట్టుబడి పెట్టాలా?
కొత్త పెట్టుబడి వెంచర్లలోకి ప్రవేశించే ముందు, ప్రజలు చాలా విషయాలను పరిగణలోకి తీసుకుంటారు. వయస్సు, పెట్టుబడి హోరిజోన్ మరియుఅపాయకరమైన ఆకలి అనేవి కొన్ని ముఖ్యమైన కారకాలు. సంపద పెరుగుదల మరియు పన్ను ప్రయోజనాల ద్వంద్వ ప్రయోజనాలను కోరుకునే వ్యక్తులు ELSSని ఇష్టపడతారు. ఉదాహరణకు, సుదీర్ఘ పెట్టుబడి హోరిజోన్ మరియు రిస్క్ ఎక్కువ ఉన్న కొత్త పెట్టుబడిదారులు ELSSని సరైన ఎంపికగా కనుగొంటారు. ప్రజలు దగ్గరవుతున్నారుపదవీ విరమణ పన్ను ఆదా చేసే FDలలో పెట్టుబడి పెట్టవచ్చు, ఎందుకంటే అవి తక్కువ నష్టాలను కలిగి ఉంటాయి మరియు దీర్ఘకాలిక (కనీసం 5 సంవత్సరాలు లేదా అంతకంటే ఎక్కువ) రాబడిని పొందుతాయి.
ELSS ఆన్లైన్లో ఎలా పెట్టుబడి పెట్టాలి?
Fincash.comలో జీవితకాలం కోసం ఉచిత పెట్టుబడి ఖాతాను తెరవండి.
మీ రిజిస్ట్రేషన్ మరియు KYC ప్రక్రియను పూర్తి చేయండి
పత్రాలను అప్లోడ్ చేయండి (పాన్, ఆధార్, మొదలైనవి).మరియు, మీరు పెట్టుబడి పెట్టడానికి సిద్ధంగా ఉన్నారు!
ఇక్కడ అందించిన సమాచారం ఖచ్చితమైనదని నిర్ధారించడానికి అన్ని ప్రయత్నాలు చేయబడ్డాయి. అయినప్పటికీ, డేటా యొక్క ఖచ్చితత్వానికి సంబంధించి ఎటువంటి హామీలు ఇవ్వబడవు. దయచేసి ఏదైనా పెట్టుబడి పెట్టే ముందు పథకం సమాచార పత్రంతో ధృవీకరించండి.


AMFI Registration No. 112358 | CIN: U74999MH2016PTC282153
Shepard Technologies Pvt. Ltd. (with ARN code 112358) makes no warranties or representations, express or implied, on products offered through the platform. It accepts no liability for any damages or losses, however caused, in connection with the use of, or on the reliance of its product or related services. Terms and conditions of the website are applicable.
©2026 Shepard Technologies Private Limited. All Rights Reserved
Research Highlights for IDBI Equity Advantage Fund