6 بہترین پرفارمنگ ٹیکس سیونگ میوچل فنڈز 2022
ٹیکس کے موسم کے ساتھ، سرمایہ کار جو سرمایہ کاری کرتے ہیں۔ای ایل ایس ایس ہمیشہ ان فنڈز کو دیکھیں جو کہ میں بہترین کارکردگی کا مظاہرہ کر رہے ہیں۔مارکیٹ. چونکہ، بہت سارے سرمایہ کاروں کو بہت سے لوگوں میں سے ایک فنڈ کا انتخاب کرنا مشکل ہوتا ہے، اس لیے ہم یہاں ELSS زمرے میں کچھ بہترین اداکاروں کا مشورہ دینے کے لیے حاضر ہیں۔
سرمایہ کار ان فنڈز میں سرمایہ کاری کر سکتے ہیں اور اس کے تحت ہر سال 1.5 لاکھ روپے تک کی بچت کر سکتے ہیں۔سیکشن 80 سی کیانکم ٹیکس ایکٹ 1961۔ ELSS اسکیموں میں کم از کم 3 سال کا لاک ان پیریڈ ہوتا ہے۔ ہماری تجویز کردہ بہترین کارکردگی کے ساتھ ٹیکس کی بچتباہمی چندہ AUM جیسے کچھ اہم پیرامیٹرز کو انجام دے کر احتیاط سے شارٹ لسٹ کیا گیا ہے،نہیں ہیں، ماضی کی کارکردگی، وغیرہ
اس طرح، سرمایہ کار آسانی سے اپنی ٹیکس بچت کی منصوبہ بندی کر سکتے ہیں۔سرمایہ کاری ان فنڈز میں.
Talk to our investment specialist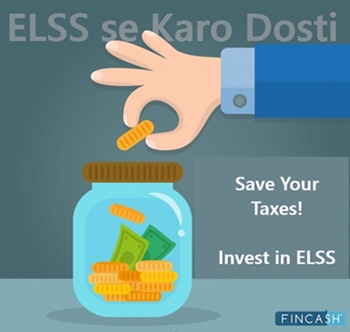
بہترین پرفارمنگ ٹیکس بچانے والے میوچل فنڈز
To provide medium to long term capital gains along with income tax relief to its Unitholders, while at all times emphasising the importance of capital appreciation.. Below is the key information for Tata India Tax Savings Fund Returns up to 1 year are on The investment objective of the Scheme is to seek to generate long term capital growth from a diversified portfolio of predominantly equity and equity related securities. There can be no assurance that the investment objective of the scheme will be realised. Research Highlights for Bandhan Tax Advantage (ELSS) Fund Below is the key information for Bandhan Tax Advantage (ELSS) Fund Returns up to 1 year are on To generate long term capital appreciation from a portfolio that is predominantly in equity and equity related instruments Research Highlights for HDFC Long Term Advantage Fund Below is the key information for HDFC Long Term Advantage Fund Returns up to 1 year are on The Scheme seeks to generate long-term capital growth from a diversified portfolio of predominantly equity and equity-related securities across all market capitalisations. The Scheme is in the nature of diversified multi-cap fund. The Scheme is not providing any assured or guaranteed returns.(There can be no assurance that the investment objectives of the Scheme will be realized.) Research Highlights for BOI AXA Tax Advantage Fund Below is the key information for BOI AXA Tax Advantage Fund Returns up to 1 year are on The investment objective of the scheme is to generate longterm capital appreciation from a diversified portfolio of equity and equity related securities and enable investors to avail the income tax rebate, as permitted from time to time. Research Highlights for Kotak Tax Saver Fund Below is the key information for Kotak Tax Saver Fund Returns up to 1 year are on The investment objective of the Scheme is to generate long term capital growth from a diversified portfolio of predominantly equity and equity-related securities. Research Highlights for Invesco India Tax Plan Below is the key information for Invesco India Tax Plan Returns up to 1 year are on Fund NAV Net Assets (Cr) 3 MO (%) 6 MO (%) 1 YR (%) 3 YR (%) 5 YR (%) 2025 (%) Tata India Tax Savings Fund Growth ₹46.8846
↑ 0.31 ₹4,597 4.4 5.1 6.6 12.4 13 4.9 Bandhan Tax Advantage (ELSS) Fund Growth ₹155.975
↑ 0.18 ₹6,911 3.6 1.5 3.8 9.9 12 8 HDFC Long Term Advantage Fund Growth ₹595.168
↑ 0.28 ₹1,318 1.2 15.4 35.5 20.6 17.4 BOI AXA Tax Advantage Fund Growth ₹163.37
↑ 0.91 ₹1,406 0.3 3.1 2.8 12.4 11.5 -3.5 Kotak Tax Saver Fund Growth ₹117.451
↑ 0.33 ₹6,197 4.7 2.2 1.8 11.1 12 1.8 Invesco India Tax Plan Growth ₹125.19
↑ 0.58 ₹2,646 7.9 5.2 0.4 12.2 10.2 -2.8 Note: Returns up to 1 year are on absolute basis & more than 1 year are on CAGR basis. as on 31 Jul 26 Research Highlights & Commentary of 6 Funds showcased
Commentary Tata India Tax Savings Fund Bandhan Tax Advantage (ELSS) Fund HDFC Long Term Advantage Fund BOI AXA Tax Advantage Fund Kotak Tax Saver Fund Invesco India Tax Plan Point 1 Upper mid AUM (₹4,597 Cr). Highest AUM (₹6,911 Cr). Bottom quartile AUM (₹1,318 Cr). Bottom quartile AUM (₹1,406 Cr). Upper mid AUM (₹6,197 Cr). Lower mid AUM (₹2,646 Cr). Point 2 Established history (11+ yrs). Established history (17+ yrs). Oldest track record among peers (25 yrs). Established history (17+ yrs). Established history (20+ yrs). Established history (19+ yrs). Point 3 Top rated. Rating: 5★ (upper mid). Rating: 3★ (upper mid). Rating: 3★ (lower mid). Rating: 3★ (bottom quartile). Rating: 3★ (bottom quartile). Point 4 Risk profile: Moderately High. Risk profile: Moderately High. Risk profile: Moderately High. Risk profile: Moderately High. Risk profile: Moderately High. Risk profile: Moderately High. Point 5 5Y return: 13.00% (upper mid). 5Y return: 12.04% (upper mid). 5Y return: 17.39% (top quartile). 5Y return: 11.51% (bottom quartile). 5Y return: 12.02% (lower mid). 5Y return: 10.17% (bottom quartile). Point 6 3Y return: 12.37% (upper mid). 3Y return: 9.90% (bottom quartile). 3Y return: 20.64% (top quartile). 3Y return: 12.42% (upper mid). 3Y return: 11.05% (bottom quartile). 3Y return: 12.19% (lower mid). Point 7 1Y return: 6.56% (upper mid). 1Y return: 3.77% (upper mid). 1Y return: 35.51% (top quartile). 1Y return: 2.77% (lower mid). 1Y return: 1.77% (bottom quartile). 1Y return: 0.45% (bottom quartile). Point 8 Alpha: 4.23 (top quartile). Alpha: 0.89 (lower mid). Alpha: 1.75 (upper mid). Alpha: 1.82 (upper mid). Alpha: -1.55 (bottom quartile). Alpha: -2.43 (bottom quartile). Point 9 Sharpe: -0.09 (upper mid). Sharpe: -0.29 (lower mid). Sharpe: 2.27 (top quartile). Sharpe: -0.22 (upper mid). Sharpe: -0.41 (bottom quartile). Sharpe: -0.46 (bottom quartile). Point 10 Information ratio: 0.22 (upper mid). Information ratio: -0.51 (bottom quartile). Information ratio: -0.15 (lower mid). Information ratio: 0.32 (top quartile). Information ratio: -0.31 (bottom quartile). Information ratio: -0.05 (upper mid). Tata India Tax Savings Fund
Bandhan Tax Advantage (ELSS) Fund
HDFC Long Term Advantage Fund
BOI AXA Tax Advantage Fund
Kotak Tax Saver Fund
Invesco India Tax Plan
1. Tata India Tax Savings Fund
Tata India Tax Savings Fund
Growth Launch Date 13 Oct 14 NAV (31 Jul 26) ₹46.8846 ↑ 0.31 (0.66 %) Net Assets (Cr) ₹4,597 on 30 Jun 26 Category Equity - ELSS AMC Tata Asset Management Limited Rating ☆☆☆☆☆ Risk Moderately High Expense Ratio 1.83 Sharpe Ratio -0.09 Information Ratio 0.22 Alpha Ratio 4.23 Min Investment 500 Min SIP Investment 500 Exit Load NIL Growth of 10,000 investment over the years.
Date Value 31 Jul 21 ₹10,000 31 Jul 22 ₹10,953 31 Jul 23 ₹12,983 31 Jul 24 ₹17,490 31 Jul 25 ₹17,289 Returns for Tata India Tax Savings Fund
absolute basis & more than 1 year are on CAGR (Compound Annual Growth Rate) basis. as on 31 Jul 26 Duration Returns 1 Month 1.9% 3 Month 4.4% 6 Month 5.1% 1 Year 6.6% 3 Year 12.4% 5 Year 13% 10 Year 15 Year Since launch 14% Historical performance (Yearly) on absolute basis
Year Returns 2025 4.9% 2024 19.5% 2023 24% 2022 5.9% 2021 30.4% 2020 11.9% 2019 13.6% 2018 -8.4% 2017 46% 2016 2.1% Fund Manager information for Tata India Tax Savings Fund
Name Since Tenure Sailesh Jain 16 Dec 21 4.54 Yr. Data below for Tata India Tax Savings Fund as on 30 Jun 26
Equity Sector Allocation
Sector Value Financial Services 33.72% Industrials 16.32% Consumer Cyclical 12.13% Health Care 6.53% Communication Services 5.78% Basic Materials 5.59% Energy 5.44% Technology 4.8% Utility 2.96% Real Estate 1.91% Consumer Defensive 1.29% Asset Allocation
Asset Class Value Cash 2.65% Equity 97.35% Top Securities Holdings / Portfolio
Name Holding Value Quantity Bharti Airtel Ltd (Communication Services)
Equity, Since 31 Mar 26 | BHARTIARTL6% ₹261 Cr 1,426,428 ICICI Bank Ltd (Financial Services)
Equity, Since 30 Nov 16 | ICICIBANK6% ₹258 Cr 2,050,000 HDFC Bank Ltd (Financial Services)
Equity, Since 28 Feb 10 | HDFCBANK6% ₹249 Cr 3,350,000 State Bank of India (Financial Services)
Equity, Since 30 Nov 18 | SBIN4% ₹197 Cr 2,040,000 Reliance Industries Ltd (Energy)
Equity, Since 31 Jan 18 | RELIANCE4% ₹178 Cr 1,350,000 Samvardhana Motherson International Ltd (Consumer Cyclical)
Equity, Since 30 Nov 22 | MOTHERSON3% ₹144 Cr 9,850,000 Larsen & Toubro Ltd (Industrials)
Equity, Since 30 Nov 16 | LT3% ₹144 Cr 352,147 Cummins India Ltd (Industrials)
Equity, Since 31 Dec 20 | CUMMINSIND3% ₹135 Cr 230,000 NTPC Ltd (Utilities)
Equity, Since 30 Jun 21 | NTPC3% ₹134 Cr 3,451,000 PB Fintech Ltd (Financial Services)
Equity, Since 28 Feb 26 | 5433903% ₹113 Cr 664,850 2. Bandhan Tax Advantage (ELSS) Fund
Bandhan Tax Advantage (ELSS) Fund
Growth Launch Date 26 Dec 08 NAV (31 Jul 26) ₹155.975 ↑ 0.18 (0.12 %) Net Assets (Cr) ₹6,911 on 30 Jun 26 Category Equity - ELSS AMC IDFC Asset Management Company Limited Rating ☆☆☆☆☆ Risk Moderately High Expense Ratio 1.74 Sharpe Ratio -0.29 Information Ratio -0.51 Alpha Ratio 0.89 Min Investment 500 Min SIP Investment 500 Exit Load NIL Growth of 10,000 investment over the years.
Date Value 31 Jul 21 ₹10,000 31 Jul 22 ₹10,756 31 Jul 23 ₹13,299 31 Jul 24 ₹17,741 31 Jul 25 ₹17,013 Returns for Bandhan Tax Advantage (ELSS) Fund
absolute basis & more than 1 year are on CAGR (Compound Annual Growth Rate) basis. as on 31 Jul 26 Duration Returns 1 Month 1.8% 3 Month 3.6% 6 Month 1.5% 1 Year 3.8% 3 Year 9.9% 5 Year 12% 10 Year 15 Year Since launch 16.9% Historical performance (Yearly) on absolute basis
Year Returns 2025 8% 2024 13.1% 2023 28.3% 2022 4.2% 2021 49.2% 2020 18.7% 2019 1.9% 2018 -9.4% 2017 53.4% 2016 0.4% Fund Manager information for Bandhan Tax Advantage (ELSS) Fund
Name Since Tenure Daylynn Pinto 20 Oct 16 9.7 Yr. Ritika Behera 7 Oct 23 2.73 Yr. Gaurav Satra 10 Jun 24 2.06 Yr. Data below for Bandhan Tax Advantage (ELSS) Fund as on 30 Jun 26
Equity Sector Allocation
Sector Value Financial Services 32.84% Technology 9.75% Consumer Cyclical 8.93% Consumer Defensive 8.47% Energy 7.82% Basic Materials 6.81% Health Care 6.02% Industrials 5.71% Communication Services 2.57% Real Estate 2.15% Utility 1.82% Asset Allocation
Asset Class Value Cash 6.37% Equity 93.63% Top Securities Holdings / Portfolio
Name Holding Value Quantity HDFC Bank Ltd (Financial Services)
Equity, Since 30 Sep 14 | HDFCBANK7% ₹499 Cr 6,700,000
↑ 400,000 Reliance Industries Ltd (Energy)
Equity, Since 31 Jul 18 | RELIANCE6% ₹436 Cr 3,300,000 Kotak Mahindra Bank Ltd (Financial Services)
Equity, Since 31 Jul 23 | KOTAKBANK5% ₹346 Cr 9,000,000
↑ 500,000 ICICI Bank Ltd (Financial Services)
Equity, Since 31 May 16 | ICICIBANK5% ₹339 Cr 2,700,000 Tata Consultancy Services Ltd (Technology)
Equity, Since 31 Oct 21 | TCS4% ₹260 Cr 1,150,000
↑ 50,000 Axis Bank Ltd (Financial Services)
Equity, Since 30 Apr 21 | AXISBANK3% ₹235 Cr 1,825,000 Sterlite Technologies Ltd (Technology)
Equity, Since 30 Apr 24 | STLTECH3% ₹214 Cr 4,000,000
↓ -2,500,000 Infosys Ltd (Technology)
Equity, Since 31 Jul 15 | INFY3% ₹186 Cr 1,600,000 Maruti Suzuki India Ltd (Consumer Cyclical)
Equity, Since 30 Sep 23 | MARUTI3% ₹177 Cr 135,000
↑ 10,000 Bharti Airtel Ltd (Communication Services)
Equity, Since 31 Jan 20 | BHARTIARTL3% ₹174 Cr 950,000
↑ 100,000 3. HDFC Long Term Advantage Fund
HDFC Long Term Advantage Fund
Growth Launch Date 2 Jan 01 NAV (14 Jan 22) ₹595.168 ↑ 0.28 (0.05 %) Net Assets (Cr) ₹1,318 on 30 Nov 21 Category Equity - ELSS AMC HDFC Asset Management Company Limited Rating ☆☆☆ Risk Moderately High Expense Ratio 2.25 Sharpe Ratio 2.27 Information Ratio -0.15 Alpha Ratio 1.75 Min Investment 500 Min SIP Investment 500 Exit Load NIL Growth of 10,000 investment over the years.
Date Value
Purchase not allowed Returns for HDFC Long Term Advantage Fund
absolute basis & more than 1 year are on CAGR (Compound Annual Growth Rate) basis. as on 31 Jul 26 Duration Returns 1 Month 4.4% 3 Month 1.2% 6 Month 15.4% 1 Year 35.5% 3 Year 20.6% 5 Year 17.4% 10 Year 15 Year Since launch 21.4% Historical performance (Yearly) on absolute basis
Year Returns 2025 2024 2023 2022 2021 2020 2019 2018 2017 2016 Fund Manager information for HDFC Long Term Advantage Fund
Name Since Tenure Data below for HDFC Long Term Advantage Fund as on 30 Nov 21
Equity Sector Allocation
Sector Value Asset Allocation
Asset Class Value Top Securities Holdings / Portfolio
Name Holding Value Quantity 4. BOI AXA Tax Advantage Fund
BOI AXA Tax Advantage Fund
Growth Launch Date 25 Feb 09 NAV (31 Jul 26) ₹163.37 ↑ 0.91 (0.56 %) Net Assets (Cr) ₹1,406 on 30 Jun 26 Category Equity - ELSS AMC BOI AXA Investment Mngrs Private Ltd Rating ☆☆☆ Risk Moderately High Expense Ratio 2.09 Sharpe Ratio -0.22 Information Ratio 0.32 Alpha Ratio 1.82 Min Investment 500 Min SIP Investment 500 Exit Load NIL Growth of 10,000 investment over the years.
Date Value 31 Jul 21 ₹10,000 31 Jul 22 ₹9,927 31 Jul 23 ₹12,134 31 Jul 24 ₹18,689 31 Jul 25 ₹16,778 Returns for BOI AXA Tax Advantage Fund
absolute basis & more than 1 year are on CAGR (Compound Annual Growth Rate) basis. as on 31 Jul 26 Duration Returns 1 Month -0.4% 3 Month 0.3% 6 Month 3.1% 1 Year 2.8% 3 Year 12.4% 5 Year 11.5% 10 Year 15 Year Since launch 17.4% Historical performance (Yearly) on absolute basis
Year Returns 2025 -3.5% 2024 21.6% 2023 34.8% 2022 -1.3% 2021 41.5% 2020 31.2% 2019 14.6% 2018 -16.3% 2017 57.7% 2016 -1.2% Fund Manager information for BOI AXA Tax Advantage Fund
Name Since Tenure Alok Singh 27 Apr 22 4.18 Yr. Data below for BOI AXA Tax Advantage Fund as on 30 Jun 26
Equity Sector Allocation
Sector Value Financial Services 24.72% Industrials 19.59% Basic Materials 16.92% Consumer Cyclical 9.64% Consumer Defensive 6.17% Utility 5.36% Technology 3.25% Communication Services 3.11% Health Care 2.76% Energy 2.15% Real Estate 0.11% Asset Allocation
Asset Class Value Cash 3.61% Equity 96.27% Debt 0.12% Top Securities Holdings / Portfolio
Name Holding Value Quantity State Bank of India (Financial Services)
Equity, Since 31 Oct 21 | SBIN4% ₹56 Cr 584,286 Hindustan Aeronautics Ltd Ordinary Shares (Industrials)
Equity, Since 31 Jul 23 | HAL3% ₹47 Cr 110,000
↓ -4,000 Acutaas Chemicals Ltd (Basic Materials)
Equity, Since 31 May 24 | 5433493% ₹45 Cr 142,759 Bharti Airtel Ltd (Communication Services)
Equity, Since 30 Sep 24 | BHARTIARTL3% ₹43 Cr 235,000 ICICI Bank Ltd (Financial Services)
Equity, Since 31 Oct 18 | ICICIBANK3% ₹42 Cr 335,000 Adani Ports & Special Economic Zone Ltd (Industrials)
Equity, Since 30 Apr 25 | ADANIPORTS3% ₹40 Cr 224,000 NTPC Ltd (Utilities)
Equity, Since 30 Apr 22 | NTPC3% ₹40 Cr 1,041,000 HDFC Bank Ltd (Financial Services)
Equity, Since 31 Dec 10 | HDFCBANK3% ₹39 Cr 530,000
↑ 20,000 Power Finance Corp Ltd (Financial Services)
Equity, Since 28 Feb 26 | PFC3% ₹38 Cr 885,000 UNO Minda Ltd (Consumer Cyclical)
Equity, Since 31 Aug 22 | UNOMINDA3% ₹36 Cr 330,439 5. Kotak Tax Saver Fund
Kotak Tax Saver Fund
Growth Launch Date 23 Nov 05 NAV (31 Jul 26) ₹117.451 ↑ 0.33 (0.28 %) Net Assets (Cr) ₹6,197 on 30 Jun 26 Category Equity - ELSS AMC Kotak Mahindra Asset Management Co Ltd Rating ☆☆☆ Risk Moderately High Expense Ratio 1.76 Sharpe Ratio -0.41 Information Ratio -0.31 Alpha Ratio -1.55 Min Investment 500 Min SIP Investment 500 Exit Load NIL Growth of 10,000 investment over the years.
Date Value 31 Jul 21 ₹10,000 31 Jul 22 ₹10,695 31 Jul 23 ₹12,879 31 Jul 24 ₹18,039 31 Jul 25 ₹17,331 Returns for Kotak Tax Saver Fund
absolute basis & more than 1 year are on CAGR (Compound Annual Growth Rate) basis. as on 31 Jul 26 Duration Returns 1 Month 2.7% 3 Month 4.7% 6 Month 2.2% 1 Year 1.8% 3 Year 11.1% 5 Year 12% 10 Year 15 Year Since launch 12.6% Historical performance (Yearly) on absolute basis
Year Returns 2025 1.8% 2024 21.8% 2023 23.6% 2022 6.9% 2021 33.2% 2020 14.9% 2019 12.7% 2018 -3.8% 2017 33.8% 2016 7.5% Fund Manager information for Kotak Tax Saver Fund
Name Since Tenure Harsha Upadhyaya 25 Aug 15 10.86 Yr. Data below for Kotak Tax Saver Fund as on 30 Jun 26
Equity Sector Allocation
Sector Value Financial Services 31.54% Industrials 12.76% Consumer Cyclical 11.47% Basic Materials 8.77% Health Care 6.97% Technology 6.38% Energy 6.23% Communication Services 5.22% Utility 4.84% Consumer Defensive 4.57% Asset Allocation
Asset Class Value Cash 1.24% Equity 98.76% Top Securities Holdings / Portfolio
Name Holding Value Quantity HDFC Bank Ltd (Financial Services)
Equity, Since 31 Jul 23 | HDFCBANK7% ₹447 Cr 6,000,000 State Bank of India (Financial Services)
Equity, Since 28 Feb 21 | SBIN5% ₹304 Cr 3,150,000 ICICI Bank Ltd (Financial Services)
Equity, Since 31 Oct 09 | ICICIBANK5% ₹289 Cr 2,300,000 Bharti Airtel Ltd (Communication Services)
Equity, Since 28 Feb 21 | BHARTIARTL4% ₹222 Cr 1,215,714 NTPC Ltd (Utilities)
Equity, Since 30 Sep 22 | NTPC3% ₹201 Cr 5,200,000
↑ 200,000 Tech Mahindra Ltd (Technology)
Equity, Since 31 Aug 23 | TECHM3% ₹178 Cr 1,200,000 Larsen & Toubro Ltd (Industrials)
Equity, Since 28 Feb 14 | LT3% ₹163 Cr 400,000 Eternal Ltd (Consumer Cyclical)
Equity, Since 31 Jul 24 | ETERNAL2% ₹150 Cr 6,000,000 Britannia Industries Ltd (Consumer Defensive)
Equity, Since 30 Jun 25 | BRITANNIA2% ₹148 Cr 285,000 Hindustan Petroleum Corp Ltd (Energy)
Equity, Since 29 Feb 24 | HINDPETRO2% ₹148 Cr 3,750,000 6. Invesco India Tax Plan
Invesco India Tax Plan
Growth Launch Date 29 Dec 06 NAV (31 Jul 26) ₹125.19 ↑ 0.58 (0.47 %) Net Assets (Cr) ₹2,646 on 30 Jun 26 Category Equity - ELSS AMC Invesco Asset Management (India) Private Ltd Rating ☆☆☆ Risk Moderately High Expense Ratio 1.91 Sharpe Ratio -0.46 Information Ratio -0.05 Alpha Ratio -2.43 Min Investment 500 Min SIP Investment 500 Exit Load NIL Growth of 10,000 investment over the years.
Date Value 31 Jul 21 ₹10,000 31 Jul 22 ₹9,796 31 Jul 23 ₹11,492 31 Jul 24 ₹16,320 31 Jul 25 ₹16,156 Returns for Invesco India Tax Plan
absolute basis & more than 1 year are on CAGR (Compound Annual Growth Rate) basis. as on 31 Jul 26 Duration Returns 1 Month 2.7% 3 Month 7.9% 6 Month 5.2% 1 Year 0.4% 3 Year 12.2% 5 Year 10.2% 10 Year 15 Year Since launch 13.8% Historical performance (Yearly) on absolute basis
Year Returns 2025 -2.8% 2024 25.2% 2023 30.9% 2022 -7.7% 2021 32.6% 2020 19.2% 2019 9.4% 2018 -1.3% 2017 35.7% 2016 3.4% Fund Manager information for Invesco India Tax Plan
Name Since Tenure Deepesh Kashyap 1 Jul 25 1 Yr. Data below for Invesco India Tax Plan as on 30 Jun 26
Equity Sector Allocation
Sector Value Financial Services 27.03% Industrials 19.27% Consumer Cyclical 17.41% Health Care 10.02% Basic Materials 7.78% Technology 6.14% Real Estate 4.67% Consumer Defensive 2.64% Energy 2.16% Communication Services 1.5% Asset Allocation
Asset Class Value Cash 1.37% Equity 98.63% Top Securities Holdings / Portfolio
Name Holding Value Quantity HDFC Bank Ltd (Financial Services)
Equity, Since 31 Dec 22 | HDFCBANK3% ₹88 Cr 1,183,079
↑ 133,596 ICICI Bank Ltd (Financial Services)
Equity, Since 31 Dec 15 | ICICIBANK3% ₹85 Cr 674,121 Axis Bank Ltd (Financial Services)
Equity, Since 31 Jan 26 | AXISBANK2% ₹63 Cr 490,437
↓ -61,718 Bajaj Finance Ltd (Financial Services)
Equity, Since 31 Jan 25 | BAJFINANCE2% ₹58 Cr 637,430 Reliance Industries Ltd (Energy)
Equity, Since 31 Jan 26 | RELIANCE2% ₹55 Cr 415,522
↑ 36,761 Coforge Ltd (Technology)
Equity, Since 31 May 24 | COFORGE2% ₹55 Cr 383,458
↓ -29,626 InterGlobe Aviation Ltd (Industrials)
Equity, Since 31 May 25 | INDIGO2% ₹54 Cr 122,889
↑ 5,520 Metro Brands Ltd (Consumer Cyclical)
Equity, Since 31 Jan 24 | METROBRAND2% ₹52 Cr 507,885 Transformers & Rectifiers (India) Ltd (Industrials)
Equity, Since 30 Sep 25 | TARIL2% ₹49 Cr 1,515,471
↑ 87,232 ZF Commercial Vehicle Control Systems India Ltd (Consumer Cyclical)
Equity, Since 30 Jun 25 | ZFCVINDIA2% ₹48 Cr 33,000
ایکویٹی لنکڈ سیونگ اسکیم میں ٹیکس کی بچت
آئیے ELSS کے ساتھ اور اس کے بغیر ٹیکس بچتوں کا موازنہ کرکے ٹیکس فوائد کو چیک کریں:
| تفصیلات | ٹیکس پلاننگ (ELSS) | کوئی ٹیکس پلاننگ نہیں۔ |
|---|---|---|
| مجموعی کلآمدنی | 8,00,000 | 8,00,000 |
| ٹیکس سے استثنیٰ | 1,50,000 | صفر |
| کلقابل ٹیکس آمدنی | 6,50,000 | 8,00,000 |
| ٹیکس ادا کرنا ہے۔ | 32,500 | 62,500 |
| محفوظ شدہ رقم | 30,000 | صفر |
لہذا، ELSS میں سرمایہ کاری کرنے سے بچائی گئی کل رقم INR 30,000 ہے۔
ٹیکس بچانے والے میوچل فنڈز میں سرمایہ کاری کے فوائد
ٹیکس فوائد کے ساتھ، ELSS آپ کو درج ذیل فوائد بھی پیش کرتا ہے:
ایکویٹی ریٹرن
جیسا کہ ELSS ایکویٹی اور ٹیکس کی بچت کا مجموعہ ہے، اس لیے آپ جو رقم لگاتے ہیں وہ اسٹاک مارکیٹ کے بڑھنے کے ساتھ بڑھتا ہے۔ لہذا، سرمایہ کار ایکویٹی مارکیٹ سے بھی منافع کما سکتے ہیں۔ لہذا، ELSS ایک طویل مدتی دولت کی تخلیق کا ایک ذریعہ بھی ہے۔
SIP فوائد
یکمشت رقم کی سرمایہ کاری کرنے کے بجائے، سرمایہ کار ماہانہ سرمایہ کاری کے ذریعے ایک آسان راستہ منتخب کر سکتے ہیں۔گھونٹ. SIP کے ساتھ، کوئی بھی INR 500 تک کم سرمایہ کاری کر سکتا ہے، جو اسے سرمایہ کاروں کے لیے سب سے سستی ٹیکس کی منصوبہ بندی اور سرمایہ کاری کا ذریعہ بناتا ہے۔
مختصر ترین لاک ان پیریڈ
ELSS کا لاک اِن دورانیہ 3 سال ہے، جو ٹیکس بچانے کے دیگر تمام آلات کے درمیان سب سے کم لاک اِن پیریڈ ہے۔
ELSS فنڈز میں آن لائن سرمایہ کاری کیسے کی جائے؟
Fincash.com پر لائف ٹائم کے لیے مفت انویسٹمنٹ اکاؤنٹ کھولیں۔
اپنی رجسٹریشن اور KYC کا عمل مکمل کریں۔
دستاویزات اپ لوڈ کریں (PAN، آدھار، وغیرہ)۔اور، آپ سرمایہ کاری کے لیے تیار ہیں!
یہاں فراہم کردہ معلومات کے درست ہونے کو یقینی بنانے کے لیے تمام کوششیں کی گئی ہیں۔ تاہم، ڈیٹا کی درستگی کے حوالے سے کوئی ضمانت نہیں دی جاتی ہے۔ براہ کرم کوئی بھی سرمایہ کاری کرنے سے پہلے اسکیم کی معلومات کے دستاویز کے ساتھ تصدیق کریں۔


AMFI Registration No. 112358 | CIN: U74999MH2016PTC282153
Shepard Technologies Pvt. Ltd. (with ARN code 112358) makes no warranties or representations, express or implied, on products offered through the platform. It accepts no liability for any damages or losses, however caused, in connection with the use of, or on the reliance of its product or related services. Terms and conditions of the website are applicable.
©2026 Shepard Technologies Private Limited. All Rights Reserved
Research Highlights for Tata India Tax Savings Fund