بہترین ڈیبٹ میوچل فنڈز 2022
بہترین قرض فنڈز کی سرمایہ کاری کی مدت کے مطابق مختلف ہوتے ہیں۔سرمایہ کار. بہترین کا انتخاب کرتے وقت سرمایہ کاروں کو سرمایہ کاری کے اپنے وقت کے افق پر واضح ہونا ضروری ہے۔قرض فنڈ ان کی سرمایہ کاری کے لیے اور شرح سود کے منظر نامے میں بھی عنصر۔
ان سرمایہ کاروں کے لیے جن کی ہولڈنگ کی مدت بہت کم ہے، کچھ دنوں سے ایک مہینے تک کہو،مائع فنڈز اور انتہائیمختصر مدت کے فنڈز متعلقہ ہو سکتا ہے. جب وقت کا افق ایک سے دو سال ہو تو مختصر مدت کے فنڈز مطلوبہ گاڑی ہو سکتے ہیں۔ طویل مدت کے لیے، 3 سال سے زیادہ کے لیے، طویل مدتی قرض فنڈز سرمایہ کاروں کی طرف سے سب سے زیادہ ترجیحی آلات ہیں، خاص طور پر گرتی ہوئی شرح سود کے دوران۔ سب سے بڑھ کر، قرض فنڈز اس سے کم خطرناک ثابت ہوئے ہیں۔ایکوئٹیز قلیل مدتی سرمایہ کاری کی تلاش میں، تاہم، طویل مدتی انکم فنڈز کا اتار چڑھاؤ ایکوئٹیز سے مماثل ہو سکتا ہے۔

چونکہ قرض کے فنڈز مقررہ آمدنی کے آلات جیسے سرکاری سیکیورٹیز، ٹریژری بلز، کارپوریٹ میں سرمایہ کاری کرتے ہیں۔بانڈزوغیرہ، ان میں وقت کے ساتھ مستقل اور باقاعدہ منافع پیدا کرنے کی صلاحیت ہوتی ہے۔ تاہم، بہت سے معیار اور مقداری عوامل ہیں جنہیں سرمایہ کاری کے لیے بہترین قرض فنڈز کا انتخاب کرنے سے پہلے سمجھنے کی ضرورت ہے، جیسے - AUM، اوسط میچورٹی، ٹیکسیشن، پورٹ فولیو کا کریڈٹ معیار وغیرہ۔ ذیل میں ہم نے سرفہرست 5 بہترین قرض فنڈز کی فہرست دی ہے۔ قرض فنڈز کے مختلف زمروں میں سرمایہ کاری کرنا -بہترین مائع فنڈزبہترین الٹرا شارٹ ٹرم فنڈز،بہترین قلیل مدتی فنڈزبہترین طویل مدتی فنڈز اور بہترینگلٹ فنڈز 2022 - 2023 میں سرمایہ کاری کرنا۔
ڈیبٹ میوچل فنڈز میں سرمایہ کاری کیوں کی جائے؟
a ڈیبٹ فنڈز کو باقاعدہ آمدنی پیدا کرنے کے لیے ایک مثالی سرمایہ کاری سمجھا جاتا ہے۔ مثال کے طور پر، ڈیویڈنڈ کی ادائیگی کا انتخاب باقاعدہ آمدنی کے لیے ایک آپشن ہو سکتا ہے۔
ب ڈیٹ فنڈز میں، سرمایہ کار کسی بھی وقت سرمایہ کاری سے مطلوبہ رقم نکال سکتے ہیں اور باقی رقم کو سرمایہ کاری میں رہنے دے سکتے ہیں۔
c چونکہ قرض کے فنڈز زیادہ تر سرکاری سیکیورٹیز، کارپوریٹ قرض اور دیگر سیکیورٹیز جیسے ٹریژری بلز وغیرہ میں سرمایہ کاری کرتے ہیں، اس لیے وہ ایکویٹی مارکیٹ کے اتار چڑھاؤ سے متاثر نہیں ہوتے ہیں۔
d اگر کوئی سرمایہ کار مختصر مدت کے حصول کا منصوبہ بنا رہا ہے۔مالی اہداف یا مختصر مدت کے لیے سرمایہ کاری کریں پھر قرض فنڈز ایک اچھا آپشن ہو سکتا ہے۔ مائع فنڈز، الٹرا شارٹ ٹرم فنڈز، اور شارٹ ٹرم انکم فنڈز مطلوبہ اختیارات ہو سکتے ہیں۔
e قرض کے فنڈز میں، سرمایہ کار ہر ماہ ایک منظم واپسی کا منصوبہ شروع کر کے مقررہ آمدنی پیدا کر سکتے ہیں (SWP اس کے برعکس ہےگھونٹ /برائے مہربانی) ماہانہ بنیاد پر ایک مقررہ رقم نکالنا۔ اس کے علاوہ، ضرورت پڑنے پر آپ SWP کی رقم کو تبدیل کر سکتے ہیں۔
ڈیبٹ میوچل فنڈز میں خطرات
جبکہسرمایہ کاری قرض فنڈز میں، سرمایہ کاروں کو ان سے جڑے دو بڑے خطرات کے بارے میں محتاط رہنا چاہیے- کریڈٹ رسک اور سود کا خطرہ۔
a قرض کا خطرہ
کریڈٹ رسک اس وقت پیدا ہوتا ہے جب ایک کمپنی جس نے قرض کے آلات جاری کیے ہوں وہ باقاعدہ ادائیگی نہیں کرتی ہے۔ ایسے معاملات میں، اس کا فنڈ پر بڑا اثر پڑتا ہے، اس پر منحصر ہے کہ پورٹ فولیو میں فنڈ کا کتنا حصہ ہے۔ لہذا، یہ تجویز کیا جاتا ہے کہ قرض کے آلات میں درجہ بندی زیادہ کریڈٹ ریٹنگ کے ساتھ ہو۔ ایکاے اے اے درجہ بندی کو کم یا نہ ہونے کے برابر ادائیگی کے ساتھ اعلیٰ ترین معیار سمجھا جاتا ہے۔پہلے سے موجود خطرہ.
ب سود کے خطرات
سود کی شرح کا خطرہ مروجہ سود کی شرح میں تبدیلی کی وجہ سے بانڈ کی قیمت میں تبدیلی سے مراد ہے۔ جب معیشت میں شرح سود میں اضافہ ہوتا ہے تو بانڈ کی قیمتیں گر جاتی ہیں اور اس کے برعکس۔ فنڈز کے پورٹ فولیو کی پختگی جتنی زیادہ ہوگی، سود کی شرح کے خطرے کا اتنا ہی زیادہ خطرہ ہے۔ لہٰذا شرح سود کے بڑھتے ہوئے منظر نامے میں، کم میچورٹی ڈیٹ فنڈز کے لیے جانے کا مشورہ دیا جاتا ہے۔ اور گرتی ہوئی شرح سود کے منظر نامے میں الٹ۔
قرض میوچل فنڈ ٹیکسیشن
قرض فنڈز پر ٹیکس کا اطلاق درج ذیل طریقے سے کیا جاتا ہے۔
a شارٹ ٹرم کیپیٹل گینز
اگر قرض کی سرمایہ کاری کی مدت 36 ماہ سے کم ہے، تو اسے قلیل مدتی سرمایہ کاری کے طور پر درجہ بندی کیا جاتا ہے اور ان پر فرد کے ٹیکس سلیب کے مطابق ٹیکس لگایا جاتا ہے۔
ب طویل مدتی کیپٹل گینز
اگر قرض کی سرمایہ کاری کی ہولڈنگ کی مدت 36 ماہ سے زیادہ ہے، تو اسے ایک طویل مدتی سرمایہ کاری کے طور پر درجہ بندی کیا جاتا ہے اور اس پر انڈیکسیشن فائدہ کے ساتھ 20% ٹیکس لگایا جاتا ہے۔
| سرمایہ فوائد | انویسٹمنٹ ہولڈنگ گینز | ٹیکس لگانا |
|---|---|---|
| قلیل مدتکیپٹل گینز | 36 ماہ سے کم | فرد کے ٹیکس سلیب کے مطابق |
| طویل مدتی کیپٹل گینز | 36 ماہ سے زیادہ | انڈیکسیشن فوائد کے ساتھ 20% |
Talk to our investment specialist
FY 22 - 23 کی سرمایہ کاری کے لیے ہندوستان میں بہترین ڈیبٹ میوچل فنڈز
سرفہرست 5 مائع میوچل فنڈز
اوپرمائع اے یو ایم/نیٹ اثاثوں کے ساتھ فنڈز > 10،000 کروڑ۔Fund NAV Net Assets (Cr) Min Investment 1 MO (%) 3 MO (%) 6 MO (%) 1 YR (%) 2025 (%) Debt Yield (YTM) Mod. Duration Eff. Maturity Axis Liquid Fund Growth ₹3,106.59
↑ 0.53 ₹44,866 500 0.5 1.6 3.4 6.4 6.6 6.64% 1M 5D 1M 5D Aditya Birla Sun Life Liquid Fund Growth ₹449.378
↑ 0.08 ₹63,687 5,000 0.5 1.6 3.3 6.3 6.5 6.49% 2M 5D 2M 5D Invesco India Liquid Fund Growth ₹3,832.81
↑ 0.65 ₹16,797 5,000 0.5 1.6 3.3 6.3 6.5 6.56% 30D 1M 1D Nippon India Liquid Fund Growth ₹6,803.95
↑ 1.10 ₹35,870 100 0.5 1.6 3.3 6.3 6.5 6.98% 1M 14D 1M 17D Tata Liquid Fund Growth ₹4,390.6
↑ 0.73 ₹22,044 5,000 0.5 1.6 3.3 6.3 6.5 6.59% 1M 6D 1M 6D Note: Returns up to 1 year are on absolute basis & more than 1 year are on CAGR basis. as on 29 Jul 26 Research Highlights & Commentary of 5 Funds showcased
Commentary Axis Liquid Fund Aditya Birla Sun Life Liquid Fund Invesco India Liquid Fund Nippon India Liquid Fund Tata Liquid Fund Point 1 Upper mid AUM (₹44,866 Cr). Highest AUM (₹63,687 Cr). Bottom quartile AUM (₹16,797 Cr). Lower mid AUM (₹35,870 Cr). Bottom quartile AUM (₹22,044 Cr). Point 2 Established history (16+ yrs). Oldest track record among peers (22 yrs). Established history (19+ yrs). Established history (22+ yrs). Established history (21+ yrs). Point 3 Top rated. Rating: 4★ (upper mid). Rating: 4★ (lower mid). Rating: 4★ (bottom quartile). Rating: 4★ (bottom quartile). Point 4 Risk profile: Low. Risk profile: Low. Risk profile: Low. Risk profile: Low. Risk profile: Low. Point 5 1Y return: 6.36% (top quartile). 1Y return: 6.32% (upper mid). 1Y return: 6.30% (lower mid). 1Y return: 6.28% (bottom quartile). 1Y return: 6.27% (bottom quartile). Point 6 1M return: 0.54% (top quartile). 1M return: 0.53% (lower mid). 1M return: 0.53% (bottom quartile). 1M return: 0.53% (bottom quartile). 1M return: 0.53% (upper mid). Point 7 Sharpe: 2.39 (top quartile). Sharpe: 2.22 (bottom quartile). Sharpe: 2.27 (lower mid). Sharpe: 2.12 (bottom quartile). Sharpe: 2.37 (upper mid). Point 8 Information ratio: 0.00 (top quartile). Information ratio: 0.00 (upper mid). Information ratio: 0.00 (lower mid). Information ratio: 0.00 (bottom quartile). Information ratio: 0.00 (bottom quartile). Point 9 Yield to maturity (debt): 6.64% (upper mid). Yield to maturity (debt): 6.49% (bottom quartile). Yield to maturity (debt): 6.56% (bottom quartile). Yield to maturity (debt): 6.98% (top quartile). Yield to maturity (debt): 6.59% (lower mid). Point 10 Modified duration: 0.10 yrs (upper mid). Modified duration: 0.18 yrs (bottom quartile). Modified duration: 0.08 yrs (top quartile). Modified duration: 0.12 yrs (bottom quartile). Modified duration: 0.10 yrs (lower mid). Axis Liquid Fund
Aditya Birla Sun Life Liquid Fund
Invesco India Liquid Fund
Nippon India Liquid Fund
Tata Liquid Fund
ٹاپ 5 الٹرا شارٹ ٹرم بانڈ میوچل فنڈز
اوپرالٹرا شارٹ بانڈ اے یو ایم/نیٹ اثاثوں کے ساتھ فنڈز> 1,000 کروڑ۔Fund NAV Net Assets (Cr) Min Investment 3 MO (%) 6 MO (%) 1 YR (%) 3 YR (%) 2025 (%) Debt Yield (YTM) Mod. Duration Eff. Maturity Aditya Birla Sun Life Savings Fund Growth ₹586.593
↑ 0.16 ₹17,816 1,000 1.7 3.4 6.2 7.3 7.4 7.45% 5M 26D 6M 18D UTI Ultra Short Term Fund Growth ₹4,512.37
↑ 0.30 ₹3,146 5,000 1.6 3.2 5.8 6.7 6.6 7.61% 4M 1D 5M 17D ICICI Prudential Ultra Short Term Fund Growth ₹29.5983
↑ 0.00 ₹14,352 5,000 1.7 3.3 6.2 7 7.1 7.79% 5M 8D 6M 11D SBI Magnum Ultra Short Duration Fund Growth ₹6,377.13
↑ 0.78 ₹11,408 5,000 1.6 3.3 6.1 6.9 7 7.77% 5M 5D 8M 16D Invesco India Ultra Short Term Fund Growth ₹2,876.01
↑ 0.15 ₹1,002 5,000 1.6 3.3 6 6.9 6.8 7.53% 5M 3D 5M 6D Note: Returns up to 1 year are on absolute basis & more than 1 year are on CAGR basis. as on 29 Jul 26 Research Highlights & Commentary of 5 Funds showcased
Commentary Aditya Birla Sun Life Savings Fund UTI Ultra Short Term Fund ICICI Prudential Ultra Short Term Fund SBI Magnum Ultra Short Duration Fund Invesco India Ultra Short Term Fund Point 1 Highest AUM (₹17,816 Cr). Bottom quartile AUM (₹3,146 Cr). Upper mid AUM (₹14,352 Cr). Lower mid AUM (₹11,408 Cr). Bottom quartile AUM (₹1,002 Cr). Point 2 Established history (23+ yrs). Established history (22+ yrs). Established history (15+ yrs). Oldest track record among peers (27 yrs). Established history (15+ yrs). Point 3 Top rated. Rating: 4★ (upper mid). Rating: 3★ (lower mid). Rating: 3★ (bottom quartile). Rating: 3★ (bottom quartile). Point 4 Risk profile: Moderately Low. Risk profile: Moderately Low. Risk profile: Moderate. Risk profile: Low. Risk profile: Moderate. Point 5 1Y return: 6.24% (top quartile). 1Y return: 5.84% (bottom quartile). 1Y return: 6.18% (upper mid). 1Y return: 6.10% (lower mid). 1Y return: 6.00% (bottom quartile). Point 6 1M return: 0.53% (top quartile). 1M return: 0.49% (upper mid). 1M return: 0.49% (lower mid). 1M return: 0.46% (bottom quartile). 1M return: 0.47% (bottom quartile). Point 7 Sharpe: 0.91 (upper mid). Sharpe: 0.43 (bottom quartile). Sharpe: 0.92 (top quartile). Sharpe: 0.84 (lower mid). Sharpe: 0.68 (bottom quartile). Point 8 Information ratio: 0.00 (top quartile). Information ratio: 0.00 (upper mid). Information ratio: 0.00 (lower mid). Information ratio: 0.00 (bottom quartile). Information ratio: 0.00 (bottom quartile). Point 9 Yield to maturity (debt): 7.45% (bottom quartile). Yield to maturity (debt): 7.61% (lower mid). Yield to maturity (debt): 7.79% (top quartile). Yield to maturity (debt): 7.77% (upper mid). Yield to maturity (debt): 7.53% (bottom quartile). Point 10 Modified duration: 0.49 yrs (bottom quartile). Modified duration: 0.34 yrs (top quartile). Modified duration: 0.44 yrs (bottom quartile). Modified duration: 0.43 yrs (lower mid). Modified duration: 0.42 yrs (upper mid). Aditya Birla Sun Life Savings Fund
UTI Ultra Short Term Fund
ICICI Prudential Ultra Short Term Fund
SBI Magnum Ultra Short Duration Fund
Invesco India Ultra Short Term Fund
ٹاپ اور بہترین فلوٹنگ ریٹ میوچل فنڈز
Fund NAV Net Assets (Cr) Min Investment 3 MO (%) 6 MO (%) 1 YR (%) 3 YR (%) 2025 (%) Debt Yield (YTM) Mod. Duration Eff. Maturity Aditya Birla Sun Life Floating Rate Fund - Long Term Growth ₹371.572
↑ 0.01 ₹13,519 1,000 1.7 3.3 5.9 7.3 7.7 7.21% 10M 28D 1Y 8M 26D ICICI Prudential Floating Interest Fund Growth ₹454.372
↓ -0.02 ₹8,011 5,000 1.9 3.4 6.2 7.4 7.7 7.87% 1Y 10M 13D 2Y 10M 24D Nippon India Floating Rate Fund Growth ₹48.1215
↓ 0.00 ₹7,626 5,000 2.1 3.2 5.5 7.4 7.9 7.9% 2Y 2M 1D 2Y 8M 1D Note: Returns up to 1 year are on absolute basis & more than 1 year are on CAGR basis. as on 29 Jul 26 Research Highlights & Commentary of 3 Funds showcased
Commentary Aditya Birla Sun Life Floating Rate Fund - Long Term ICICI Prudential Floating Interest Fund Nippon India Floating Rate Fund Point 1 Highest AUM (₹13,519 Cr). Lower mid AUM (₹8,011 Cr). Bottom quartile AUM (₹7,626 Cr). Point 2 Established history (17+ yrs). Established history (20+ yrs). Oldest track record among peers (21 yrs). Point 3 Top rated. Rating: 3★ (lower mid). Rating: 3★ (bottom quartile). Point 4 Risk profile: Moderately Low. Risk profile: Moderate. Risk profile: Moderately Low. Point 5 1Y return: 5.95% (lower mid). 1Y return: 6.23% (upper mid). 1Y return: 5.48% (bottom quartile). Point 6 1M return: 0.45% (upper mid). 1M return: 0.39% (lower mid). 1M return: 0.38% (bottom quartile). Point 7 Sharpe: 0.48 (lower mid). Sharpe: 0.63 (upper mid). Sharpe: 0.11 (bottom quartile). Point 8 Information ratio: 0.00 (upper mid). Information ratio: 0.00 (lower mid). Information ratio: 0.00 (bottom quartile). Point 9 Yield to maturity (debt): 7.21% (bottom quartile). Yield to maturity (debt): 7.87% (lower mid). Yield to maturity (debt): 7.90% (upper mid). Point 10 Modified duration: 0.91 yrs (upper mid). Modified duration: 1.87 yrs (lower mid). Modified duration: 2.17 yrs (bottom quartile). Aditya Birla Sun Life Floating Rate Fund - Long Term
ICICI Prudential Floating Interest Fund
Nippon India Floating Rate Fund
سرفہرست 5 بہترین منی مارکیٹ میوچل فنڈز
Fund NAV Net Assets (Cr) Min Investment 3 MO (%) 6 MO (%) 1 YR (%) 3 YR (%) 2025 (%) Debt Yield (YTM) Mod. Duration Eff. Maturity Aditya Birla Sun Life Money Manager Fund Growth ₹395.967
↑ 0.02 ₹27,383 1,000 1.7 3.4 6.2 7.3 7.4 6.95% 6M 25D 6M 29D UTI Money Market Fund Growth ₹3,301.37
↑ 0.12 ₹17,557 10,000 1.7 3.3 6.2 7.3 7.5 7.58% 6M 20D 6M 20D Kotak Money Market Scheme Growth ₹4,805.4
↑ 0.21 ₹28,762 5,000 1.7 3.4 6.2 7.2 7.4 7.71% 7M 6D 7M 6D ICICI Prudential Money Market Fund Growth ₹406.032
↑ 0.03 ₹31,085 500 1.7 3.3 6.2 7.2 7.4 7.7% 6M 29D 7M 16D Tata Money Market Fund Growth ₹5,053.51
↑ 0.29 ₹32,150 5,000 1.7 3.4 6.2 7.3 7.4 7.79% 7M 1D 7M 1D Note: Returns up to 1 year are on absolute basis & more than 1 year are on CAGR basis. as on 29 Jul 26 Research Highlights & Commentary of 5 Funds showcased
Commentary Aditya Birla Sun Life Money Manager Fund UTI Money Market Fund Kotak Money Market Scheme ICICI Prudential Money Market Fund Tata Money Market Fund Point 1 Bottom quartile AUM (₹27,383 Cr). Bottom quartile AUM (₹17,557 Cr). Lower mid AUM (₹28,762 Cr). Upper mid AUM (₹31,085 Cr). Highest AUM (₹32,150 Cr). Point 2 Established history (20+ yrs). Established history (17+ yrs). Oldest track record among peers (23 yrs). Established history (20+ yrs). Established history (23+ yrs). Point 3 Top rated. Rating: 4★ (upper mid). Rating: 4★ (lower mid). Rating: 4★ (bottom quartile). Rating: 3★ (bottom quartile). Point 4 Risk profile: Low. Risk profile: Low. Risk profile: Low. Risk profile: Low. Risk profile: Low. Point 5 1Y return: 6.19% (lower mid). 1Y return: 6.22% (top quartile). 1Y return: 6.18% (bottom quartile). 1Y return: 6.16% (bottom quartile). 1Y return: 6.19% (upper mid). Point 6 1M return: 0.52% (top quartile). 1M return: 0.50% (lower mid). 1M return: 0.50% (bottom quartile). 1M return: 0.49% (bottom quartile). 1M return: 0.51% (upper mid). Point 7 Sharpe: 0.69 (bottom quartile). Sharpe: 0.81 (upper mid). Sharpe: 0.75 (lower mid). Sharpe: 0.72 (bottom quartile). Sharpe: 0.82 (top quartile). Point 8 Information ratio: 0.00 (top quartile). Information ratio: 0.00 (upper mid). Information ratio: 0.00 (lower mid). Information ratio: 0.00 (bottom quartile). Information ratio: 0.00 (bottom quartile). Point 9 Yield to maturity (debt): 6.95% (bottom quartile). Yield to maturity (debt): 7.58% (bottom quartile). Yield to maturity (debt): 7.71% (upper mid). Yield to maturity (debt): 7.70% (lower mid). Yield to maturity (debt): 7.79% (top quartile). Point 10 Modified duration: 0.57 yrs (upper mid). Modified duration: 0.56 yrs (top quartile). Modified duration: 0.60 yrs (bottom quartile). Modified duration: 0.58 yrs (lower mid). Modified duration: 0.59 yrs (bottom quartile). Aditya Birla Sun Life Money Manager Fund
UTI Money Market Fund
Kotak Money Market Scheme
ICICI Prudential Money Market Fund
Tata Money Market Fund
ٹاپ 5 شارٹ ٹرم بانڈ میوچل فنڈز
Fund NAV Net Assets (Cr) 3 MO (%) 6 MO (%) 1 YR (%) 3 YR (%) 2025 (%) Debt Yield (YTM) Mod. Duration Eff. Maturity PGIM India Short Maturity Fund Growth ₹39.3202
↓ 0.00 ₹28 1.2 3.1 6.1 4.2 7.18% 1Y 7M 28D 1Y 11M 1D ICICI Prudential Short Term Fund Growth ₹64.1942
↓ -0.01 ₹19,175 2.1 3.3 5.7 7.4 8 8.14% 2Y 8M 19D 4Y 5M 23D Aditya Birla Sun Life Short Term Opportunities Fund Growth ₹50.5598
↓ -0.01 ₹5,793 2.1 3.2 5.3 7.2 7.7 7.76% 2Y 8M 16D 3Y 6M 18D Nippon India Short Term Fund Growth ₹56.1218
↓ -0.01 ₹7,040 2.1 3.2 5.3 7.3 7.9 8.03% 2Y 3M 18D 2Y 8M 23D UTI Short Term Income Fund Growth ₹33.6216
↑ 0.00 ₹2,128 2.1 3.2 5.1 7 7.3 7.92% 1Y 9M 7D 2Y 8M 19D Note: Returns up to 1 year are on absolute basis & more than 1 year are on CAGR basis. as on 29 Sep 23 Research Highlights & Commentary of 5 Funds showcased
Commentary PGIM India Short Maturity Fund ICICI Prudential Short Term Fund Aditya Birla Sun Life Short Term Opportunities Fund Nippon India Short Term Fund UTI Short Term Income Fund Point 1 Bottom quartile AUM (₹28 Cr). Highest AUM (₹19,175 Cr). Lower mid AUM (₹5,793 Cr). Upper mid AUM (₹7,040 Cr). Bottom quartile AUM (₹2,128 Cr). Point 2 Established history (23+ yrs). Oldest track record among peers (24 yrs). Established history (23+ yrs). Established history (23+ yrs). Established history (18+ yrs). Point 3 Top rated. Rating: 4★ (upper mid). Rating: 4★ (lower mid). Rating: 4★ (bottom quartile). Rating: 4★ (bottom quartile). Point 4 Risk profile: Moderate. Risk profile: Moderate. Risk profile: Moderate. Risk profile: Moderately Low. Risk profile: Moderate. Point 5 1Y return: 6.08% (top quartile). 1Y return: 5.73% (upper mid). 1Y return: 5.34% (lower mid). 1Y return: 5.26% (bottom quartile). 1Y return: 5.09% (bottom quartile). Point 6 1M return: 0.43% (upper mid). 1M return: 0.33% (bottom quartile). 1M return: 0.38% (lower mid). 1M return: 0.37% (bottom quartile). 1M return: 0.44% (top quartile). Point 7 Sharpe: -0.98 (bottom quartile). Sharpe: 0.29 (top quartile). Sharpe: 0.05 (upper mid). Sharpe: 0.00 (lower mid). Sharpe: -0.17 (bottom quartile). Point 8 Information ratio: 0.00 (top quartile). Information ratio: 0.00 (upper mid). Information ratio: 0.00 (lower mid). Information ratio: 0.00 (bottom quartile). Information ratio: 0.00 (bottom quartile). Point 9 Yield to maturity (debt): 7.18% (bottom quartile). Yield to maturity (debt): 8.14% (top quartile). Yield to maturity (debt): 7.76% (bottom quartile). Yield to maturity (debt): 8.03% (upper mid). Yield to maturity (debt): 7.92% (lower mid). Point 10 Modified duration: 1.66 yrs (top quartile). Modified duration: 2.72 yrs (bottom quartile). Modified duration: 2.71 yrs (bottom quartile). Modified duration: 2.30 yrs (lower mid). Modified duration: 1.77 yrs (upper mid). PGIM India Short Maturity Fund
ICICI Prudential Short Term Fund
Aditya Birla Sun Life Short Term Opportunities Fund
Nippon India Short Term Fund
UTI Short Term Income Fund
ٹاپ 5 میڈیم سے لانگ ٹرم بانڈ میوچل فنڈز
اوپردرمیانی سے طویل مدتی بانڈ اے یو ایم/نیٹ اثاثوں کے ساتھ فنڈز> 500 کروڑ۔Fund NAV Net Assets (Cr) 3 MO (%) 6 MO (%) 1 YR (%) 3 YR (%) 2025 (%) Debt Yield (YTM) Mod. Duration Eff. Maturity SBI Magnum Income Fund Growth ₹73.7927
↓ -0.04 ₹2,055 2.4 3 3.9 6.5 5.9 7.92% 4Y 1M 17D 8Y 3M ICICI Prudential Bond Fund Growth ₹42.2654
↓ -0.04 ₹2,002 2.7 3 4.1 7.1 6.7 7.85% 6Y 5M 19D 15Y 2M 16D Aditya Birla Sun Life Income Fund Growth ₹129.997
↓ -0.14 ₹1,787 2.7 2.8 3.1 6.1 5.1 7.47% 6Y 8M 5D 15Y 18D Kotak Bond Fund Growth ₹80.0578
↓ -0.02 ₹1,807 3 3.3 3.7 6.4 5.4 7.59% 4Y 7M 20D 8Y 2M 5D HDFC Income Fund Growth ₹60.616
↓ -0.07 ₹833 2.9 3.3 3.6 6.5 5.5 7.34% 6Y 5M 8D 13Y 1M 28D Note: Returns up to 1 year are on absolute basis & more than 1 year are on CAGR basis. as on 29 Jul 26 Research Highlights & Commentary of 5 Funds showcased
Commentary SBI Magnum Income Fund ICICI Prudential Bond Fund Aditya Birla Sun Life Income Fund Kotak Bond Fund HDFC Income Fund Point 1 Highest AUM (₹2,055 Cr). Upper mid AUM (₹2,002 Cr). Bottom quartile AUM (₹1,787 Cr). Lower mid AUM (₹1,807 Cr). Bottom quartile AUM (₹833 Cr). Point 2 Established history (27+ yrs). Established history (17+ yrs). Oldest track record among peers (30 yrs). Established history (26+ yrs). Established history (25+ yrs). Point 3 Top rated. Rating: 3★ (upper mid). Rating: 3★ (lower mid). Rating: 2★ (bottom quartile). Rating: 2★ (bottom quartile). Point 4 Risk profile: Moderate. Risk profile: Moderate. Risk profile: Moderate. Risk profile: Moderate. Risk profile: Moderate. Point 5 1Y return: 3.94% (upper mid). 1Y return: 4.14% (top quartile). 1Y return: 3.09% (bottom quartile). 1Y return: 3.73% (lower mid). 1Y return: 3.57% (bottom quartile). Point 6 1M return: 0.18% (lower mid). 1M return: 0.22% (upper mid). 1M return: 0.09% (bottom quartile). 1M return: 0.32% (top quartile). 1M return: 0.14% (bottom quartile). Point 7 Sharpe: -0.40 (bottom quartile). Sharpe: -0.21 (top quartile). Sharpe: -0.49 (bottom quartile). Sharpe: -0.39 (lower mid). Sharpe: -0.37 (upper mid). Point 8 Information ratio: 0.00 (top quartile). Information ratio: 0.00 (upper mid). Information ratio: 0.00 (lower mid). Information ratio: 0.00 (bottom quartile). Information ratio: 0.00 (bottom quartile). Point 9 Yield to maturity (debt): 7.92% (top quartile). Yield to maturity (debt): 7.85% (upper mid). Yield to maturity (debt): 7.47% (bottom quartile). Yield to maturity (debt): 7.59% (lower mid). Yield to maturity (debt): 7.34% (bottom quartile). Point 10 Modified duration: 4.13 yrs (top quartile). Modified duration: 6.47 yrs (bottom quartile). Modified duration: 6.68 yrs (bottom quartile). Modified duration: 4.64 yrs (upper mid). Modified duration: 6.44 yrs (lower mid). SBI Magnum Income Fund
ICICI Prudential Bond Fund
Aditya Birla Sun Life Income Fund
Kotak Bond Fund
HDFC Income Fund
ٹاپ 5 بینکنگ اور PSU ڈیبٹ میوچل فنڈز
Fund NAV Net Assets (Cr) 3 MO (%) 6 MO (%) 1 YR (%) 3 YR (%) 2025 (%) Debt Yield (YTM) Mod. Duration Eff. Maturity UTI Banking & PSU Debt Fund Growth ₹23.3489
↑ 0.00 ₹1,101 1.7 3.2 5.5 7.1 7.8 7.69% 9M 14D 10M 2D HDFC Banking and PSU Debt Fund Growth ₹24.3658
↑ 0.00 ₹5,255 2.3 3.2 5 7 7.5 7.78% 3Y 7D 4Y 1M 2D Kotak Banking and PSU Debt fund Growth ₹69.53
↑ 0.01 ₹5,019 2.2 3.3 5.4 7.2 7.7 7.77% 2Y 9M 22D 3Y 6M 18D ICICI Prudential Banking and PSU Debt Fund Growth ₹34.7877
↓ -0.01 ₹8,823 2.2 3.1 5.4 7.2 7.6 7.9% 3Y 2M 16D 5Y 9M 29D Aditya Birla Sun Life Banking & PSU Debt Fund Growth ₹387.34
↓ -0.10 ₹8,963 2 3.1 4.7 6.9 7.3 7.22% 3Y 18D 4Y 4M 28D Note: Returns up to 1 year are on absolute basis & more than 1 year are on CAGR basis. as on 29 Jul 26 Research Highlights & Commentary of 5 Funds showcased
Commentary UTI Banking & PSU Debt Fund HDFC Banking and PSU Debt Fund Kotak Banking and PSU Debt fund ICICI Prudential Banking and PSU Debt Fund Aditya Birla Sun Life Banking & PSU Debt Fund Point 1 Bottom quartile AUM (₹1,101 Cr). Lower mid AUM (₹5,255 Cr). Bottom quartile AUM (₹5,019 Cr). Upper mid AUM (₹8,823 Cr). Highest AUM (₹8,963 Cr). Point 2 Established history (12+ yrs). Established history (12+ yrs). Oldest track record among peers (27 yrs). Established history (16+ yrs). Established history (18+ yrs). Point 3 Top rated. Rating: 5★ (upper mid). Rating: 4★ (lower mid). Rating: 4★ (bottom quartile). Rating: 4★ (bottom quartile). Point 4 Risk profile: Moderate. Risk profile: Moderately Low. Risk profile: Moderately Low. Risk profile: Moderate. Risk profile: Moderate. Point 5 1Y return: 5.54% (top quartile). 1Y return: 4.96% (bottom quartile). 1Y return: 5.40% (upper mid). 1Y return: 5.38% (lower mid). 1Y return: 4.72% (bottom quartile). Point 6 1M return: 0.47% (top quartile). 1M return: 0.35% (lower mid). 1M return: 0.37% (upper mid). 1M return: 0.24% (bottom quartile). 1M return: 0.32% (bottom quartile). Point 7 Sharpe: 0.07 (upper mid). Sharpe: -0.11 (bottom quartile). Sharpe: 0.04 (lower mid). Sharpe: 0.12 (top quartile). Sharpe: -0.23 (bottom quartile). Point 8 Information ratio: 0.00 (top quartile). Information ratio: 0.00 (upper mid). Information ratio: 0.00 (lower mid). Information ratio: 0.00 (bottom quartile). Information ratio: 0.00 (bottom quartile). Point 9 Yield to maturity (debt): 7.69% (bottom quartile). Yield to maturity (debt): 7.78% (upper mid). Yield to maturity (debt): 7.77% (lower mid). Yield to maturity (debt): 7.90% (top quartile). Yield to maturity (debt): 7.22% (bottom quartile). Point 10 Modified duration: 0.79 yrs (top quartile). Modified duration: 3.02 yrs (lower mid). Modified duration: 2.81 yrs (upper mid). Modified duration: 3.21 yrs (bottom quartile). Modified duration: 3.05 yrs (bottom quartile). UTI Banking & PSU Debt Fund
HDFC Banking and PSU Debt Fund
Kotak Banking and PSU Debt fund
ICICI Prudential Banking and PSU Debt Fund
Aditya Birla Sun Life Banking & PSU Debt Fund
سرفہرست 5 کریڈٹ رسک میوچل فنڈز
اوپرقرض کا خطرہ اے یو ایم/نیٹ اثاثوں کے ساتھ فنڈز> 500 کروڑ۔Fund NAV Net Assets (Cr) 3 MO (%) 6 MO (%) 1 YR (%) 3 YR (%) 2025 (%) Debt Yield (YTM) Mod. Duration Eff. Maturity SBI Credit Risk Fund Growth ₹49.3323
↑ 0.02 ₹2,175 2.8 4.6 7.3 7.9 7.9 8.7% 2Y 22D 2Y 8M 23D HDFC Credit Risk Debt Fund Growth ₹25.8694
↓ 0.00 ₹7,693 2.3 4 6.6 7.6 8 8.8% 2Y 2M 23D 3Y 5M 23D Kotak Credit Risk Fund Growth ₹31.6989
↑ 0.01 ₹768 2.2 3.4 6.6 7.6 9.1 8.95% 1Y 11M 5D 2Y 11M 5D Nippon India Credit Risk Fund Growth ₹37.8746
↑ 0.01 ₹1,486 2.3 4.1 7.1 8.2 8.9 9.12% 2Y 11D 2Y 5M 5D ICICI Prudential Regular Savings Fund Growth ₹34.5874
↑ 0.01 ₹6,212 2.5 3.8 7.8 8.4 9.5 8.93% 2Y 14D 3Y 1M 10D Note: Returns up to 1 year are on absolute basis & more than 1 year are on CAGR basis. as on 29 Jul 26 Research Highlights & Commentary of 5 Funds showcased
Commentary SBI Credit Risk Fund HDFC Credit Risk Debt Fund Kotak Credit Risk Fund Nippon India Credit Risk Fund ICICI Prudential Regular Savings Fund Point 1 Lower mid AUM (₹2,175 Cr). Highest AUM (₹7,693 Cr). Bottom quartile AUM (₹768 Cr). Bottom quartile AUM (₹1,486 Cr). Upper mid AUM (₹6,212 Cr). Point 2 Oldest track record among peers (22 yrs). Established history (12+ yrs). Established history (16+ yrs). Established history (21+ yrs). Established history (15+ yrs). Point 3 Top rated. Rating: 4★ (upper mid). Rating: 3★ (lower mid). Rating: 2★ (bottom quartile). Rating: 1★ (bottom quartile). Point 4 Risk profile: Moderate. Risk profile: Moderate. Risk profile: Moderately Low. Risk profile: Moderate. Risk profile: Moderate. Point 5 1Y return: 7.27% (upper mid). 1Y return: 6.65% (bottom quartile). 1Y return: 6.62% (bottom quartile). 1Y return: 7.08% (lower mid). 1Y return: 7.84% (top quartile). Point 6 1M return: 0.68% (lower mid). 1M return: 0.53% (bottom quartile). 1M return: 0.69% (upper mid). 1M return: 0.49% (bottom quartile). 1M return: 0.70% (top quartile). Point 7 Sharpe: 1.03 (lower mid). Sharpe: 0.73 (bottom quartile). Sharpe: 0.66 (bottom quartile). Sharpe: 1.22 (upper mid). Sharpe: 1.40 (top quartile). Point 8 Information ratio: 0.00 (top quartile). Information ratio: 0.00 (upper mid). Information ratio: 0.00 (lower mid). Information ratio: 0.00 (bottom quartile). Information ratio: 0.00 (bottom quartile). Point 9 Yield to maturity (debt): 8.70% (bottom quartile). Yield to maturity (debt): 8.80% (bottom quartile). Yield to maturity (debt): 8.95% (upper mid). Yield to maturity (debt): 9.12% (top quartile). Yield to maturity (debt): 8.93% (lower mid). Point 10 Modified duration: 2.06 yrs (bottom quartile). Modified duration: 2.23 yrs (bottom quartile). Modified duration: 1.93 yrs (top quartile). Modified duration: 2.03 yrs (upper mid). Modified duration: 2.04 yrs (lower mid). SBI Credit Risk Fund
HDFC Credit Risk Debt Fund
Kotak Credit Risk Fund
Nippon India Credit Risk Fund
ICICI Prudential Regular Savings Fund
ٹاپ 5 ڈائنامک بانڈ میوچل فنڈز
اوپرمتحرک بانڈ اے یو ایم/نیٹ اثاثوں کے ساتھ فنڈز> 500 کروڑ۔Fund NAV Net Assets (Cr) 3 MO (%) 6 MO (%) 1 YR (%) 3 YR (%) 2025 (%) Debt Yield (YTM) Mod. Duration Eff. Maturity SBI Dynamic Bond Fund Growth ₹37.513
↑ 0.02 ₹3,752 2 3.6 4.7 6.7 5.5 7.82% 3Y 7M 13D 5Y 4M 24D Axis Dynamic Bond Fund Growth ₹31.5205
↓ 0.00 ₹1,015 2.9 4.2 5.8 7.3 7.1 7.26% 5Y 10Y 9M 14D Bandhan Dynamic Bond Fund Growth ₹35.6664
↓ -0.11 ₹2,007 3.4 4.8 5.2 6.8 3.4 7.71% 7Y 11M 23D 21Y 3M 14D Aditya Birla Sun Life Dynamic Bond Fund Growth ₹48.9229
↓ -0.07 ₹1,495 2.4 3.4 4.8 7.2 7 8.08% 5Y 3M 18D 11Y 11M 8D HDFC Dynamic Debt Fund Growth ₹93.0928
↓ -0.09 ₹532 2.8 3.1 3.5 6.3 4.7 7.53% 7Y 4M 24D 19Y 8M 26D Note: Returns up to 1 year are on absolute basis & more than 1 year are on CAGR basis. as on 29 Jul 26 Research Highlights & Commentary of 5 Funds showcased
Commentary SBI Dynamic Bond Fund Axis Dynamic Bond Fund Bandhan Dynamic Bond Fund Aditya Birla Sun Life Dynamic Bond Fund HDFC Dynamic Debt Fund Point 1 Highest AUM (₹3,752 Cr). Bottom quartile AUM (₹1,015 Cr). Upper mid AUM (₹2,007 Cr). Lower mid AUM (₹1,495 Cr). Bottom quartile AUM (₹532 Cr). Point 2 Established history (22+ yrs). Established history (15+ yrs). Established history (17+ yrs). Established history (21+ yrs). Oldest track record among peers (29 yrs). Point 3 Top rated. Rating: 3★ (upper mid). Rating: 3★ (lower mid). Rating: 3★ (bottom quartile). Rating: 3★ (bottom quartile). Point 4 Risk profile: Moderate. Risk profile: Moderate. Risk profile: Moderate. Risk profile: Moderate. Risk profile: Moderate. Point 5 1Y return: 4.75% (bottom quartile). 1Y return: 5.79% (top quartile). 1Y return: 5.19% (upper mid). 1Y return: 4.81% (lower mid). 1Y return: 3.49% (bottom quartile). Point 6 1M return: 0.60% (top quartile). 1M return: 0.23% (upper mid). 1M return: -0.86% (bottom quartile). 1M return: -0.02% (bottom quartile). 1M return: 0.17% (lower mid). Point 7 Sharpe: -0.48 (bottom quartile). Sharpe: 0.14 (upper mid). Sharpe: 0.28 (top quartile). Sharpe: -0.06 (lower mid). Sharpe: -0.34 (bottom quartile). Point 8 Information ratio: 0.00 (top quartile). Information ratio: 0.00 (upper mid). Information ratio: 0.00 (lower mid). Information ratio: 0.00 (bottom quartile). Information ratio: 0.00 (bottom quartile). Point 9 Yield to maturity (debt): 7.82% (upper mid). Yield to maturity (debt): 7.26% (bottom quartile). Yield to maturity (debt): 7.71% (lower mid). Yield to maturity (debt): 8.08% (top quartile). Yield to maturity (debt): 7.53% (bottom quartile). Point 10 Modified duration: 3.62 yrs (top quartile). Modified duration: 5.00 yrs (upper mid). Modified duration: 7.98 yrs (bottom quartile). Modified duration: 5.30 yrs (lower mid). Modified duration: 7.40 yrs (bottom quartile). SBI Dynamic Bond Fund
Axis Dynamic Bond Fund
Bandhan Dynamic Bond Fund
Aditya Birla Sun Life Dynamic Bond Fund
HDFC Dynamic Debt Fund
سرفہرست 5 کارپوریٹ بانڈ میوچل فنڈز
اوپرکارپوریٹ بانڈ اے یو ایم/نیٹ اثاثوں کے ساتھ فنڈز> 500 کروڑ۔Fund NAV Net Assets (Cr) 3 MO (%) 6 MO (%) 1 YR (%) 3 YR (%) 2025 (%) Debt Yield (YTM) Mod. Duration Eff. Maturity Aditya Birla Sun Life Corporate Bond Fund Growth ₹119.43
↓ -0.07 ₹23,841 2.4 3.3 4.9 7.2 7.4 7.34% 4Y 1M 6D 6Y 7M 28D HDFC Corporate Bond Fund Growth ₹34.4096
↓ -0.01 ₹30,721 2.5 3.2 4.8 7.2 7.3 7.79% 4Y 18D 6Y 11M 12D ICICI Prudential Corporate Bond Fund Growth ₹31.8678
↓ -0.01 ₹30,030 2.3 3.4 5.8 7.5 8 7.91% 3Y 4M 10D 5Y 8M 23D Kotak Corporate Bond Fund Standard Growth ₹4,003.34
↓ -0.71 ₹14,997 2.1 3.1 5.1 7.3 7.8 7.99% 2Y 6M 29D 4Y Nippon India Prime Debt Fund Growth ₹63.6493
↓ -0.01 ₹9,433 2.2 3.3 5 7.3 7.8 7.9% 2Y 4M 6D 2Y 10M 13D Note: Returns up to 1 year are on absolute basis & more than 1 year are on CAGR basis. as on 29 Jul 26 Research Highlights & Commentary of 5 Funds showcased
Commentary Aditya Birla Sun Life Corporate Bond Fund HDFC Corporate Bond Fund ICICI Prudential Corporate Bond Fund Kotak Corporate Bond Fund Standard Nippon India Prime Debt Fund Point 1 Lower mid AUM (₹23,841 Cr). Highest AUM (₹30,721 Cr). Upper mid AUM (₹30,030 Cr). Bottom quartile AUM (₹14,997 Cr). Bottom quartile AUM (₹9,433 Cr). Point 2 Oldest track record among peers (29 yrs). Established history (16+ yrs). Established history (16+ yrs). Established history (18+ yrs). Established history (25+ yrs). Point 3 Top rated. Rating: 5★ (upper mid). Rating: 4★ (lower mid). Rating: 4★ (bottom quartile). Rating: 4★ (bottom quartile). Point 4 Risk profile: Moderately Low. Risk profile: Moderately Low. Risk profile: Moderately Low. Risk profile: Moderately Low. Risk profile: Moderately Low. Point 5 1Y return: 4.87% (bottom quartile). 1Y return: 4.76% (bottom quartile). 1Y return: 5.85% (top quartile). 1Y return: 5.08% (upper mid). 1Y return: 4.99% (lower mid). Point 6 1M return: 0.31% (bottom quartile). 1M return: 0.35% (bottom quartile). 1M return: 0.36% (upper mid). 1M return: 0.36% (lower mid). 1M return: 0.40% (top quartile). Point 7 Sharpe: -0.10 (lower mid). Sharpe: -0.14 (bottom quartile). Sharpe: 0.31 (top quartile). Sharpe: -0.10 (upper mid). Sharpe: -0.12 (bottom quartile). Point 8 Information ratio: 0.00 (top quartile). Information ratio: 0.00 (upper mid). Information ratio: 0.00 (lower mid). Information ratio: 0.00 (bottom quartile). Information ratio: 0.00 (bottom quartile). Point 9 Yield to maturity (debt): 7.34% (bottom quartile). Yield to maturity (debt): 7.79% (bottom quartile). Yield to maturity (debt): 7.91% (upper mid). Yield to maturity (debt): 7.99% (top quartile). Yield to maturity (debt): 7.90% (lower mid). Point 10 Modified duration: 4.10 yrs (bottom quartile). Modified duration: 4.05 yrs (bottom quartile). Modified duration: 3.36 yrs (lower mid). Modified duration: 2.58 yrs (upper mid). Modified duration: 2.35 yrs (top quartile). Aditya Birla Sun Life Corporate Bond Fund
HDFC Corporate Bond Fund
ICICI Prudential Corporate Bond Fund
Kotak Corporate Bond Fund Standard
Nippon India Prime Debt Fund
سرفہرست 5 گلٹ میوچل فنڈز
اوپر (Erstwhile DHFL Pramerica Credit Opportunities Fund) The investment objective of the Scheme is to generate income and capital appreciation by investing predominantly in corporate debt. There can be no assurance that the investment objective of the Scheme will be realized. Research Highlights for PGIM India Credit Risk Fund Below is the key information for PGIM India Credit Risk Fund Returns up to 1 year are on (Erstwhile Axis Fixed Income Opportunities Fund) To generate stable returns by investing in debt & money market instruments across the yield curve & credit spectrum. However, there is no assurance or guarantee that the investment objective of the Scheme will be achieved. The Scheme does not assure or guarantee any returns Research Highlights for Axis Credit Risk Fund Below is the key information for Axis Credit Risk Fund Returns up to 1 year are on (Erstwhile DHFL Pramerica Insta Cash Plus Fund) To generate steady returns along with high liquidity by investing in a portfolio of short-term, high quality money market and debt instruments. Research Highlights for PGIM India Insta Cash Fund Below is the key information for PGIM India Insta Cash Fund Returns up to 1 year are on The objective of the Scheme is to generate income through investment primarily in low duration debt & money market securities. There is no assurance or guarantee that the investment objective of the scheme will be achieved. Research Highlights for PGIM India Low Duration Fund Below is the key information for PGIM India Low Duration Fund Returns up to 1 year are on To provide a high level of liquidity with returns commensurate with low risk through a portfolio of money market and debt securities with maturity of up to 91days. However, there can be no assurance that the investment objective of the scheme will be achieved. Research Highlights for Indiabulls Liquid Fund Below is the key information for Indiabulls Liquid Fund Returns up to 1 year are on قابل اطلاق ہے۔ اے یو ایم/نیٹ اثاثوں کے ساتھ فنڈز> 500 کروڑ۔Fund NAV Net Assets (Cr) 3 MO (%) 6 MO (%) 1 YR (%) 3 YR (%) 2025 (%) Debt Yield (YTM) Mod. Duration Eff. Maturity ICICI Prudential Gilt Fund Growth ₹108.154
↓ -0.18 ₹8,785 3.2 3.1 4.2 7.1 6.8 7.71% 9Y 4M 10D 21Y 7M 6D SBI Magnum Constant Maturity Fund Growth ₹66.6847
↓ -0.10 ₹1,666 3.1 3 3.8 7.1 6.7 7.23% 6Y 9M 14D 9Y 6M 11D SBI Magnum Gilt Fund Growth ₹68.3762
↑ 0.00 ₹8,455 2.2 2.9 3.4 6.4 4.5 6.89% 5Y 10M 28D 10Y 1M 20D Nippon India Gilt Securities Fund Growth ₹39.0691
↓ -0.08 ₹1,592 2.9 3 2.5 5.9 3.7 7.45% 8Y 7M 28D 21Y 3M 14D Aditya Birla Sun Life Government Securities Fund Growth ₹81.9428
↓ -0.20 ₹1,376 2.8 2 1.1 5.4 3 7.49% 11Y 7M 20D 33Y 6M 18D Note: Returns up to 1 year are on absolute basis & more than 1 year are on CAGR basis. as on 29 Jul 26 Research Highlights & Commentary of 5 Funds showcased
Commentary ICICI Prudential Gilt Fund SBI Magnum Constant Maturity Fund SBI Magnum Gilt Fund Nippon India Gilt Securities Fund Aditya Birla Sun Life Government Securities Fund Point 1 Highest AUM (₹8,785 Cr). Lower mid AUM (₹1,666 Cr). Upper mid AUM (₹8,455 Cr). Bottom quartile AUM (₹1,592 Cr). Bottom quartile AUM (₹1,376 Cr). Point 2 Oldest track record among peers (26 yrs). Established history (25+ yrs). Established history (25+ yrs). Established history (17+ yrs). Established history (26+ yrs). Point 3 Top rated. Rating: 4★ (upper mid). Rating: 4★ (lower mid). Rating: 4★ (bottom quartile). Rating: 4★ (bottom quartile). Point 4 Risk profile: Moderate. Risk profile: Moderately Low. Risk profile: Moderate. Risk profile: Moderate. Risk profile: Moderate. Point 5 1Y return: 4.23% (top quartile). 1Y return: 3.84% (upper mid). 1Y return: 3.37% (lower mid). 1Y return: 2.48% (bottom quartile). 1Y return: 1.05% (bottom quartile). Point 6 1M return: 0.04% (lower mid). 1M return: 0.35% (top quartile). 1M return: 0.14% (upper mid). 1M return: -0.41% (bottom quartile). 1M return: -0.79% (bottom quartile). Point 7 Sharpe: -0.14 (top quartile). Sharpe: -0.42 (lower mid). Sharpe: -0.51 (bottom quartile). Sharpe: -0.37 (upper mid). Sharpe: -0.42 (bottom quartile). Point 8 Information ratio: 0.00 (top quartile). Information ratio: 0.00 (upper mid). Information ratio: 0.00 (lower mid). Information ratio: 0.00 (bottom quartile). Information ratio: 0.00 (bottom quartile). Point 9 Yield to maturity (debt): 7.71% (top quartile). Yield to maturity (debt): 7.23% (bottom quartile). Yield to maturity (debt): 6.89% (bottom quartile). Yield to maturity (debt): 7.45% (lower mid). Yield to maturity (debt): 7.49% (upper mid). Point 10 Modified duration: 9.36 yrs (bottom quartile). Modified duration: 6.79 yrs (upper mid). Modified duration: 5.91 yrs (top quartile). Modified duration: 8.66 yrs (lower mid). Modified duration: 11.64 yrs (bottom quartile). ICICI Prudential Gilt Fund
SBI Magnum Constant Maturity Fund
SBI Magnum Gilt Fund
Nippon India Gilt Securities Fund
Aditya Birla Sun Life Government Securities Fund
1. PGIM India Credit Risk Fund
PGIM India Credit Risk Fund
Growth Launch Date 29 Sep 14 NAV (21 Jan 22) ₹15.5876 ↑ 0.00 (0.01 %) Net Assets (Cr) ₹39 on 31 Dec 21 Category Debt - Credit Risk AMC Pramerica Asset Managers Private Limited Rating ☆☆☆☆☆ Risk Moderate Expense Ratio 1.85 Sharpe Ratio 1.73 Information Ratio 0 Alpha Ratio 0 Min Investment 5,000 Min SIP Investment 1,000 Exit Load 0-1 Years (1%),1 Years and above(NIL) Yield to Maturity 5.01% Effective Maturity 7 Months 2 Days Modified Duration 6 Months 14 Days Growth of 10,000 investment over the years.
Date Value 30 Jun 21 ₹10,000 Returns for PGIM India Credit Risk Fund
absolute basis & more than 1 year are on CAGR (Compound Annual Growth Rate) basis. as on 21 Jan 22 Duration Returns 1 Month 0.3% 3 Month 0.6% 6 Month 4.4% 1 Year 8.4% 3 Year 3% 5 Year 4.2% 10 Year 15 Year Since launch 6.3% Historical performance (Yearly) on absolute basis
Year Returns 2025 2024 2023 2022 2021 2020 2019 2018 2017 2016 Fund Manager information for PGIM India Credit Risk Fund
Name Since Tenure Data below for PGIM India Credit Risk Fund as on 31 Dec 21
Asset Allocation
Asset Class Value Debt Sector Allocation
Sector Value Credit Quality
Rating Value Top Securities Holdings / Portfolio
Name Holding Value Quantity 2. Axis Credit Risk Fund
Axis Credit Risk Fund
Growth Launch Date 15 Jul 14 NAV (29 Jul 26) ₹23.2682 ↑ 0.01 (0.04 %) Net Assets (Cr) ₹362 on 30 Jun 26 Category Debt - Credit Risk AMC Axis Asset Management Company Limited Rating ☆☆☆☆☆ Risk Moderate Expense Ratio 1.57 Sharpe Ratio 1.23 Information Ratio 0 Alpha Ratio 0 Min Investment 5,000 Min SIP Investment 1,000 Exit Load 0-12 Months (1%),12 Months and above(NIL) Yield to Maturity 8.91% Effective Maturity 2 Years 7 Months 6 Days Modified Duration 2 Years 2 Months 8 Days Growth of 10,000 investment over the years.
Date Value 30 Jun 21 ₹10,000 30 Jun 22 ₹10,361 30 Jun 23 ₹11,079 30 Jun 24 ₹11,871 30 Jun 25 ₹12,950 30 Jun 26 ₹13,972 Returns for Axis Credit Risk Fund
absolute basis & more than 1 year are on CAGR (Compound Annual Growth Rate) basis. as on 21 Jan 22 Duration Returns 1 Month 0.7% 3 Month 2.7% 6 Month 4.5% 1 Year 7.8% 3 Year 8.1% 5 Year 6.9% 10 Year 15 Year Since launch 7.3% Historical performance (Yearly) on absolute basis
Year Returns 2025 8.7% 2024 8% 2023 7% 2022 4% 2021 6% 2020 8.2% 2019 4.4% 2018 5.9% 2017 6.4% 2016 9.8% Fund Manager information for Axis Credit Risk Fund
Name Since Tenure Devang Shah 15 Jul 14 11.97 Yr. Akhil Thakker 9 Nov 21 4.64 Yr. Data below for Axis Credit Risk Fund as on 30 Jun 26
Asset Allocation
Asset Class Value Cash 6.06% Equity 7.7% Debt 85.73% Other 0.51% Debt Sector Allocation
Sector Value Corporate 76.29% Government 9.44% Cash Equivalent 6.06% Credit Quality
Rating Value A 18.98% AA 63.6% AAA 17.42% Top Securities Holdings / Portfolio
Name Holding Value Quantity Jubilant Bevco Limited
Debentures | -5% ₹17 Cr 1,500 Jtpm Metal TRaders Limited
Debentures | -4% ₹16 Cr 1,500 Narayana Hrudayalaya Limited
Debentures | -4% ₹15 Cr 1,500 Infopark Properties Limited
Debentures | -4% ₹15 Cr 1,500 Aditya Birla Digital Fashion Ventures Limited
Debentures | -4% ₹15 Cr 1,500 Altius Telecom Infrastructure Trust
Debentures | -4% ₹15 Cr 1,500 Vedanta Limited
Debentures | -3% ₹12 Cr 1,200 GMR Airports Limited
Debentures | -3% ₹10 Cr 1,000 GMR Hyderabad International Airport Ltd
Debentures | -3% ₹10 Cr 1,000 Jsw Kalinga Steel Limited
Debentures | -3% ₹10 Cr 1,000 3. PGIM India Insta Cash Fund
PGIM India Insta Cash Fund
Growth Launch Date 5 Sep 07 NAV (29 Jul 26) ₹363.068 ↑ 0.06 (0.02 %) Net Assets (Cr) ₹748 on 30 Jun 26 Category Debt - Liquid Fund AMC Pramerica Asset Managers Private Limited Rating ☆☆☆☆☆ Risk Low Expense Ratio 0.25 Sharpe Ratio 2.28 Information Ratio 0.92 Alpha Ratio 0 Min Investment 5,000 Min SIP Investment 1,000 Exit Load NIL Yield to Maturity 6.57% Effective Maturity 1 Month 10 Days Modified Duration 1 Month 10 Days Growth of 10,000 investment over the years.
Date Value 30 Jun 21 ₹10,000 30 Jun 22 ₹10,356 30 Jun 23 ₹11,018 30 Jun 24 ₹11,815 30 Jun 25 ₹12,665 30 Jun 26 ₹13,462 Returns for PGIM India Insta Cash Fund
absolute basis & more than 1 year are on CAGR (Compound Annual Growth Rate) basis. as on 21 Jan 22 Duration Returns 1 Month 0.5% 3 Month 1.6% 6 Month 3.4% 1 Year 6.3% 3 Year 6.9% 5 Year 6.2% 10 Year 15 Year Since launch 7.1% Historical performance (Yearly) on absolute basis
Year Returns 2025 6.5% 2024 7.3% 2023 7% 2022 4.8% 2021 3.3% 2020 4.2% 2019 6.7% 2018 7.4% 2017 6.7% 2016 7.7% Fund Manager information for PGIM India Insta Cash Fund
Name Since Tenure Puneet Pal 16 Jul 22 3.96 Yr. Akhil Dhar 25 Feb 26 0.34 Yr. Data below for PGIM India Insta Cash Fund as on 30 Jun 26
Asset Allocation
Asset Class Value Cash 93.34% Debt 6.36% Other 0.3% Debt Sector Allocation
Sector Value Cash Equivalent 80.48% Government 9.72% Corporate 9.5% Credit Quality
Rating Value AAA 100% Top Securities Holdings / Portfolio
Name Holding Value Quantity Clearing Corporation Of India Ltd.
CBLO/Reverse Repo | -12% ₹96 Cr Bajaj Housing Finance Limited
Debentures | -7% ₹55 Cr 5,500,000
↑ 5,500,000 Net Receivables / (Payables)
Net Current Assets | -6% ₹50 Cr Small Industries Development Bank Of India
Debentures | -6% ₹50 Cr 5,000,000
↑ 5,000,000 Indian Bank
Domestic Bonds | -6% ₹49 Cr 5,000,000
↑ 5,000,000 Housing And Urban Development Corporation Limited
Debentures | -6% ₹47 Cr 4,700,000 Aditya Birla Money Ltd.
Commercial Paper | -5% ₹39 Cr 4,000,000
↑ 4,000,000 Icici Securities Limited
Commercial Paper | -4% ₹34 Cr 3,500,000
↑ 3,500,000 India (Republic of)
- | -3% ₹27 Cr 2,700,000 Rec Limited
Debentures | -3% ₹25 Cr 2,500,000
↑ 2,500,000 4. PGIM India Low Duration Fund
PGIM India Low Duration Fund
Growth Launch Date 22 Jun 07 NAV (29 Sep 23) ₹26.0337 ↑ 0.01 (0.06 %) Net Assets (Cr) ₹104 on 31 Aug 23 Category Debt - Low Duration AMC Pramerica Asset Managers Private Limited Rating ☆☆☆☆☆ Risk Moderate Expense Ratio 1.18 Sharpe Ratio -1.66 Information Ratio 0 Alpha Ratio 0 Min Investment 5,000 Min SIP Investment 1,000 Exit Load NIL Yield to Maturity 7.34% Effective Maturity 7 Months 17 Days Modified Duration 6 Months 11 Days Growth of 10,000 investment over the years.
Date Value 30 Jun 21 ₹10,000 30 Jun 22 ₹10,290 30 Jun 23 ₹10,897 Returns for PGIM India Low Duration Fund
absolute basis & more than 1 year are on CAGR (Compound Annual Growth Rate) basis. as on 21 Jan 22 Duration Returns 1 Month 0.5% 3 Month 1.5% 6 Month 3.3% 1 Year 6.3% 3 Year 4.5% 5 Year 1.3% 10 Year 15 Year Since launch 6.1% Historical performance (Yearly) on absolute basis
Year Returns 2025 2024 2023 2022 2021 2020 2019 2018 2017 2016 Fund Manager information for PGIM India Low Duration Fund
Name Since Tenure Data below for PGIM India Low Duration Fund as on 31 Aug 23
Asset Allocation
Asset Class Value Debt Sector Allocation
Sector Value Credit Quality
Rating Value Top Securities Holdings / Portfolio
Name Holding Value Quantity 5. Indiabulls Liquid Fund
Indiabulls Liquid Fund
Growth Launch Date 27 Oct 11 NAV (29 Jul 26) ₹2,696.21 ↑ 0.50 (0.02 %) Net Assets (Cr) ₹279 on 30 Jun 26 Category Debt - Liquid Fund AMC Indiabulls Asset Management Company Ltd. Rating ☆☆☆☆☆ Risk Low Expense Ratio 0.2 Sharpe Ratio 2.39 Information Ratio 1.08 Alpha Ratio 0.04 Min Investment 500 Min SIP Investment 500 Exit Load NIL Yield to Maturity 6.41% Effective Maturity 26 Days Modified Duration 26 Days Growth of 10,000 investment over the years.
Date Value 30 Jun 21 ₹10,000 30 Jun 22 ₹10,329 30 Jun 23 ₹10,957 30 Jun 24 ₹11,753 30 Jun 25 ₹12,601 30 Jun 26 ₹13,392 Returns for Indiabulls Liquid Fund
absolute basis & more than 1 year are on CAGR (Compound Annual Growth Rate) basis. as on 21 Jan 22 Duration Returns 1 Month 0.5% 3 Month 1.6% 6 Month 3.3% 1 Year 6.3% 3 Year 6.9% 5 Year 6.1% 10 Year 15 Year Since launch 6.9% Historical performance (Yearly) on absolute basis
Year Returns 2025 6.6% 2024 7.4% 2023 6.8% 2022 4.6% 2021 3.1% 2020 3.9% 2019 6.6% 2018 7.3% 2017 6.7% 2016 7.8% Fund Manager information for Indiabulls Liquid Fund
Name Since Tenure Kaustubh Sule 11 May 23 3.14 Yr. Wilfred Gonsalves 4 May 26 0.16 Yr. Data below for Indiabulls Liquid Fund as on 30 Jun 26
Asset Allocation
Asset Class Value Cash 99.71% Debt 0.29% Debt Sector Allocation
Sector Value Cash Equivalent 70.54% Corporate 26.3% Government 3.16% Credit Quality
Rating Value AAA 99.65% Top Securities Holdings / Portfolio
Name Holding Value Quantity Reverse Repo 16-Jun-26
CBLO/Reverse Repo | -18% ₹44 Cr Canara Bank
Domestic Bonds | -10% ₹25 Cr 2,500,000 HDFC Bank Limited
Certificate of Deposit | -10% ₹25 Cr 2,500,000 Hindustan Petroleum Corp Ltd.
Commercial Paper | -10% ₹24 Cr 2,400,000
↑ 2,400,000 Union Bank Of India
Certificate of Deposit | -10% ₹24 Cr 2,400,000
↑ 2,400,000 Bajaj Finance Ltd.
Commercial Paper | -9% ₹22 Cr 2,200,000
↑ 2,200,000 Kotak Mahindra Prime Limited
Commercial Paper | -8% ₹20 Cr 2,000,000
↑ 2,000,000 Punjab National Bank
Debentures | -6% ₹15 Cr 1,500,000
↑ 1,500,000 Axis Bank Limited
Certificate of Deposit | -6% ₹15 Cr 1,500,000
↑ 1,500,000 Small Industries Development Bank of India
Commercial Paper | -6% ₹15 Cr 1,500,000
↑ 1,500,000
بہترین ڈیبٹ میوچل فنڈز کا اندازہ کیسے لگایا جائے۔
بہترین قرض کے فنڈز کو منتخب کرنے کے لیے جس میں آپ سرمایہ کاری کرنا چاہتے ہیں، کچھ اہم پیرامیٹرز پر غور کرنا ضروری ہے جیسے کہ اوسط میچورٹی، کریڈٹ کوالٹی، AUM، اخراجات کا تناسب، ٹیکس کا اثر وغیرہ۔ آئیے ایک گہرائی سے جائزہ لیتے ہیں۔ -
1. اوسط میچورٹی/دورانیہ
اوسط میچورٹی ڈیٹ فنڈز میں ایک ضروری پیرامیٹر ہے جسے بعض اوقات سرمایہ کاروں کی طرف سے نظر انداز کیا جاتا ہے، جو اس میں شامل خطرات پر غور کیے بغیر طویل مدت تک سرمایہ کاری کرتے ہیں۔ سرمایہ کاروں کو اپنے ڈیٹ فنڈ کی سرمایہ کاری کا فیصلہ اس کی میچورٹی مدت کی بنیاد پر کرنا ہوتا ہے، سرمایہ کاری کی مدت کو ڈیٹ فنڈ کی میچورٹی مدت کے ساتھ ملانا یہ یقینی بنانے کا ایک اچھا طریقہ ہے کہ آپ غیر ضروری خطرہ مول نہ لیں۔ اس طرح، یہ مشورہ دیا جاتا ہے کہ ڈیٹ فنڈز میں زیادہ سے زیادہ رسک ریٹرن حاصل کرنے کے لیے، سرمایہ کاری کرنے سے پہلے، ڈیٹ فنڈ کی اوسط میچورٹی جان لیں۔ اوسط میچورٹی (دورانیہ اسی طرح کا عنصر ہے) کو دیکھنا ضروری ہے، مثال کے طور پر، ایک مائع فنڈ کی اوسط میچورٹی چند دنوں سے لے کر شاید ایک ماہ تک ہو سکتی ہے، اس کا مطلب یہ ہوگا کہ یہ ایک ایسے سرمایہ کار کے لیے بہترین آپشن ہے جو تلاش کر رہا ہے۔ چند دنوں کے لیے پیسہ لگانا۔ اسی طرح، اگر آپ ایک سال کے ٹائم فریم کو دیکھ رہے ہیں۔سرمایہ کاری کا منصوبہ پھر، ایک مختصر مدت کے قرض فنڈ مثالی ہو سکتا ہے.
2. شرح سود کا منظرنامہ
ڈیٹ فنڈز میں مارکیٹ کے ماحول کو سمجھنا بہت ضروری ہے جو شرح سود اور اس کے اتار چڑھاو سے متاثر ہوتے ہیں۔ جب معیشت میں شرح سود بڑھ جاتی ہے تو بانڈ کی قیمت گرتی ہے اور اس کے برعکس۔ اس کے علاوہ، اس وقت کے دوران جب شرح سود میں اضافہ ہوتا ہے، نئے بانڈز پرانے بانڈز سے زیادہ پیداوار کے ساتھ مارکیٹ میں جاری کیے جاتے ہیں، جس سے وہ پرانے بانڈز کم قیمت کے ہوتے ہیں۔ لہذا، سرمایہ کار مارکیٹ میں نئے بانڈز کی طرف زیادہ متوجہ ہوتے ہیں اور پرانے بانڈز کی دوبارہ قیمتوں کا تعین بھی ہوتا ہے۔ اگر کسی ڈیٹ فنڈ میں اس طرح کے "پرانے بانڈز" کی نمائش ہو رہی ہے تو جب شرح سود میں اضافہ ہوتا ہے،نہیں ہیں قرض فنڈ پر منفی اثر پڑے گا۔ مزید برآں، چونکہ قرض کے فنڈز شرح سود میں اتار چڑھاؤ کا شکار ہوتے ہیں، اس سے فنڈ پورٹ فولیو میں بنیادی بانڈز کی قیمتوں میں خلل پڑتا ہے۔ مثال کے طور پر، سود کی بڑھتی ہوئی شرحوں کے دوران طویل مدتی قرض کے فنڈز زیادہ خطرے میں ہوتے ہیں۔ اس وقت کے دوران قلیل مدتی سرمایہ کاری کا منصوبہ بنانے سے آپ کی شرح سود کے خطرات کم ہو جائیں گے۔
اگر کسی کو شرح سود کا اچھی طرح علم ہے اور وہ اس کی نگرانی کر سکتا ہے تو کوئی اس سے فائدہ بھی اٹھا سکتا ہے۔ گرتی ہوئی شرح سود کی مارکیٹ میں، طویل مدتی قرض کے فنڈز ایک اچھا انتخاب ہوگا۔ تاہم، شرح سود میں اضافے کے دوران، مختصر مدت کے فنڈز جیسے کم اوسط میچورٹی والے فنڈز میں ہونا دانشمندی ہوگی،الٹرا شارٹ ٹرم فنڈ یا یہاں تک کہ مائع فنڈز۔
3. موجودہ پیداوار یا پورٹ فولیو کی پیداوار
پیداوار پورٹ فولیو میں بانڈز سے پیدا ہونے والی سود کی آمدنی کا ایک پیمانہ ہے۔ وہ فنڈز جو قرض یا بانڈز میں سرمایہ کاری کرتے ہیں جن کی شرح زیادہ ہے۔کوپن کی شرح (یا پیداوار) کی مجموعی پورٹ فولیو کی پیداوار زیادہ ہوگی۔ پختگی کی پیداوار (ytmقرض میوچل فنڈ کا ) فنڈ کی چل رہی پیداوار کی نشاندہی کرتا ہے۔ YTM کی بنیاد پر قرض کے فنڈز کا موازنہ کرتے وقت، اس حقیقت کو بھی دیکھنا چاہیے کہ اضافی پیداوار کیسے حاصل ہو رہی ہے۔ کیا یہ کم پورٹ فولیو کے معیار کی قیمت پر ہے؟ اتنے اچھے معیار کے آلات میں سرمایہ کاری کے اپنے مسائل ہیں۔ آپ قرض فنڈ میں سرمایہ کاری ختم نہیں کرنا چاہتے جس میں ایسے بانڈز یا سیکیورٹیز ہوں جو ہو سکتی ہیں۔طے شدہ بعد میں. لہذا، ہمیشہ پورٹ فولیو کی پیداوار کو دیکھیں اور اسے کریڈٹ کے معیار کے ساتھ متوازن رکھیں۔
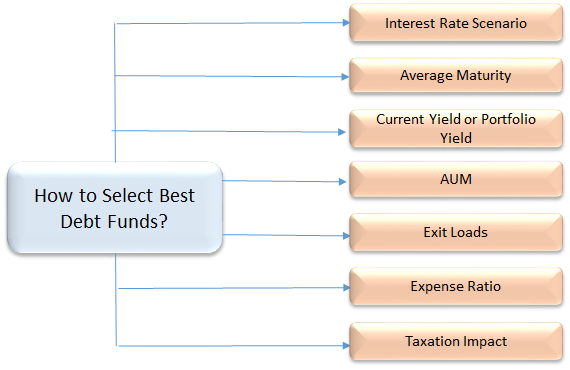
4. پورٹ فولیو کا کریڈٹ کوالٹی
بہترین ڈیٹ فنڈز میں سرمایہ کاری کرنے کے لیے، بانڈز اور ڈیٹ سیکیورٹیز کے کریڈٹ کوالٹی کو چیک کرنا ایک ضروری پیرامیٹر ہے۔ بانڈز کو مختلف ایجنسیوں کی طرف سے ان کی رقم واپس کرنے کی صلاحیت کی بنیاد پر کریڈٹ ریٹنگ تفویض کی جاتی ہے۔ AAA ریٹنگ والا بانڈ بہترین کریڈٹ ریٹنگ سمجھا جاتا ہے اور اس کا مطلب ایک محفوظ اور محفوظ سرمایہ کاری بھی ہے۔ اگر کوئی صحیح معنوں میں حفاظت چاہتا ہے اور اسے بہترین قرض فنڈ کے انتخاب میں سب سے اہم پیرامیٹر سمجھتا ہے، تو بہت ہی اعلیٰ معیار کے قرض کے آلات (AAA یا AA+) والے فنڈ میں جانا مطلوبہ آپشن ہو سکتا ہے۔
5. انتظام کے تحت اثاثے (AUM)
بہترین قرض فنڈز کا انتخاب کرتے وقت یہ سب سے اہم پیرامیٹر ہے۔ AUM تمام سرمایہ کاروں کے ذریعہ کسی خاص اسکیم میں لگائی گئی کل رقم ہے۔ چونکہ، زیادہ ترباہمی چندہڈیٹ فنڈز میں کل AUM کی سرمایہ کاری کی جاتی ہے، سرمایہ کاروں کو اسکیم کے اثاثوں کو منتخب کرنے کی ضرورت ہوتی ہے جن میں کافی AUM ہو۔ ایک ایسے فنڈ میں ہونا جس میں کارپوریٹس کا بڑا ایکسپوژر ہو، خطرناک ہوسکتا ہے، کیونکہ ان کی واپسی بڑی ہوسکتی ہے جس سے فنڈ کی مجموعی کارکردگی متاثر ہوسکتی ہے۔
6. اخراجات کا تناسب
ڈیٹ فنڈز میں ایک اہم عنصر جس پر غور کیا جائے وہ اس کے اخراجات کا تناسب ہے۔ اخراجات کا زیادہ تناسب فنڈز کی کارکردگی پر بڑا اثر ڈالتا ہے۔ مثال کے طور پر، مائع فنڈز میں سب سے کم اخراجات کا تناسب ہوتا ہے جو 50 bps تک ہوتا ہے (BPS شرح سود کی پیمائش کرنے کے لیے ایک یونٹ ہے جس میں ایک bps 1% کے 1/100th کے برابر ہے) جبکہ دیگر قرض فنڈز 150 bps تک چارج کر سکتے ہیں۔ لہذا ایک قرض میوچل فنڈ کے درمیان انتخاب کرنے کے لیے، انتظامی فیس یا فنڈ چلانے کے اخراجات پر غور کرنا ضروری ہے۔
7. ٹیکس کے اثرات
ڈیبٹ فنڈز انڈیکسیشن فوائد کے ساتھ طویل مدتی سرمائے کے فوائد (3 سال سے زیادہ) کا فائدہ پیش کرتے ہیں۔ اور قلیل مدتی سرمایہ نفع (3 سال سے کم) پر 30% ٹیکس لگایا جاتا ہے۔
ایک سرمایہ کار کے طور پر غور کرنے کی چیزیں
1. فنڈ کے مقاصد
ڈیبٹ فنڈ کا مقصد مختلف قسم کی سیکیورٹیز کے متنوع پورٹ فولیو کو برقرار رکھ کر زیادہ سے زیادہ منافع کمانا ہے۔ آپ ان سے توقع کر سکتے ہیں کہ وہ پیش قیاسی انداز میں کارکردگی کا مظاہرہ کریں۔ یہی وجہ ہے کہ قرض کے فنڈز قدامت پسند سرمایہ کاروں میں مقبول ہیں۔
2. فنڈ کی اقسام
ڈیبٹ فنڈز کو مزید مختلف زمروں میں تقسیم کیا گیا ہے جیسے مائع فنڈز،ماہانہ آمدنی کا منصوبہ (MIP)، فکسڈ میچورٹی پلانز (FMP)،ڈائنامک بانڈ فنڈز، انکم فنڈز، کریڈٹ مواقع فنڈز، GILT فنڈز، شارٹ ٹرم فنڈز اور الٹرا شارٹ ٹرم فنڈز۔
3. خطرات
قرض کے فنڈز بنیادی طور پر شرح سود کے خطرے، کریڈٹ رسک، اورلیکویڈیٹی خطرہ سود کی شرح کی مجموعی نقل و حرکت کی وجہ سے فنڈ کی قیمت میں اتار چڑھاؤ آ سکتا ہے۔ جاری کنندہ کے ذریعہ سود اور پرنسپل کی ادائیگی میں ڈیفالٹ کا خطرہ ہے۔ لیکویڈیٹی کا خطرہ اس وقت ہوتا ہے جب فنڈ مینیجر مانگ کی کمی کی وجہ سے بنیادی سیکیورٹی فروخت کرنے سے قاصر ہوتا ہے۔
4. لاگت
ڈیبٹ فنڈز آپ کے پیسے کا انتظام کرنے کے لیے اخراجات کا تناسب لیتے ہیں۔ اب تکSEBI نے اخراجات کے تناسب کی بالائی حد کو 2.25% لازمی قرار دیا تھا (ضابطوں کے ساتھ وقتاً فوقتاً تبدیل ہو سکتا ہے۔)
5. سرمایہ کاری افق
مائع فنڈز کے لیے 3 ماہ سے 1 سال کی سرمایہ کاری مثالی ہوگی۔ اگر آپ کے پاس 2 سے 3 سال کا طویل افق ہے، تو آپ مختصر مدت کے بانڈ فنڈز کے لیے جا سکتے ہیں۔
6. مالی اہداف
ڈیبٹ فنڈز کا استعمال مختلف اہداف حاصل کرنے کے لیے کیا جا سکتا ہے جیسے اضافی آمدنی حاصل کرنا یا لیکویڈیٹی کے مقصد کے لیے۔
آن لائن بہترین ڈیبٹ فنڈز میں سرمایہ کاری کیسے کریں؟
Fincash.com پر لائف ٹائم کے لیے مفت انویسٹمنٹ اکاؤنٹ کھولیں۔
اپنی رجسٹریشن اور KYC کا عمل مکمل کریں۔
دستاویزات اپ لوڈ کریں (PAN، آدھار، وغیرہ)۔اور، آپ سرمایہ کاری کے لیے تیار ہیں!
نتیجہ
ڈیبٹ فنڈز آپ کے پیسے کی سرمایہ کاری کرنے اور آپ کے مماثل متعلقہ پروڈکٹ کو منتخب کرکے مستقل بنیادوں پر آمدنی پیدا کرنے کا ایک بہترین طریقہ ہے۔رسک پروفائل. لہذا، سرمایہ کار جو مستقل آمدنی پیدا کرنا چاہتے ہیں یا قرض کی منڈیوں سے فائدہ اٹھانا چاہتے ہیں، 2022 - 2023 کے لیے اوپر دیے گئے بہترین قرض فنڈز پر غور کر سکتے ہیں اور سرمایہ کاری شروع کر سکتے ہیں!_
یہاں فراہم کردہ معلومات کے درست ہونے کو یقینی بنانے کے لیے تمام کوششیں کی گئی ہیں۔ تاہم، ڈیٹا کی درستگی کے حوالے سے کوئی ضمانت نہیں دی جاتی ہے۔ براہ کرم کوئی بھی سرمایہ کاری کرنے سے پہلے اسکیم کی معلومات کے دستاویز کے ساتھ تصدیق کریں۔
You Might Also Like


AMFI Registration No. 112358 | CIN: U74999MH2016PTC282153
Shepard Technologies Pvt. Ltd. (with ARN code 112358) makes no warranties or representations, express or implied, on products offered through the platform. It accepts no liability for any damages or losses, however caused, in connection with the use of, or on the reliance of its product or related services. Terms and conditions of the website are applicable.
©2026 Shepard Technologies Private Limited. All Rights Reserved
The article is nice and informative but it could be in more simple words because lot of people have much less knowledge in such sector