ریٹائرمنٹ کیلکولیٹر: اندازہ لگائیں اور سرمایہ کاری کریں۔
ریٹائرمنٹ کیلکولیٹر ان لوگوں کے لیے ایک ٹول ہے جو ایک مخصوص معیار زندگی کو برقرار رکھنے کے لیے ریٹائرمنٹ کے بعد درکار کارپس کے بارے میں جاننے کے خواہشمند ہیں۔ ریٹائرمنٹ کیلکولیٹر کو ایک ضروری عنصر سمجھا جاتا ہے جبریٹائرمنٹ کی منصوبہ بندی. یہ آپ کو اپنے موجودہ مالی حالات کی بنیاد پر اپنی ریٹائرمنٹ کے لیے اس تخمینی رقم کی نشاندہی کرنے میں مدد کرتا ہے جسے آپ کو بچانے کی ضرورت ہے۔ لہذا، ہم آپ کو ایک بہت ہی آسان ریٹائرمنٹ کیلکولیٹر کے ذریعے لے جاتے ہیں جو آپ کو ریٹائرمنٹ کے وقت درکار کارپس کا اندازہ لگانے میں مدد کرے گا۔
ریٹائرمنٹ کیلکولیٹر کو سمجھنا
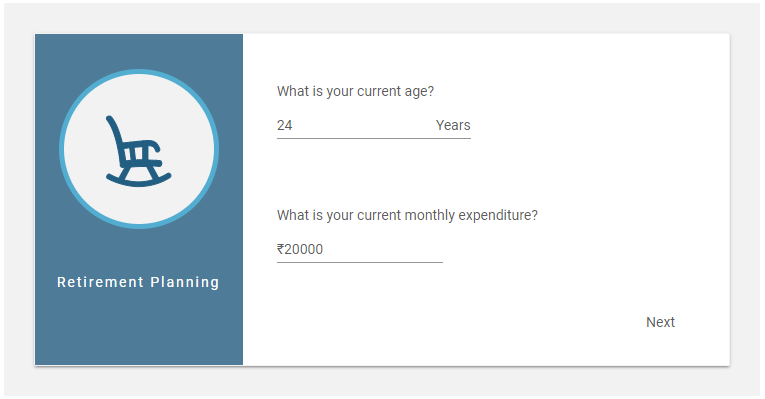
ریٹائرمنٹ کیلکولیٹر استعمال کرتے وقت، آپ کو کچھ متغیرات درج کرنے کی ضرورت ہوگی، جیسے-
- آپ کی موجودہ عمر
- آپ کے موجودہ ماہانہ اخراجات
- متوقعمہنگائی آنے والے سالوں کے لیے شرح (سالانہ)
- سرمایہ کاری پر طویل مدتی ترقی کی شرح
یہ تمام متغیرات جب کیلکولیٹر میں کھلائے جائیں گے تو وہ رقم ختم ہو جائے گی جو آپ کو معیار زندگی کو برقرار رکھنے کے لیے اپنی ریٹائرمنٹ کے لیے ماہانہ سرمایہ کاری کرنے کی ضرورت ہے۔ (یعنی آپ کے موجودہ ماہانہ زندگی کے اخراجات افراط زر کے لیے ایڈجسٹ کیے گئے ہیں)۔
ریٹائرمنٹ کیلکولیٹر: تشخیص کا عمل
1. اپنے موجودہ ماہانہ اخراجات کا حساب لگانا
یہاں آپ کو سب سے پہلے جو کام کرنے کی ضرورت ہے وہ یہ ہے کہ اپنے ماہانہ اخراجات جیسے گھریلو اخراجات، یوٹیلیٹی اخراجات، نقل و حمل کی لاگت، اور طرز زندگی کے دیگر اخراجات کا حساب لگائیں۔ اس کے علاوہ، آپ کو متفرق اخراجات کے لیے ماہانہ درکار کم از کم رقم کے بارے میں کوئی نہ کوئی اندازہ ہونا چاہیے۔ یہاں بنیادی مفروضہ یہ ہے کہ مہنگائی کے لیے ایڈجسٹ کیے گئے یہ اخراجات مستقبل میں ریٹائر ہونے کے بعد آرام دہ زندگی گزارنے کے لیے کافی ہوں گے۔
*وضاحت کرنا- *
- گھریلو اخراجات -10 روپے،000
- نقل و حمل کے اخراجات-INR 2,000
- یوٹیلیٹی اخراجات-** INR 3,000**
- طرز زندگی کے دیگر اخراجات (فلمیں، کھانے وغیرہ) -INR 3,000
- متفرق اخراجات-2000 روپے
کل ماہانہ اخراجات-INR 20,000
Know Your Monthly SIP Amount
2. آنے والے سالوں کے لیے افراط زر کی شرح کو سمجھیں۔
یہ اوسط سالانہ افراط زر کی شرح ہے جس کی آپ کو توقع ہے کہ آنے والے سالوں میں آپ کے ریٹائر ہونے تک۔ مختلف کے مطابقمارکیٹ ذرائع کے مطابق اوسط افراط زر کو تقریباً 4-5 فیصد لیا جا سکتا ہے۔ آنے والے سالوں میں. تاہم، کوئی بھی اپنے مفروضے میں داخل ہوسکتا ہے۔
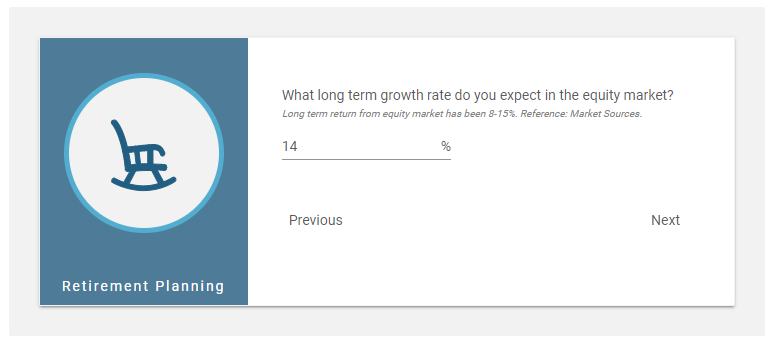
3. سرمایہ کاری کی طویل مدتی شرح نمو
یہ طویل مدتی ترقی کی شرح ہے جس کی آپ اپنی سرمایہ کاری پر توقع کرتے ہیں۔ اگرچہ ایکویٹی مارکیٹ سے طویل مدتی واپسی تاریخی طور پر 8-15% رہی ہے، مارکیٹ کے ذرائع کے مطابق، آگے بڑھ کر کوئی بھی 8-15% p.a. کی توقع کر سکتا ہے۔ طویل مدت میں. اگر آپ کو بازاروں کے بارے میں صحیح علم ہے، تو آپ شرح نمو کے بارے میں اپنے مفروضے درج کر سکتے ہیں۔
Talk to our investment specialist
4. سرمایہ کاری کی تشخیص
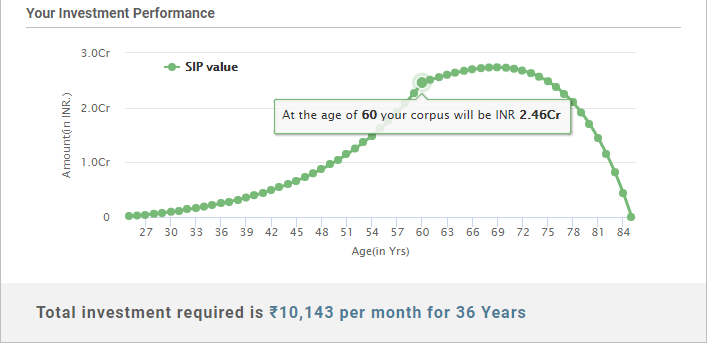
اب وہ دلچسپ حصہ آتا ہے جہاں آپ کو مطلوبہ رقم ملتی ہے جس کی آپ کو ماہانہ سرمایہ کاری کرنے کی ضرورت ہوتی ہے۔ مندرجہ بالا متغیرات کو مدنظر رکھتے ہوئے، آپ کو مطلوبہ کارپس مل جائے گا جو آپ کو ریٹائر ہونے تک ماہانہ بچانے کی ضرورت ہے۔ یہاں ریٹائرمنٹ کی تخمینی عمر 60 سال سمجھی جاتی ہے (نیچے دی گئی تصویر کو دیکھیں)۔
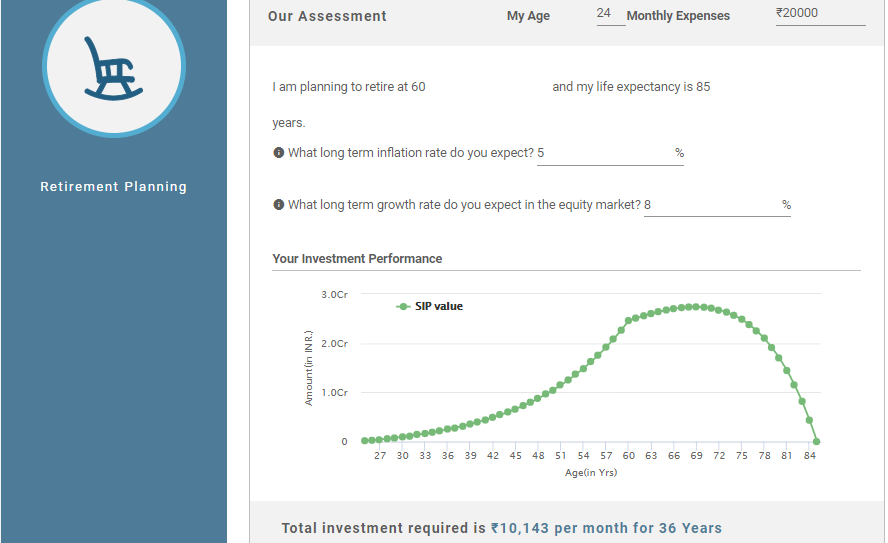
5. کل کارپس
اس سے ہمارا مطلب ہے کہ جب آپ 36 سال تک سرمایہ کاری کرتے ہیں تو کتنا کارپس جمع ہو جائے گا، یعنی اگر آپ شروع کرتے ہیںسرمایہ کاری 24 سے 60 سال کی عمر میں۔ مطلوبہ کارپس تک پہنچنے کے لیے، آپ کو ماہانہ سرمایہ کاری کرنے کی ضرورت ہے۔ مذکورہ بالا اعداد و شمار کے مطابق، 36 سالوں کے لیے ہر ماہ کل سرمایہ کاری 10,143 روپے ہے۔ جیسا کہ اشارہ کیا گیا ہے، تخمینہ شدہ کل کارپس آپ کی موجودہ عمر، موجودہ ماہانہ اخراجات، افراط زر اور سالوں میں متوقع سرمایہ کاری کی شرح نمو پر منحصر ہوگا۔
نتیجہ: جو لوگ اپنی ریٹائرمنٹ کا منصوبہ بنا رہے ہیں وہ اس کیلکولیٹر کا استعمال کر سکتے ہیں، جس کے ذریعے آپ اپنے ریٹائرمنٹ کارپس کا آسانی سے اندازہ لگا سکتے ہیں۔ اس سے آپ کو ریٹائرمنٹ کے لیے درکار تقریباً رقم کا حساب لگانے میں مدد ملے گی اور اسی لیے آپ اپنی سرمایہ کاری کی منصوبہ بندی کر سکتے ہیں!
2022 کے لیے سرفہرست فنڈز
*5 سال کی کارکردگی کی بنیاد پر بہترین فنڈز۔
The investment objective of the scheme is to provide long term growth from a portfolio of equity / equity related instruments of companies engaged either directly or indirectly in the infrastructure sector. Below is the key information for LIC MF Infrastructure Fund Returns up to 1 year are on "The primary investment objective of the Scheme is to seek capital appreciation by investing predominantly in units of MLIIF - WGF. The Scheme may, at the discretion of the Investment Manager, also invest in the units of other similar overseas mutual fund schemes, which may constitute a significant part of its corpus. The Scheme may also invest a certain portion of its corpus in money market securities and/or units of money market/liquid schemes of DSP Merrill Lynch Mutual Fund, in order to meet liquidity requirements from time to time. However, there is no assurance that the investment objective of the Scheme will be realized." Research Highlights for DSP World Gold Fund Below is the key information for DSP World Gold Fund Returns up to 1 year are on 1. LIC MF Infrastructure Fund
LIC MF Infrastructure Fund
Growth Launch Date 29 Feb 08 NAV (31 Jul 26) ₹54.5662 ↑ 0.75 (1.39 %) Net Assets (Cr) ₹1,137 on 30 Jun 26 Category Equity - Sectoral AMC LIC Mutual Fund Asset Mgmt Co Ltd Rating Risk High Expense Ratio 2.21 Sharpe Ratio 0.22 Information Ratio 0.58 Alpha Ratio 8.41 Min Investment 5,000 Min SIP Investment 1,000 Exit Load 0-1 Years (1%),1 Years and above(NIL) Growth of 10,000 investment over the years.
Date Value 31 Jul 21 ₹10,000 31 Jul 22 ₹11,519 31 Jul 23 ₹14,236 31 Jul 24 ₹26,350 31 Jul 25 ₹25,021 31 Jul 26 ₹27,470 Returns for LIC MF Infrastructure Fund
absolute basis & more than 1 year are on CAGR (Compound Annual Growth Rate) basis. as on 31 Jul 26 Duration Returns 1 Month -0.9% 3 Month 5.3% 6 Month 14.5% 1 Year 9.8% 3 Year 24.5% 5 Year 22.4% 10 Year 15 Year Since launch 9.7% Historical performance (Yearly) on absolute basis
Year Returns 2024 -3.7% 2023 47.8% 2022 44.4% 2021 7.9% 2020 46.6% 2019 -0.1% 2018 13.3% 2017 -14.6% 2016 42.2% 2015 -2.2% Fund Manager information for LIC MF Infrastructure Fund
Name Since Tenure Sumit Bhatnagar 7 Apr 26 0.23 Yr. Mahesh Bendre 1 Jul 24 2 Yr. Data below for LIC MF Infrastructure Fund as on 30 Jun 26
Equity Sector Allocation
Sector Value Industrials 37.05% Consumer Cyclical 20.88% Basic Materials 12.42% Utility 11.88% Communication Services 5.02% Financial Services 3.98% Real Estate 1.97% Health Care 1.89% Technology 1.08% Asset Allocation
Asset Class Value Cash 3.82% Equity 96.18% Top Securities Holdings / Portfolio
Name Holding Value Quantity Larsen & Toubro Ltd (Industrials)
Equity, Since 30 Apr 09 | LT4% ₹44 Cr 106,968
↓ -10,884 Garware Hi-Tech Films Ltd (Basic Materials)
Equity, Since 31 Aug 23 | 5006554% ₹40 Cr 65,325
↓ -7,684 Tata Motors Passenger Vehicles Ltd (Consumer Cyclical)
Equity, Since 28 Feb 26 | TMPV4% ₹39 Cr 982,891
↓ -332,760 Tata Motors Ltd (Consumer Cyclical)
Equity, Since 31 Oct 25 | TMCV4% ₹39 Cr 1,015,933
↑ 26,983 Tata Power Co Ltd (Utilities)
Equity, Since 29 Feb 24 | TATAPOWER3% ₹36 Cr 861,040
↑ 524,312 KSH International Ltd (Industrials)
Equity, Since 31 Dec 25 | KSHINTL3% ₹34 Cr 432,816
↑ 6,280 Siemens Energy India Ltd (Utilities)
Equity, Since 31 Aug 25 | ENRIN3% ₹34 Cr 87,106
↑ 24,800 JSW Infrastructure Ltd (Industrials)
Equity, Since 30 Apr 26 | JSWINFRA3% ₹31 Cr 1,133,858
↑ 745,681 Carraro India Ltd (Consumer Cyclical)
Equity, Since 31 Dec 24 | CARRARO3% ₹31 Cr 572,991 Bharat Dynamics Ltd Ordinary Shares (Industrials)
Equity, Since 31 Jan 26 | BDL3% ₹29 Cr 242,954
↑ 157,744 2. DSP World Gold Fund
DSP World Gold Fund
Growth Launch Date 14 Sep 07 NAV (30 Jul 26) ₹50.4247 ↑ 1.63 (3.33 %) Net Assets (Cr) ₹1,433 on 30 Jun 26 Category Equity - Global AMC DSP BlackRock Invmt Managers Pvt. Ltd. Rating ☆☆☆ Risk High Expense Ratio 1.41 Sharpe Ratio 1.22 Information Ratio -0.5 Alpha Ratio 2.12 Min Investment 1,000 Min SIP Investment 500 Exit Load 0-12 Months (1%),12 Months and above(NIL) Growth of 10,000 investment over the years.
Date Value 31 Jul 21 ₹10,000 31 Jul 22 ₹7,373 31 Jul 23 ₹9,366 31 Jul 24 ₹11,150 31 Jul 25 ₹16,504 31 Jul 26 ₹26,355 Returns for DSP World Gold Fund
absolute basis & more than 1 year are on CAGR (Compound Annual Growth Rate) basis. as on 31 Jul 26 Duration Returns 1 Month 2.3% 3 Month -12.7% 6 Month -17.8% 1 Year 62.8% 3 Year 43.6% 5 Year 22.1% 10 Year 15 Year Since launch 8.9% Historical performance (Yearly) on absolute basis
Year Returns 2024 167.1% 2023 15.9% 2022 7% 2021 -7.7% 2020 -9% 2019 31.4% 2018 35.1% 2017 -10.7% 2016 -4% 2015 52.7% Fund Manager information for DSP World Gold Fund
Name Since Tenure Kaivalya Nadkarni 1 May 25 1.17 Yr. Data below for DSP World Gold Fund as on 30 Jun 26
Equity Sector Allocation
Sector Value Basic Materials 94.47% Asset Allocation
Asset Class Value Cash 3.62% Equity 94.47% Debt 0% Other 1.91% Top Securities Holdings / Portfolio
Name Holding Value Quantity BGF World Gold I2
Investment Fund | -68% ₹1,141 Cr 1,005,044 VanEck Gold Miners ETF
- | GDX29% ₹490 Cr 573,719 Treps / Reverse Repo Investments
CBLO/Reverse Repo | -3% ₹54 Cr Net Receivables/Payables
Net Current Assets | -0% -₹6 Cr
یہاں فراہم کردہ معلومات کے درست ہونے کو یقینی بنانے کے لیے تمام کوششیں کی گئی ہیں۔ تاہم، ڈیٹا کی درستگی کے حوالے سے کوئی ضمانت نہیں دی جاتی ہے۔ براہ کرم کوئی بھی سرمایہ کاری کرنے سے پہلے اسکیم کی معلومات کے دستاویز کے ساتھ تصدیق کریں۔


AMFI Registration No. 112358 | CIN: U74999MH2016PTC282153
Shepard Technologies Pvt. Ltd. (with ARN code 112358) makes no warranties or representations, express or implied, on products offered through the platform. It accepts no liability for any damages or losses, however caused, in connection with the use of, or on the reliance of its product or related services. Terms and conditions of the website are applicable.
©2026 Shepard Technologies Private Limited. All Rights Reserved
Research Highlights for LIC MF Infrastructure Fund