BSE SENSEX Growth Over Years
Why Equities are Good for Long-term?
Whenever we hear about equity investment, the first thing we hear is, equities are good for a long-term investment. However, various people do carry negative views with respect to equity investment. So, let us understand why and how equity is a good investment for long-term, the myths behind equity investment, and parameters to be checked while Investing in equity and the concept of Equity Funds.
Understanding SENSEX Past Performance
Now, let us focus on the performance of Sensex since its inception with the help of the graph given below.
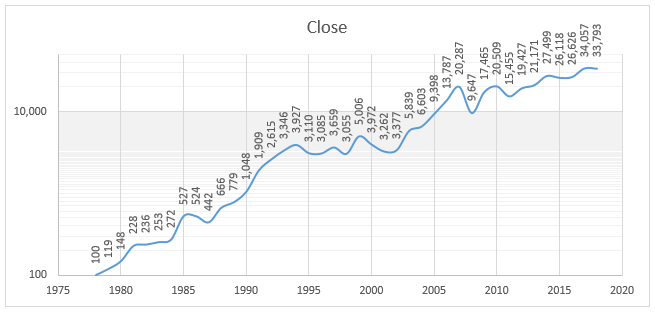
(as on 3rd January, 2018, Source- BSE Limited)
The given graph of Sensex shows that there is an overall increase in since its inception in 1979. The date on which the data taken is as of January 03, 2018. Till date since 1979, the Compounded Annual Growth Rate (CAGR) is approximately 16.39%. However, it does not mean that Sensex has seen only upward movements. However, the biggest growth that Sensex has witnessed is between the period 1979-1994 when the markets grew from 100 to 3,927 points. People who had invested during this period would have earned considerable profits. In addition, these investors also did not face much negative returns as others did. Resultantly, these people would have definitely earned. The second best phase in which investors had earned returns were during 2003-2007, but the increase during this period was not as effective as the first phase.
So, do you think that the market has always witnessed a good pace? It has also witnessed downturns. Some of the worst spells where the Sensex was showing a downturn were during September 1994 - 1999, 2000 - 2003, and 2008 - 2010. Any individual who would have invested during this period would have definitely been negative. However, again, if these investors would have held their investments long, they would have definitely earned profits. As we can see in the map, the downturn period is not much visible.
So, after understanding the myths about equity, let's now see how to select the stocks.
Common Myths Behind Equity Investment
As mentioned earlier, equity investment has a number of myths associated with it. So, let us look at some of the prevalent myths behind equity investment.
1. If a Stock Has Done Well in the Past, it will Do Well in the Future Too
The first myth which people believe while investing in shares is; if a company has done well in the past, it will also do well in the future. Though this thought can give some comfort level yet; it is not completely true. It’s because; a company’s success always depends on the environment in which it performs and whether it is able to adapt itself to the changing business conditions. If it is not able to do so then; the company will not be in a position, to perform in the future.
Therefore, people should conduct a self-analysis before investing in the shares of any company. They should check the company's past performance, its future potentials, the industry conditions in which it performs, and other related parameters.
2. I am not Able to Earn Returns Faster Through Equities as it is Sheer Luck
The second presumption people feel is they cannot earn by equity investment as it is based on sheer luck. However, as mentioned in the earlier paragraph, people need to understand that the variation of average returns reduces with the increase in the holding tenure. This is because, in the long-term, the fluctuation of the short-term Volatility reduces and the chances of making losses are also lower. Resultantly, the variations in the earnings start to decrease with the increase in the tenure. This concept is explained with the help of the table given below.
| Investing Tenure | Average Returns (%) | Deviation of Returns From Average (%) |
|---|---|---|
| 1 Year | 18 | ± 34 |
| 3 Year | 13 | ± 16% |
| 5 Year | 13 | ± 13% |
| 7 Year | 13 | ± 10% |
| 10 Year | 13 | ± 9% |
| 12 Year | 13 | ± 8% |
| 14 Year | 12 | ± 7% |
3. Only a Few are Earning in Share Markets as Equity Markets Are Volatile
It is one of the prevalent myths among individuals. A lot of people feel that they cannot earn by investing in shares. Individuals in a lot of instances feel; though the share markets are showing uptrend; yet I am not able to make my fortune. However, this isn’t true.
*One has to understand equity investing is a zero-sum game. Therefore, one person’s profit is another person’s loss. However, the outcome of whether you made a profit or ended up in a loss is decided upon the time you enter and exit the market. *
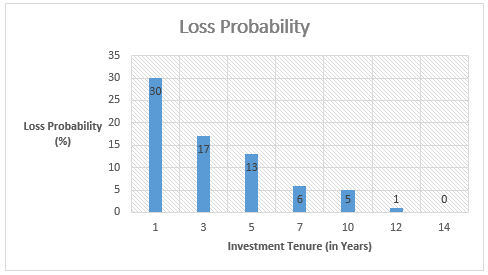
It would be again reiterated that, the key to success in equity investments is its long-term holding. One of the world’s renowned investor Warren Buffet built his empire not just because of investing. Instead, he has earned the wealth because of holding the investments for a long-term. In case of long-term investing, even a small sum of money invested gives a larger return. People who remain invested for a very long time can amass a fortune even with a small investment. The following graph shows how the probability of losses decreases with an increase in the investment tenure.
Talk to our investment specialist
How to Invest in Equities
It is the most important step. People while investing in equities need to stick to certain basic rules. Some of these rules are listed below as follows.
Invest in Stocks After its Complete Analysis & Don’t Follow Herd Behavior
The primary rule of investing is; invest in financial instruments that you understand and not the ones which you don’t. Hence, people should do a complete analysis of the shares in which they want to invest. They should go through its annual reports, check its future prospects and so on. Additionally, one should not be biased in their stock selection process.Also, many people do follow a herd behavior when it comes to investing, which should not be the case. It is not a good idea. People forming part of the herd, enter when the market is at its peak and sell when it forms a bottom. Therefore, be careful that you don’t buy the shares when all are entering a buy call and do not sell when everyone goes on a selling spree.
Diversification is the Key to Success
The important role in the case of investing is diversification, which is the key to success as it helps to reduce the level of risk. As rightly quoted that “Don’t hatch all your eggs in one basket;” similarly your investment should be distributed across numerous stocks in a predefined ratio. Diversification, in this context, means that people investing the corpus in different shares of various companies with respect to capitalization, sectors, and other parameters. This is because there are situations where mid-cap shares tend to outperform large-cap shares. So, one needs to have a constant watch on how a share is performing.
Rebalance Your Portfolio Timely
It’s rightly said that, to err is human. Similarly, while investing in stock markets, many people do commit mistakes. The mistake in this context is investing in shares where you have bad deals. However, the most important part is to rectify the wrong investment by rebalancing your Portfolio. It is important to monitor your equity investment in a timely manner. This will help to identify which stocks to sell and which ones to retain. Rebalancing the portfolio always helps to get rid of the bad stocks and thereby people can earn more income.
Thus, from the above pointers, it can be said that whenever you choose to invest in equities, you need to spend a lot of time in share markets rather than the market timing. Also, people should always understand the company before investing in its shares so that their investment money is safe and paves way for wealth creation.
Fund Selection Methodology used to find 10 funds
Top 10 Equity Mutual Funds for Long Term Investments
*List of top funds managing assets for 5 years of above & have returneded best Annualized Returns (CAGR).
(Erstwhile Sundaram Select Midcap Fund) To achieve capital appreciation by investing
in diversified stocks that are generally termed
as mid-caps. Below is the key information for Sundaram Mid Cap Fund Returns up to 1 year are on To generate long term capital appreciation from a portfolio that is predominantly in equity and equity related instruments Research Highlights for HDFC Long Term Advantage Fund Below is the key information for HDFC Long Term Advantage Fund Returns up to 1 year are on An Open-ended growth scheme with the objective of long term growth of capital, through a portfolio with a target allocation of 90% equity and 10% debt and money market securities. Research Highlights for Aditya Birla Sun Life Equity Fund Below is the key information for Aditya Birla Sun Life Equity Fund Returns up to 1 year are on An Open ended Growth Scheme with the objective to achieve long term growth of capital at controlled level of risk by investing primarily in ‘Mid-Cap’ Stocks. The level of risk is somewhat higher than a fund focused on large and liquid stocks. Concomitantly, the aim is to generate higher returns than a fund focused on large and liquid stocks. Research Highlights for Aditya Birla Sun Life Midcap Fund Below is the key information for Aditya Birla Sun Life Midcap Fund Returns up to 1 year are on (Erstwhile Motilal Oswal MOSt Focused Midcap 30 Fund) The investment objective of the Scheme is to achieve long term capital appreciation by investing in a maximum of 30 quality mid-cap companies having long-term competitive advantages and potential for growth. However, there can be no assurance or guarantee that the investment objective of the Scheme would be achieved. Research Highlights for Motilal Oswal Midcap 30 Fund Below is the key information for Motilal Oswal Midcap 30 Fund Returns up to 1 year are on The primary investment objective of the scheme is to seek to generate consistent returns by investing in equity and equity related or fixed income securities of Pharma and other associated companies. Research Highlights for Nippon India Pharma Fund Below is the key information for Nippon India Pharma Fund Returns up to 1 year are on The primary investment objective of the scheme is to generate long term capital appreciation by investing predominantly in equity and equity related instruments of small cap companies and the secondary objective is to generate consistent returns by investing in debt and money market securities. Research Highlights for Nippon India Small Cap Fund Below is the key information for Nippon India Small Cap Fund Returns up to 1 year are on The primary objective for Franklin IndiaTaxshield is to provide medium to long term growth of capital along with income tax rebate Research Highlights for Franklin India Taxshield Below is the key information for Franklin India Taxshield Returns up to 1 year are on The primary investment objective of the Scheme is to seek to generate continuous returns by actively investing in equity and equity related securities of
companies in the Banking Sector and companies engaged in allied activities related to Banking Sector. The AMC will have the discretion to completely or
partially invest in any of the type of securities stated above with a view to maximize the returns or on defensive considerations. However, there can be no
assurance that the investment objective of the Scheme will be realized, as actual market movements may be at variance with anticipated trends. Research Highlights for Nippon India Banking Fund Below is the key information for Nippon India Banking Fund Returns up to 1 year are on To generate returns through a combination of dividend income and capital appreciation by investing primarily in a well-diversified portfolio of value stocks. Value stocks are those, which have attractive valuations in relation to earnings or book value or current and/or future dividends. Research Highlights for ICICI Prudential Value Discovery Fund Below is the key information for ICICI Prudential Value Discovery Fund Returns up to 1 year are on 1. Sundaram Mid Cap Fund
Sundaram Mid Cap Fund
Growth Launch Date 30 Jul 02 NAV (31 Jul 26) ₹1,509.38 ↑ 3.96 (0.26 %) Net Assets (Cr) ₹14,026 on 30 Jun 26 Category Equity - Mid Cap AMC Sundaram Asset Management Company Ltd Rating ☆☆☆☆ Risk Moderately High Expense Ratio 1.75 Sharpe Ratio 0.06 Information Ratio 0.32 Alpha Ratio 0.71 Min Investment 5,000 Min SIP Investment 100 Exit Load 0-12 Months (1%),12 Months and above(NIL) Growth of 10,000 investment over the years.
Date Value 31 Jul 21 ₹10,000 31 Jul 22 ₹10,653 31 Jul 23 ₹13,062 31 Jul 24 ₹20,403 31 Jul 25 ₹20,694 31 Jul 26 ₹22,756 Returns for Sundaram Mid Cap Fund
absolute basis & more than 1 year are on CAGR (Compound Annual Growth Rate) basis. as on 31 Jul 26 Duration Returns 1 Month 3% 3 Month 6.6% 6 Month 8.4% 1 Year 10% 3 Year 20.3% 5 Year 17.9% 10 Year 15 Year Since launch 23.2% Historical performance (Yearly) on absolute basis
Year Returns 2025 4.1% 2024 32% 2023 40.4% 2022 4.8% 2021 37.5% 2020 11.8% 2019 -0.3% 2018 -15.4% 2017 40.8% 2016 11.3% Fund Manager information for Sundaram Mid Cap Fund
Name Since Tenure S. Bharath 24 Feb 21 5.35 Yr. Shalav Saket 31 Dec 25 0.5 Yr. Data below for Sundaram Mid Cap Fund as on 30 Jun 26
Equity Sector Allocation
Sector Value Financial Services 21.92% Industrials 19.24% Consumer Cyclical 14.17% Health Care 9.9% Basic Materials 8.55% Technology 8.5% Consumer Defensive 5.02% Real Estate 3.11% Utility 3.02% Communication Services 1.96% Energy 1.38% Asset Allocation
Asset Class Value Cash 3.22% Equity 96.76% Other 0% Top Securities Holdings / Portfolio
Name Holding Value Quantity GE Vernova T&D India Ltd (Industrials)
Equity, Since 30 Sep 24 | GVT&D3% ₹463 Cr 900,000
↓ -100,000 Cummins India Ltd (Industrials)
Equity, Since 31 Dec 17 | CUMMINSIND3% ₹441 Cr 750,000
↓ -100,000 BSE Ltd (Financial Services)
Equity, Since 31 May 24 | BSE3% ₹392 Cr 945,165 Mahindra & Mahindra Financial Services Ltd (Financial Services)
Equity, Since 31 Jan 24 | M&MFIN3% ₹349 Cr 11,498,475 Max Financial Services Ltd (Financial Services)
Equity, Since 30 Jun 16 | MFSL2% ₹302 Cr 1,805,000
↑ 130,000 The Federal Bank Ltd (Financial Services)
Equity, Since 31 Dec 18 | FEDERALBNK2% ₹300 Cr 10,399,688 Coromandel International Ltd (Basic Materials)
Equity, Since 30 Nov 10 | COROMANDEL2% ₹288 Cr 1,642,029 Suzlon Energy Ltd (Industrials)
Equity, Since 31 Jul 24 | SUZLON2% ₹287 Cr 50,302,475
↑ 11,730,000 IDFC First Bank Ltd (Financial Services)
Equity, Since 30 Jun 25 | IDFCFIRSTB2% ₹273 Cr 38,278,844 Marico Ltd (Consumer Defensive)
Equity, Since 30 Jun 24 | MARICO2% ₹271 Cr 3,300,000
↓ -95,879 2. HDFC Long Term Advantage Fund
HDFC Long Term Advantage Fund
Growth Launch Date 2 Jan 01 NAV (14 Jan 22) ₹595.168 ↑ 0.28 (0.05 %) Net Assets (Cr) ₹1,318 on 30 Nov 21 Category Equity - ELSS AMC HDFC Asset Management Company Limited Rating ☆☆☆ Risk Moderately High Expense Ratio 2.25 Sharpe Ratio 2.27 Information Ratio -0.15 Alpha Ratio 1.75 Min Investment 500 Min SIP Investment 500 Exit Load NIL Growth of 10,000 investment over the years.
Date Value
Purchase not allowed Returns for HDFC Long Term Advantage Fund
absolute basis & more than 1 year are on CAGR (Compound Annual Growth Rate) basis. as on 31 Jul 26 Duration Returns 1 Month 4.4% 3 Month 1.2% 6 Month 15.4% 1 Year 35.5% 3 Year 20.6% 5 Year 17.4% 10 Year 15 Year Since launch 21.4% Historical performance (Yearly) on absolute basis
Year Returns 2025 2024 2023 2022 2021 2020 2019 2018 2017 2016 Fund Manager information for HDFC Long Term Advantage Fund
Name Since Tenure Data below for HDFC Long Term Advantage Fund as on 30 Nov 21
Equity Sector Allocation
Sector Value Asset Allocation
Asset Class Value Top Securities Holdings / Portfolio
Name Holding Value Quantity 3. Aditya Birla Sun Life Equity Fund
Aditya Birla Sun Life Equity Fund
Growth Launch Date 27 Aug 98 NAV (31 Jul 26) ₹1,952 ↑ 5.59 (0.29 %) Net Assets (Cr) ₹26,727 on 30 Jun 26 Category Equity - Multi Cap AMC Birla Sun Life Asset Management Co Ltd Rating ☆☆☆☆ Risk Moderately High Expense Ratio 1.68 Sharpe Ratio -0.05 Information Ratio 1.19 Alpha Ratio 4.61 Min Investment 1,000 Min SIP Investment 100 Exit Load 0-365 Days (1%),365 Days and above(NIL) Growth of 10,000 investment over the years.
Date Value 31 Jul 21 ₹10,000 31 Jul 22 ₹10,055 31 Jul 23 ₹11,807 31 Jul 24 ₹16,146 31 Jul 25 ₹16,423 31 Jul 26 ₹18,094 Returns for Aditya Birla Sun Life Equity Fund
absolute basis & more than 1 year are on CAGR (Compound Annual Growth Rate) basis. as on 31 Jul 26 Duration Returns 1 Month 3.8% 3 Month 7% 6 Month 6.3% 1 Year 10.2% 3 Year 15.3% 5 Year 12.6% 10 Year 15 Year Since launch 20.8% Historical performance (Yearly) on absolute basis
Year Returns 2025 11.2% 2024 18.5% 2023 26% 2022 -1.1% 2021 30.3% 2020 16.1% 2019 8.5% 2018 -4.1% 2017 33.5% 2016 15.2% Fund Manager information for Aditya Birla Sun Life Equity Fund
Name Since Tenure Harish Krishnan 3 Nov 23 2.66 Yr. Dhaval Joshi 21 Nov 22 3.61 Yr. Data below for Aditya Birla Sun Life Equity Fund as on 30 Jun 26
Equity Sector Allocation
Sector Value Financial Services 29.69% Consumer Cyclical 13.92% Industrials 11.85% Basic Materials 11.8% Health Care 8.93% Technology 8.23% Consumer Defensive 7.38% Energy 4.18% Communication Services 2.18% Real Estate 0.53% Asset Allocation
Asset Class Value Cash 1.33% Equity 98.67% Top Securities Holdings / Portfolio
Name Holding Value Quantity ICICI Bank Ltd (Financial Services)
Equity, Since 30 Nov 16 | ICICIBANK6% ₹1,489 Cr 11,849,171 HDFC Bank Ltd (Financial Services)
Equity, Since 31 Jul 08 | HDFCBANK3% ₹893 Cr 12,000,000 Kotak Mahindra Bank Ltd (Financial Services)
Equity, Since 28 Feb 19 | KOTAKBANK3% ₹887 Cr 23,096,430 Reliance Industries Ltd (Energy)
Equity, Since 31 May 19 | RELIANCE3% ₹754 Cr 5,706,067 Infosys Ltd (Technology)
Equity, Since 30 Apr 05 | INFY3% ₹715 Cr 6,161,817 Hindalco Industries Ltd (Basic Materials)
Equity, Since 31 Mar 17 | HINDALCO2% ₹620 Cr 5,500,000 State Bank of India (Financial Services)
Equity, Since 28 Feb 21 | SBIN2% ₹589 Cr 6,105,500
↓ -394,500 Bharti Airtel Ltd (Communication Services)
Equity, Since 30 Nov 17 | BHARTIARTL2% ₹567 Cr 3,100,000 Bharat Forge Ltd (Consumer Cyclical)
Equity, Since 30 Jun 17 | BHARATFORG2% ₹564 Cr 2,883,624 HCL Technologies Ltd (Technology)
Equity, Since 30 Nov 11 | HCLTECH2% ₹486 Cr 4,103,703 4. Aditya Birla Sun Life Midcap Fund
Aditya Birla Sun Life Midcap Fund
Growth Launch Date 3 Oct 02 NAV (31 Jul 26) ₹840.89 ↑ 1.78 (0.21 %) Net Assets (Cr) ₹6,624 on 30 Jun 26 Category Equity - Mid Cap AMC Birla Sun Life Asset Management Co Ltd Rating ☆☆☆ Risk Moderately High Expense Ratio 1.89 Sharpe Ratio 0.01 Information Ratio -0.44 Alpha Ratio -0.17 Min Investment 1,000 Min SIP Investment 1,000 Exit Load 0-365 Days (1%),365 Days and above(NIL) Growth of 10,000 investment over the years.
Date Value 31 Jul 21 ₹10,000 31 Jul 22 ₹10,579 31 Jul 23 ₹12,473 31 Jul 24 ₹18,472 31 Jul 25 ₹18,235 31 Jul 26 ₹19,555 Returns for Aditya Birla Sun Life Midcap Fund
absolute basis & more than 1 year are on CAGR (Compound Annual Growth Rate) basis. as on 31 Jul 26 Duration Returns 1 Month 1.2% 3 Month 5.9% 6 Month 9% 1 Year 7.2% 3 Year 16.2% 5 Year 14.4% 10 Year 15 Year Since launch 20.4% Historical performance (Yearly) on absolute basis
Year Returns 2025 4.4% 2024 22% 2023 39.9% 2022 -5.3% 2021 50.4% 2020 15.5% 2019 -3.7% 2018 -16% 2017 44.8% 2016 5.7% Fund Manager information for Aditya Birla Sun Life Midcap Fund
Name Since Tenure Vishal Gajwani 31 Oct 24 1.67 Yr. Data below for Aditya Birla Sun Life Midcap Fund as on 30 Jun 26
Equity Sector Allocation
Sector Value Financial Services 26.79% Industrials 18.06% Consumer Cyclical 14.29% Basic Materials 13.25% Health Care 8.29% Technology 7.72% Real Estate 4.48% Utility 2.44% Consumer Defensive 2.4% Asset Allocation
Asset Class Value Cash 1.36% Equity 98.62% Top Securities Holdings / Portfolio
Name Holding Value Quantity Thermax Ltd (Industrials)
Equity, Since 31 Oct 19 | THERMAX3% ₹207 Cr 414,874
↓ -87,098 Max Financial Services Ltd (Financial Services)
Equity, Since 28 Feb 17 | MFSL3% ₹205 Cr 1,225,565 The Federal Bank Ltd (Financial Services)
Equity, Since 31 Mar 12 | FEDERALBNK3% ₹204 Cr 7,043,431 AU Small Finance Bank Ltd (Financial Services)
Equity, Since 30 Nov 19 | AUBANK3% ₹191 Cr 1,940,849
↓ -70,318 Billionbrains Garage Ventures Ltd (Financial Services)
Equity, Since 30 Nov 25 | GROWW3% ₹182 Cr 9,857,530
↑ 6,322,938 JK Cement Ltd (Basic Materials)
Equity, Since 31 Jan 24 | JKCEMENT3% ₹177 Cr 342,940 APL Apollo Tubes Ltd (Basic Materials)
Equity, Since 31 Aug 24 | APLAPOLLO2% ₹160 Cr 873,080 Torrent Power Ltd (Utilities)
Equity, Since 31 Oct 19 | TORNTPOWER2% ₹156 Cr 1,100,000 Navin Fluorine International Ltd (Basic Materials)
Equity, Since 31 Jan 25 | NAVINFLUOR2% ₹146 Cr 204,519 KEI Industries Ltd (Industrials)
Equity, Since 31 May 25 | KEI2% ₹136 Cr 257,506
↓ -23,828 5. Motilal Oswal Midcap 30 Fund
Motilal Oswal Midcap 30 Fund
Growth Launch Date 24 Feb 14 NAV (31 Jul 26) ₹100.253 ↑ 0.39 (0.39 %) Net Assets (Cr) ₹37,474 on 30 Jun 26 Category Equity - Mid Cap AMC Motilal Oswal Asset Management Co. Ltd Rating ☆☆☆ Risk Moderately High Expense Ratio 1.56 Sharpe Ratio -0.71 Information Ratio -0.25 Alpha Ratio -14.72 Min Investment 5,000 Min SIP Investment 500 Exit Load 0-1 Years (1%),1 Years and above(NIL) Growth of 10,000 investment over the years.
Date Value 31 Jul 21 ₹10,000 31 Jul 22 ₹12,488 31 Jul 23 ₹15,748 31 Jul 24 ₹26,692 31 Jul 25 ₹27,117 31 Jul 26 ₹26,669 Returns for Motilal Oswal Midcap 30 Fund
absolute basis & more than 1 year are on CAGR (Compound Annual Growth Rate) basis. as on 31 Jul 26 Duration Returns 1 Month 6.6% 3 Month 10.2% 6 Month 8.9% 1 Year -1.6% 3 Year 19.2% 5 Year 21.7% 10 Year 15 Year Since launch 20.4% Historical performance (Yearly) on absolute basis
Year Returns 2025 -12.1% 2024 57.1% 2023 41.7% 2022 10.7% 2021 55.8% 2020 9.3% 2019 9.7% 2018 -12.7% 2017 30.8% 2016 5.2% Fund Manager information for Motilal Oswal Midcap 30 Fund
Name Since Tenure Varun Sharma 21 Jan 26 0.44 Yr. Swapnil Mayekar 18 Nov 25 0.62 Yr. Ajay Khandelwal 1 Oct 24 1.75 Yr. Ankit Agarwal 21 Jan 26 0.44 Yr. Rakesh Shetty 22 Nov 22 3.61 Yr. Data below for Motilal Oswal Midcap 30 Fund as on 30 Jun 26
Equity Sector Allocation
Sector Value Financial Services 31.02% Technology 26.84% Industrials 13.76% Consumer Cyclical 13.41% Communication Services 3.08% Real Estate 2.81% Health Care 2.46% Asset Allocation
Asset Class Value Cash 6.63% Equity 93.37% Top Securities Holdings / Portfolio
Name Holding Value Quantity One97 Communications Ltd (Technology)
Equity, Since 30 Sep 24 | PAYTM7% ₹2,659 Cr 23,765,865 Coforge Ltd (Technology)
Equity, Since 31 Mar 23 | COFORGE6% ₹2,233 Cr 15,703,312
↓ -979,603 Kalyan Jewellers India Ltd (Consumer Cyclical)
Equity, Since 29 Feb 24 | KALYANKJIL6% ₹2,180 Cr 61,413,395 KEI Industries Ltd (Industrials)
Equity, Since 30 Nov 24 | KEI6% ₹2,123 Cr 4,030,834 Eternal Ltd (Consumer Cyclical)
Equity, Since 31 Aug 25 | ETERNAL6% ₹2,115 Cr 84,386,866 Persistent Systems Ltd (Technology)
Equity, Since 31 Jan 23 | PERSISTENT6% ₹2,091 Cr 4,026,493 Aditya Birla Capital Ltd (Financial Services)
Equity, Since 30 Jun 25 | ABCAPITAL5% ₹1,906 Cr 52,459,381
↓ -1,000,000 Billionbrains Garage Ventures Ltd (Financial Services)
Equity, Since 31 Jan 26 | GROWW4% ₹1,564 Cr 84,616,660 Multi Commodity Exchange of India Ltd (Financial Services)
Equity, Since 31 Jan 26 | MCX4% ₹1,539 Cr 5,209,458 BSE Ltd (Financial Services)
Equity, Since 30 Nov 25 | BSE4% ₹1,451 Cr 3,500,830
↓ -256,232 6. Nippon India Pharma Fund
Nippon India Pharma Fund
Growth Launch Date 5 Jun 04 NAV (31 Jul 26) ₹569.699 ↓ -1.11 (-0.19 %) Net Assets (Cr) ₹9,044 on 30 Jun 26 Category Equity - Sectoral AMC Nippon Life Asset Management Ltd. Rating ☆☆ Risk High Expense Ratio 1.81 Sharpe Ratio 0.19 Information Ratio -1.04 Alpha Ratio -3.58 Min Investment 5,000 Min SIP Investment 100 Exit Load 0-1 Years (1%),1 Years and above(NIL) Growth of 10,000 investment over the years.
Date Value 31 Jul 21 ₹10,000 31 Jul 22 ₹8,845 31 Jul 23 ₹11,012 31 Jul 24 ₹15,747 31 Jul 25 ₹17,081 31 Jul 26 ₹18,333 Returns for Nippon India Pharma Fund
absolute basis & more than 1 year are on CAGR (Compound Annual Growth Rate) basis. as on 31 Jul 26 Duration Returns 1 Month 2.2% 3 Month 10.2% 6 Month 16.9% 1 Year 7.3% 3 Year 18.5% 5 Year 12.9% 10 Year 15 Year Since launch 20% Historical performance (Yearly) on absolute basis
Year Returns 2025 -3.3% 2024 34% 2023 39.2% 2022 -9.9% 2021 23.9% 2020 66.4% 2019 1.7% 2018 3.6% 2017 7.6% 2016 -10.6% Fund Manager information for Nippon India Pharma Fund
Name Since Tenure Sailesh Raj Bhan 1 Apr 05 21.26 Yr. Kinjal Desai 25 May 18 8.11 Yr. Amber Singhania 11 Mar 26 0.31 Yr. Data below for Nippon India Pharma Fund as on 30 Jun 26
Equity Sector Allocation
Sector Value Health Care 97.92% Asset Allocation
Asset Class Value Cash 2.08% Equity 97.92% Top Securities Holdings / Portfolio
Name Holding Value Quantity Sun Pharmaceuticals Industries Ltd (Healthcare)
Equity, Since 31 Oct 09 | SUNPHARMA13% ₹1,153 Cr 6,406,349 Lupin Ltd (Healthcare)
Equity, Since 31 Aug 08 | LUPIN7% ₹631 Cr 2,783,991
↓ -100,000 Dr Reddy's Laboratories Ltd (Healthcare)
Equity, Since 30 Jun 11 | DRREDDY7% ₹580 Cr 4,449,746 Cipla Ltd (Healthcare)
Equity, Since 31 May 08 | CIPLA6% ₹532 Cr 3,795,054
↑ 300,000 Divi's Laboratories Ltd (Healthcare)
Equity, Since 31 Mar 12 | DIVISLAB6% ₹501 Cr 750,754
↓ -100,000 Apollo Hospitals Enterprise Ltd (Healthcare)
Equity, Since 30 Sep 20 | APOLLOHOSP5% ₹449 Cr 548,795 Mankind Pharma Ltd (Healthcare)
Equity, Since 30 Apr 23 | MANKIND4% ₹340 Cr 1,431,195
↑ 300,000 Medplus Health Services Ltd (Healthcare)
Equity, Since 30 Nov 22 | MEDPLUS4% ₹317 Cr 3,545,229
↓ -82,048 Sai Life Sciences Ltd (Healthcare)
Equity, Since 31 Dec 24 | SAILIFE3% ₹296 Cr 2,555,745 Ajanta Pharma Ltd (Healthcare)
Equity, Since 30 Apr 22 | AJANTPHARM3% ₹277 Cr 946,323 7. Nippon India Small Cap Fund
Nippon India Small Cap Fund
Growth Launch Date 16 Sep 10 NAV (31 Jul 26) ₹179.922 ↑ 1.16 (0.65 %) Net Assets (Cr) ₹78,407 on 30 Jun 26 Category Equity - Small Cap AMC Nippon Life Asset Management Ltd. Rating ☆☆☆☆ Risk Moderately High Expense Ratio 1.44 Sharpe Ratio 0.02 Information Ratio -0.27 Alpha Ratio 3.21 Min Investment 5,000 Min SIP Investment 100 Exit Load 0-1 Years (1%),1 Years and above(NIL) Growth of 10,000 investment over the years.
Date Value 31 Jul 21 ₹10,000 31 Jul 22 ₹11,028 31 Jul 23 ₹14,978 31 Jul 24 ₹23,308 31 Jul 25 ₹21,934 31 Jul 26 ₹23,294 Returns for Nippon India Small Cap Fund
absolute basis & more than 1 year are on CAGR (Compound Annual Growth Rate) basis. as on 31 Jul 26 Duration Returns 1 Month -0.2% 3 Month 5.6% 6 Month 13% 1 Year 6.2% 3 Year 15.9% 5 Year 18.4% 10 Year 15 Year Since launch 20% Historical performance (Yearly) on absolute basis
Year Returns 2025 -4.7% 2024 26.1% 2023 48.9% 2022 6.5% 2021 74.3% 2020 29.2% 2019 -2.5% 2018 -16.7% 2017 63% 2016 5.6% Fund Manager information for Nippon India Small Cap Fund
Name Since Tenure Samir Rachh 2 Jan 17 9.5 Yr. Kinjal Desai 25 May 18 8.11 Yr. Amber Singhania 11 Mar 26 0.31 Yr. Data below for Nippon India Small Cap Fund as on 30 Jun 26
Equity Sector Allocation
Sector Value Industrials 24.65% Financial Services 15.05% Consumer Cyclical 14.19% Basic Materials 11.05% Health Care 9.49% Consumer Defensive 9.04% Technology 7.05% Utility 3.27% Communication Services 1.65% Real Estate 0.78% Energy 0.43% Asset Allocation
Asset Class Value Cash 2.9% Equity 97.1% Top Securities Holdings / Portfolio
Name Holding Value Quantity Bharat Heavy Electricals Ltd (Industrials)
Equity, Since 30 Sep 22 | BHEL2% ₹1,438 Cr 34,507,422 HDFC Bank Ltd (Financial Services)
Equity, Since 30 Apr 22 | HDFCBANK2% ₹1,322 Cr 17,754,929 TD Power Systems Ltd (Industrials)
Equity, Since 31 Dec 15 | TDPOWERSYS2% ₹1,277 Cr 9,680,747 Multi Commodity Exchange of India Ltd (Financial Services)
Equity, Since 28 Feb 21 | MCX2% ₹1,169 Cr 3,957,067
↓ -342,933 Apar Industries Ltd (Industrials)
Equity, Since 31 Mar 17 | APARINDS2% ₹1,154 Cr 879,502 State Bank of India (Financial Services)
Equity, Since 31 Oct 19 | SBIN1% ₹964 Cr 10,000,000
↑ 2,000,000 NLC India Ltd (Utilities)
Equity, Since 31 Oct 22 | NLCINDIA1% ₹938 Cr 26,990,331 Karur Vysya Bank Ltd (Financial Services)
Equity, Since 28 Feb 17 | KARURVYSYA1% ₹921 Cr 31,907,252 Zydus Wellness Ltd (Consumer Defensive)
Equity, Since 31 Aug 16 | ZYDUSWELL1% ₹876 Cr 17,273,570 Tube Investments of India Ltd Ordinary Shares (Industrials)
Equity, Since 30 Apr 18 | TIINDIA1% ₹785 Cr 2,499,222 8. Franklin India Taxshield
Franklin India Taxshield
Growth Launch Date 10 Apr 99 NAV (31 Jul 26) ₹1,436.43 ↑ 0.78 (0.05 %) Net Assets (Cr) ₹6,166 on 30 Jun 26 Category Equity - ELSS AMC Franklin Templeton Asst Mgmt(IND)Pvt Ltd Rating ☆☆ Risk Moderately High Expense Ratio 1.81 Sharpe Ratio -0.69 Information Ratio 0.11 Alpha Ratio -5.69 Min Investment 500 Min SIP Investment 500 Exit Load NIL Growth of 10,000 investment over the years.
Date Value 31 Jul 21 ₹10,000 31 Jul 22 ₹10,696 31 Jul 23 ₹13,045 31 Jul 24 ₹18,863 31 Jul 25 ₹18,749 31 Jul 26 ₹18,284 Returns for Franklin India Taxshield
absolute basis & more than 1 year are on CAGR (Compound Annual Growth Rate) basis. as on 31 Jul 26 Duration Returns 1 Month 1.6% 3 Month 3.3% 6 Month -1.2% 1 Year -2.5% 3 Year 11.9% 5 Year 12.8% 10 Year 15 Year Since launch 19.9% Historical performance (Yearly) on absolute basis
Year Returns 2025 2.1% 2024 22.4% 2023 31.2% 2022 5.4% 2021 36.7% 2020 9.8% 2019 5.1% 2018 -3% 2017 29.1% 2016 4.7% Fund Manager information for Franklin India Taxshield
Name Since Tenure R. Janakiraman 2 May 16 10.17 Yr. Rajasa Kakulavarapu 1 Dec 23 2.58 Yr. Data below for Franklin India Taxshield as on 30 Jun 26
Equity Sector Allocation
Sector Value Financial Services 31.4% Industrials 14.04% Basic Materials 8.49% Consumer Cyclical 8.29% Technology 8% Consumer Defensive 5.85% Health Care 4.78% Utility 4.32% Energy 3.81% Communication Services 3.21% Real Estate 1.41% Asset Allocation
Asset Class Value Cash 6.39% Equity 93.61% Top Securities Holdings / Portfolio
Name Holding Value Quantity HDFC Bank Ltd (Financial Services)
Equity, Since 31 Mar 07 | HDFCBANK8% ₹486 Cr 6,520,834 ICICI Bank Ltd (Financial Services)
Equity, Since 31 Oct 18 | ICICIBANK7% ₹414 Cr 3,297,903 Axis Bank Ltd (Financial Services)
Equity, Since 30 Jun 14 | AXISBANK5% ₹319 Cr 2,477,634 Larsen & Toubro Ltd (Industrials)
Equity, Since 31 Dec 19 | LT5% ₹292 Cr 717,322 State Bank of India (Financial Services)
Equity, Since 31 Aug 15 | SBIN5% ₹273 Cr 2,833,344 Infosys Ltd (Technology)
Equity, Since 29 Feb 12 | INFY4% ₹222 Cr 1,911,441 Reliance Industries Ltd (Energy)
Equity, Since 31 May 22 | RELIANCE3% ₹195 Cr 1,472,922 Bharti Airtel Ltd (Communication Services)
Equity, Since 31 Jan 07 | BHARTIARTL3% ₹194 Cr 1,060,541
↓ -78,511 Kotak Mahindra Bank Ltd (Financial Services)
Equity, Since 30 Nov 17 | KOTAKBANK3% ₹191 Cr 4,981,055 Eternal Ltd (Consumer Cyclical)
Equity, Since 30 Nov 21 | ETERNAL3% ₹188 Cr 7,500,000 9. Nippon India Banking Fund
Nippon India Banking Fund
Growth Launch Date 26 May 03 NAV (31 Jul 26) ₹642.527 ↑ 4.09 (0.64 %) Net Assets (Cr) ₹7,789 on 30 Jun 26 Category Equity - Sectoral AMC Nippon Life Asset Management Ltd. Rating ☆☆☆ Risk High Expense Ratio 1.89 Sharpe Ratio -0.18 Information Ratio 0.51 Alpha Ratio 0.84 Min Investment 5,000 Min SIP Investment 100 Exit Load 0-1 Years (1%),1 Years and above(NIL) Growth of 10,000 investment over the years.
Date Value 31 Jul 21 ₹10,000 31 Jul 22 ₹10,766 31 Jul 23 ₹13,538 31 Jul 24 ₹16,767 31 Jul 25 ₹18,342 31 Jul 26 ₹18,926 Returns for Nippon India Banking Fund
absolute basis & more than 1 year are on CAGR (Compound Annual Growth Rate) basis. as on 31 Jul 26 Duration Returns 1 Month -0.5% 3 Month 3.2% 6 Month -2.1% 1 Year 3.2% 3 Year 11.8% 5 Year 13.6% 10 Year 15 Year Since launch 19.7% Historical performance (Yearly) on absolute basis
Year Returns 2025 17.4% 2024 10.3% 2023 24.2% 2022 20.7% 2021 29.7% 2020 -10.6% 2019 10.7% 2018 -1.2% 2017 44.1% 2016 11.5% Fund Manager information for Nippon India Banking Fund
Name Since Tenure Vinay Sharma 9 Apr 18 8.23 Yr. Kinjal Desai 25 May 18 8.1 Yr. Bhavik Dave 18 Jun 21 5.04 Yr. Amber Singhania 11 Mar 26 0.3 Yr. Data below for Nippon India Banking Fund as on 30 Jun 26
Equity Sector Allocation
Sector Value Financial Services 93.81% Technology 4.36% Asset Allocation
Asset Class Value Cash 1.83% Equity 98.17% Top Securities Holdings / Portfolio
Name Holding Value Quantity ICICI Bank Ltd (Financial Services)
Equity, Since 31 Oct 09 | ICICIBANK13% ₹947 Cr 7,538,887 HDFC Bank Ltd (Financial Services)
Equity, Since 31 Jul 08 | HDFCBANK13% ₹940 Cr 12,619,320 Axis Bank Ltd (Financial Services)
Equity, Since 30 Jun 17 | AXISBANK9% ₹696 Cr 5,408,065 State Bank of India (Financial Services)
Equity, Since 31 Mar 14 | SBIN5% ₹402 Cr 4,165,352 Kotak Mahindra Bank Ltd (Financial Services)
Equity, Since 31 Jul 23 | KOTAKBANK4% ₹264 Cr 6,872,870 SBI Life Insurance Co Ltd (Financial Services)
Equity, Since 30 Nov 20 | SBILIFE3% ₹245 Cr 1,339,636
↓ -10,563 SBI Cards and Payment Services Ltd Ordinary Shares (Financial Services)
Equity, Since 31 Jul 20 | SBICARD3% ₹243 Cr 3,893,792 Bajaj Finserv Ltd (Financial Services)
Equity, Since 31 Oct 23 | BAJAJFINSV3% ₹228 Cr 1,275,773 Multi Commodity Exchange of India Ltd (Financial Services)
Equity, Since 30 Apr 24 | MCX3% ₹204 Cr 690,540 Cholamandalam Financial Holdings Ltd (Financial Services)
Equity, Since 30 Apr 19 | CHOLAHLDNG3% ₹202 Cr 1,279,877 10. ICICI Prudential Value Discovery Fund
ICICI Prudential Value Discovery Fund
Growth Launch Date 16 Aug 04 NAV (31 Jul 26) ₹466.24 ↑ 0.70 (0.15 %) Net Assets (Cr) ₹60,198 on 30 Jun 26 Category Equity - Value AMC ICICI Prudential Asset Management Company Limited Rating ☆☆ Risk Moderately High Expense Ratio 1.55 Sharpe Ratio -0.59 Information Ratio 0.38 Alpha Ratio -3.68 Min Investment 1,000 Min SIP Investment 100 Exit Load 0-12 Months (1%),12 Months and above(NIL) Growth of 10,000 investment over the years.
Date Value 31 Jul 21 ₹10,000 31 Jul 22 ₹11,505 31 Jul 23 ₹14,425 31 Jul 24 ₹20,645 31 Jul 25 ₹21,096 31 Jul 26 ₹21,065 Returns for ICICI Prudential Value Discovery Fund
absolute basis & more than 1 year are on CAGR (Compound Annual Growth Rate) basis. as on 31 Jul 26 Duration Returns 1 Month 1.7% 3 Month 1% 6 Month -4% 1 Year -0.1% 3 Year 13.5% 5 Year 16.1% 10 Year 15 Year Since launch 19.1% Historical performance (Yearly) on absolute basis
Year Returns 2025 13.8% 2024 20% 2023 31.4% 2022 15% 2021 38.5% 2020 22.9% 2019 0.6% 2018 -4.2% 2017 23.8% 2016 4.6% Fund Manager information for ICICI Prudential Value Discovery Fund
Name Since Tenure Sankaran Naren 18 Jan 21 5.45 Yr. Dharmesh Kakkad 18 Jan 21 5.45 Yr. Sharmila D'Silva 30 Jun 22 4.01 Yr. Masoomi Jhurmarvala 4 Nov 24 1.65 Yr. Data below for ICICI Prudential Value Discovery Fund as on 30 Jun 26
Equity Sector Allocation
Sector Value Financial Services 35.8% Technology 11.03% Health Care 9.95% Consumer Defensive 9.04% Consumer Cyclical 8.64% Energy 6.91% Basic Materials 6.1% Utility 3.37% Industrials 2.8% Communication Services 1.93% Asset Allocation
Asset Class Value Cash 4.24% Equity 95.76% Top Securities Holdings / Portfolio
Name Holding Value Quantity HDFC Bank Ltd (Financial Services)
Equity, Since 30 Jun 21 | HDFCBANK9% ₹5,378 Cr 72,226,397
↑ 1,360,770 ICICI Bank Ltd (Financial Services)
Equity, Since 28 Feb 21 | ICICIBANK9% ₹5,321 Cr 42,350,921
↑ 2,541,700 Infosys Ltd (Technology)
Equity, Since 30 Sep 14 | INFY6% ₹3,638 Cr 31,339,613
↑ 1,200,000 ITC Ltd (Consumer Defensive)
Equity, Since 30 Sep 17 | ITC5% ₹2,877 Cr 100,277,455 Reliance Industries Ltd (Energy)
Equity, Since 31 Jan 23 | RELIANCE5% ₹2,840 Cr 21,496,674
↑ 239,391 Sun Pharmaceuticals Industries Ltd (Healthcare)
Equity, Since 31 May 16 | SUNPHARMA5% ₹2,784 Cr 15,472,731 Tata Consultancy Services Ltd (Technology)
Equity, Since 28 Feb 25 | TCS4% ₹2,153 Cr 9,530,056 Maruti Suzuki India Ltd (Consumer Cyclical)
Equity, Since 31 Dec 22 | MARUTI3% ₹1,986 Cr 1,513,196
↑ 347,526 Axis Bank Ltd (Financial Services)
Equity, Since 31 Aug 20 | AXISBANK3% ₹1,762 Cr 13,691,763 Hindustan Unilever Ltd (Consumer Defensive)
Equity, Since 31 Aug 23 | HINDUNILVR3% ₹1,757 Cr 8,158,332
All efforts have been made to ensure the information provided here is accurate. However, no guarantees are made regarding correctness of data. Please verify with scheme information document before making any investment.
?")


AMFI Registration No. 112358 | CIN: U74999MH2016PTC282153
Shepard Technologies Pvt. Ltd. (with ARN code 112358) makes no warranties or representations, express or implied, on products offered through the platform. It accepts no liability for any damages or losses, however caused, in connection with the use of, or on the reliance of its product or related services. Terms and conditions of the website are applicable.
©2026 Shepard Technologies Private Limited. All Rights Reserved
Research Highlights for Sundaram Mid Cap Fund