बेस्ट डिविडेंड पेइंग बैलेंस्ड म्यूचुअल फंड 2022
बैलेंस्ड फंड हैंम्यूचुअल फंड्स जो अपनी संपत्ति का 65% से अधिक इक्विटी में निवेश करते हैं और शेष संपत्ति ऋण उपकरणों में अच्छे समग्र रिटर्न प्राप्त करने के लिए निवेश करते हैं। बैलेंस्ड म्युचुअल फंड उन निवेशकों के लिए फायदेमंद होते हैं जो एक लेने के इच्छुक हैंमंडी कुछ निश्चित रिटर्न की तलाश में भी जोखिम। इक्विटी और स्टॉक में निवेश की गई संपत्ति बाजार से जुड़े रिटर्न की पेशकश करती है जबकि डेट इंस्ट्रूमेंट में निवेश की गई संपत्ति निश्चित रिटर्न देती है। इक्विटी और डेट दोनों का संयोजन होने के कारण, निवेशकों को बहुत सावधान रहना चाहिए जबनिवेश इन निधियों में। इस प्रकार के म्युचुअल फंड में लाभांश विकल्प वास्तव में अच्छा हो सकता है क्योंकि वे रिटर्न उत्पन्न करते हैं और जब भी अधिशेष उत्पन्न होता है तो उनका भुगतान करते हैं, इस प्रकार इस प्रकार का विकल्प निवेशकों के लिए अच्छा है जो लगातार तलाश कर रहे हैंआय उनके निवेश से। वर्ष 2022 के लिए बैलेंस्ड म्यूचुअल फंड का भुगतान करने वाले कुछ बेहतरीन लाभांश नीचे दिए गए हैं:
टॉप बैलेंस्ड फंड के फायदे और नुकसान
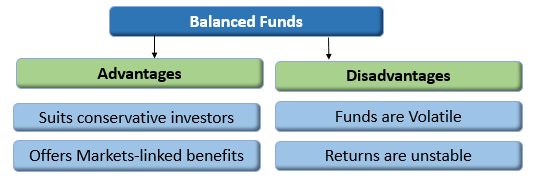
लाभ
- संपत्ति का 35-40% निवेश करके स्थिर रिटर्न प्रदान करता हैनिश्चित आय विकल्प।
- इक्विटी में 60-65% संपत्ति का निवेश करके बाजार से जुड़े रिटर्न को प्रफुल्लित करता है।
- मध्यम जोखिम लेने के इच्छुक रूढ़िवादी निवेशकों के लिए उपयुक्त।
नुकसान
- इक्विटी में निवेश किया गया फंड अस्थिर होता है और इसमें उच्च जोखिम होता हैफ़ैक्टर.
- संयुक्त रिटर्न (ऋण और दोनों का रिटर्न)इक्विटी म्यूचुअल फंड) लंबे समय में बहुत अच्छा रिटर्न नहीं दे सकता है।
Talk to our investment specialist
नियमित आय के लिए शीर्ष 6 लाभांश भुगतान संतुलित म्युचुअल फंड
Fund NAV Net Assets (Cr) Rating 3 MO (%) 6 MO (%) 1 YR (%) 3 YR (%) 5 YR (%) 2025 (%) BOI AXA Mid and Small Cap Equity and Debt Fund Normal Dividend, Payout ₹33.9
↓ -0.17 ₹1,695 4 12.9 7.9 18 13.9 -0.9 Sundaram Equity Hybrid Fund Normal Dividend, Payout ₹16.3588
↑ 0.09 ₹1,954 ☆☆ 0.5 10.5 27 15.5 13.6 ICICI Prudential Multi-Asset Fund Normal Dividend, Payout ₹34.6564
↑ 0.04 ₹84,991 ☆☆ -0.2 0 6.5 15.2 17.4 18.6 IDBI Hybrid Equity Fund Normal Dividend, Payout ₹15.626
↓ -0.01 ₹179 7.8 9.8 12.1 14.4 7.1 Edelweiss Multi Asset Allocation Fund Normal Dividend, Payout ₹64.73
↓ -0.41 ₹3,784 ☆ 0.6 1.6 0.6 14.2 16.1 6 Baroda Pioneer Hybrid Equity Fund Normal Dividend, Payout ₹18.8096
↑ 0.08 ₹389 ☆☆☆ -3.5 -0.8 14.8 13.8 10.7 Note: Returns up to 1 year are on absolute basis & more than 1 year are on CAGR basis. as on 22 Jul 26 Research Highlights & Commentary of 6 Funds showcased
Commentary BOI AXA Mid and Small Cap Equity and Debt Fund Sundaram Equity Hybrid Fund ICICI Prudential Multi-Asset Fund IDBI Hybrid Equity Fund Edelweiss Multi Asset Allocation Fund Baroda Pioneer Hybrid Equity Fund Point 1 Lower mid AUM (₹1,695 Cr). Upper mid AUM (₹1,954 Cr). Highest AUM (₹84,991 Cr). Bottom quartile AUM (₹179 Cr). Upper mid AUM (₹3,784 Cr). Bottom quartile AUM (₹389 Cr). Point 2 Established history (10+ yrs). Oldest track record among peers (26 yrs). Established history (22+ yrs). Established history (9+ yrs). Established history (17+ yrs). Established history (22+ yrs). Point 3 Not Rated. Rating: 2★ (upper mid). Rating: 2★ (upper mid). Not Rated. Rating: 1★ (lower mid). Top rated. Point 4 Risk profile: Moderately High. Risk profile: Moderately High. Risk profile: Moderately High. Risk profile: Moderately High. Risk profile: Moderately High. Risk profile: Moderately High. Point 5 5Y return: 13.91% (upper mid). 5Y return: 13.64% (lower mid). 5Y return: 17.43% (top quartile). 5Y return: 7.06% (bottom quartile). 5Y return: 16.05% (upper mid). 5Y return: 10.70% (bottom quartile). Point 6 3Y return: 18.04% (top quartile). 3Y return: 15.54% (upper mid). 3Y return: 15.25% (upper mid). 3Y return: 14.38% (lower mid). 3Y return: 14.19% (bottom quartile). 3Y return: 13.79% (bottom quartile). Point 7 1Y return: 7.86% (lower mid). 1Y return: 26.97% (top quartile). 1Y return: 6.54% (bottom quartile). 1Y return: 12.06% (upper mid). 1Y return: 0.61% (bottom quartile). 1Y return: 14.83% (upper mid). Point 8 1M return: -0.52% (bottom quartile). 1M return: 1.79% (upper mid). 1M return: 0.73% (upper mid). 1M return: 2.10% (top quartile). 1M return: -0.49% (lower mid). 1M return: -2.79% (bottom quartile). Point 9 Alpha: 0.00 (upper mid). Alpha: 5.70 (upper mid). Alpha: 0.00 (lower mid). Alpha: -0.26 (bottom quartile). Alpha: -1.02 (bottom quartile). Alpha: 6.52 (top quartile). Point 10 Sharpe: 0.17 (lower mid). Sharpe: 2.63 (top quartile). Sharpe: 0.01 (bottom quartile). Sharpe: 1.03 (upper mid). Sharpe: -0.47 (bottom quartile). Sharpe: 2.59 (upper mid). BOI AXA Mid and Small Cap Equity and Debt Fund
Sundaram Equity Hybrid Fund
ICICI Prudential Multi-Asset Fund
IDBI Hybrid Equity Fund
Edelweiss Multi Asset Allocation Fund
Baroda Pioneer Hybrid Equity Fund
लाभांश भुगतान संतुलित ऊपर एयूएम/शुद्ध संपत्ति वाले फंड100 करोड़. पर छाँटा गयापिछले 1 साल का रिटर्न.
(Erstwhile BOI AXA Mid Cap Equity And Debt Fund) The scheme's objective is to provide capital appreciation and income distribution to investors from a portfolio constituting of mid cap equity and equity related securities as well as fixed income securities.However there can be no assurance that the investment objectives of the Scheme will be realized Below is the key information for BOI AXA Mid and Small Cap Equity and Debt Fund Returns up to 1 year are on (Erstwhile Sundaram Balanced Fund) The scheme seeks to generate capital appreciation and current income through a judicious mix of investments in equities and fixed income securities. Research Highlights for Sundaram Equity Hybrid Fund Below is the key information for Sundaram Equity Hybrid Fund Returns up to 1 year are on (Erstwhile ICICI Prudential Dynamic Plan) To generate capital appreciation by actively investing in equity and equity related securities. For defensive considerations, the Scheme may invest in debt, money market instruments and derivatives. The investment manager will have the discretion to take aggressive asset calls i.e. by staying 100% invested in equity market/equity related instruments at a given point of time and 0% at another, in which case, the fund may be invested in debt related instruments at its discretion. The AMC may choose to churn the portfolio of the Scheme in order to achieve the investment objective. The Scheme is suitable for investors seeking high returns and for those who are willing to take commensurate risks. Research Highlights for ICICI Prudential Multi-Asset Fund Below is the key information for ICICI Prudential Multi-Asset Fund Returns up to 1 year are on (Erstwhile IDBI Prudence Fund) The investment objective of the scheme would be to generate opportunities for capital appreciation along with income by investing in a diversified basket of equity and equity related instruments, debt and money market instruments. However, there can be no assurance that the investment objective of the scheme will be realized. Research Highlights for IDBI Hybrid Equity Fund Below is the key information for IDBI Hybrid Equity Fund Returns up to 1 year are on (Erstwhile Edelweiss Prudent Advantage Fund) The objective of the Scheme is to generate returns through capital appreciation by investing in diversified portfolio of equity and equity-related securities, fixed income instruments and Gold Exchange Traded Funds.
However, there is no assurance that the investment objective of the Scheme will be realized. Research Highlights for Edelweiss Multi Asset Allocation Fund Below is the key information for Edelweiss Multi Asset Allocation Fund Returns up to 1 year are on (Erstwhile Baroda Pioneer Balance Fund) The scheme is targeted for long-term capital appreciation along with stability through a well balanced portfolio comprising of equity,equity related instruments, money market instrument and debt securities. Research Highlights for Baroda Pioneer Hybrid Equity Fund Below is the key information for Baroda Pioneer Hybrid Equity Fund Returns up to 1 year are on 1. BOI AXA Mid and Small Cap Equity and Debt Fund
BOI AXA Mid and Small Cap Equity and Debt Fund
Normal Dividend, Payout Launch Date 20 Jul 16 NAV (22 Jul 26) ₹33.9 ↓ -0.17 (-0.50 %) Net Assets (Cr) ₹1,695 on 30 Jun 26 Category Hybrid - Hybrid Equity AMC BOI AXA Investment Mngrs Private Ltd Rating Risk Moderately High Expense Ratio 2.27 Sharpe Ratio 0.17 Information Ratio 0 Alpha Ratio 0 Min Investment 5,000 Min SIP Investment 1,000 Exit Load 0-1 Years (1%),1 Years and above(NIL) Growth of 10,000 investment over the years.
Date Value 30 Jun 21 ₹10,000 30 Jun 22 ₹9,724 30 Jun 23 ₹12,023 30 Jun 24 ₹18,267 30 Jun 25 ₹18,880 30 Jun 26 ₹20,261 Returns for BOI AXA Mid and Small Cap Equity and Debt Fund
absolute basis & more than 1 year are on CAGR (Compound Annual Growth Rate) basis. as on 22 Jul 26 Duration Returns 1 Month -0.5% 3 Month 4% 6 Month 12.9% 1 Year 7.9% 3 Year 18% 5 Year 13.9% 10 Year 15 Year Since launch 15.3% Historical performance (Yearly) on absolute basis
Year Returns 2025 -0.9% 2024 25.8% 2023 33.7% 2022 -4.8% 2021 54.2% 2020 31.1% 2019 -4.7% 2018 -14.4% 2017 47.3% 2016 Fund Manager information for BOI AXA Mid and Small Cap Equity and Debt Fund
Name Since Tenure Alok Singh 16 Feb 17 9.37 Yr. Data below for BOI AXA Mid and Small Cap Equity and Debt Fund as on 30 Jun 26
Asset Allocation
Asset Class Value Cash 9.83% Equity 78.48% Debt 11.69% Equity Sector Allocation
Sector Value Industrials 16.69% Financial Services 16.24% Basic Materials 13.91% Health Care 10.42% Consumer Cyclical 10.21% Technology 4.93% Consumer Defensive 3.01% Energy 0.98% Real Estate 0.9% Utility 0.77% Communication Services 0.42% Debt Sector Allocation
Sector Value Corporate 7.58% Cash Equivalent 7.09% Government 6.86% Credit Quality
Rating Value AA 8.71% AAA 91.29% Top Securities Holdings / Portfolio
Name Holding Value Quantity Abbott India Ltd (Healthcare)
Equity, Since 31 Jan 23 | ABBOTINDIA3% ₹40 Cr 15,000 Lloyds Metals & Energy Ltd (Basic Materials)
Equity, Since 28 Feb 25 | 5124553% ₹40 Cr 221,723 UNO Minda Ltd (Consumer Cyclical)
Equity, Since 31 Jul 19 | UNOMINDA2% ₹36 Cr 331,037 Aurobindo Pharma Ltd (Healthcare)
Equity, Since 31 Jan 26 | AUROPHARMA2% ₹34 Cr 240,000 Glenmark Pharmaceuticals Ltd (Healthcare)
Equity, Since 31 Jul 25 | GLENMARK2% ₹34 Cr 150,000 Indian Bank (Financial Services)
Equity, Since 31 Aug 23 | INDIANB2% ₹34 Cr 405,000 Nippon Life India Asset Management Ltd Ordinary Shares (Financial Services)
Equity, Since 31 Jan 24 | NAM-INDIA2% ₹33 Cr 300,000 Max Financial Services Ltd (Financial Services)
Equity, Since 28 Feb 26 | MFSL2% ₹32 Cr 191,000
↑ 21,000 Bank of Maharashtra (Financial Services)
Equity, Since 31 May 24 | MAHABANK2% ₹31 Cr 3,910,000 Bharat Dynamics Ltd Ordinary Shares (Industrials)
Equity, Since 31 Jul 24 | BDL2% ₹29 Cr 242,000 2. Sundaram Equity Hybrid Fund
Sundaram Equity Hybrid Fund
Normal Dividend, Payout Launch Date 23 Jun 00 NAV (31 Dec 21) ₹16.3588 ↑ 0.09 (0.58 %) Net Assets (Cr) ₹1,954 on 30 Nov 21 Category Hybrid - Hybrid Equity AMC Sundaram Asset Management Company Ltd Rating ☆☆ Risk Moderately High Expense Ratio 2.18 Sharpe Ratio 2.63 Information Ratio -0.26 Alpha Ratio 5.7 Min Investment 5,000 Min SIP Investment 100 Exit Load 0-12 Months (1%),12 Months and above(NIL) Growth of 10,000 investment over the years.
Date Value 30 Jun 21 ₹10,000 Returns for Sundaram Equity Hybrid Fund
absolute basis & more than 1 year are on CAGR (Compound Annual Growth Rate) basis. as on 22 Jul 26 Duration Returns 1 Month 1.8% 3 Month 0.5% 6 Month 10.5% 1 Year 27% 3 Year 15.5% 5 Year 13.6% 10 Year 15 Year Since launch 12.7% Historical performance (Yearly) on absolute basis
Year Returns 2025 2024 2023 2022 2021 2020 2019 2018 2017 2016 Fund Manager information for Sundaram Equity Hybrid Fund
Name Since Tenure Data below for Sundaram Equity Hybrid Fund as on 30 Nov 21
Asset Allocation
Asset Class Value Equity Sector Allocation
Sector Value Debt Sector Allocation
Sector Value Credit Quality
Rating Value Top Securities Holdings / Portfolio
Name Holding Value Quantity 3. ICICI Prudential Multi-Asset Fund
ICICI Prudential Multi-Asset Fund
Normal Dividend, Payout Launch Date 9 Jan 04 NAV (21 Jul 26) ₹34.6564 ↑ 0.04 (0.10 %) Net Assets (Cr) ₹84,991 on 30 Jun 26 Category Hybrid - Multi Asset AMC ICICI Prudential Asset Management Company Limited Rating ☆☆ Risk Moderately High Expense Ratio 1.47 Sharpe Ratio 0.01 Information Ratio 0 Alpha Ratio 0 Min Investment 5,000 Min SIP Investment 100 Exit Load 0-1 Years (1%),1 Years and above(NIL) Growth of 10,000 investment over the years.
Date Value 30 Jun 21 ₹10,000 30 Jun 22 ₹11,635 30 Jun 23 ₹14,207 30 Jun 24 ₹18,804 30 Jun 25 ₹21,037 30 Jun 26 ₹22,115 Returns for ICICI Prudential Multi-Asset Fund
absolute basis & more than 1 year are on CAGR (Compound Annual Growth Rate) basis. as on 22 Jul 26 Duration Returns 1 Month 0.7% 3 Month -0.2% 6 Month 0% 1 Year 6.5% 3 Year 15.2% 5 Year 17.4% 10 Year 15 Year Since launch 16.8% Historical performance (Yearly) on absolute basis
Year Returns 2025 18.6% 2024 16.1% 2023 24.1% 2022 16.8% 2021 34.7% 2020 9.4% 2019 5.9% 2018 -4.3% 2017 28.1% 2016 12.5% Fund Manager information for ICICI Prudential Multi-Asset Fund
Name Since Tenure Sankaran Naren 1 Feb 12 14.42 Yr. Manish Banthia 22 Jan 24 2.44 Yr. Akhil Kakkar 22 Jan 24 2.44 Yr. Sri Sharma 30 Apr 21 5.17 Yr. Gaurav Chikane 2 Aug 21 4.91 Yr. Sharmila D'Silva 31 Jul 22 3.92 Yr. Masoomi Jhurmarvala 4 Nov 24 1.65 Yr. Antariksha Banerjee 15 Jun 26 0.04 Yr. Data below for ICICI Prudential Multi-Asset Fund as on 30 Jun 26
Asset Allocation
Asset Class Value Cash 16.68% Equity 61.7% Debt 10.87% Other 10.74% Equity Sector Allocation
Sector Value Financial Services 22.64% Consumer Cyclical 12.36% Industrials 5.86% Consumer Defensive 5.41% Basic Materials 4.65% Technology 4.38% Health Care 3.13% Energy 2.78% Real Estate 2.25% Utility 2.1% Communication Services 2% Debt Sector Allocation
Sector Value Cash Equivalent 14.32% Corporate 7.18% Government 6.05% Credit Quality
Rating Value A 1.13% AA 24.49% AAA 72.52% Top Securities Holdings / Portfolio
Name Holding Value Quantity ICICI Pru Gold ETF
- | -11% ₹9,200 Cr 691,140,357
↑ 19,800,000 HDFC Bank Ltd (Financial Services)
Equity, Since 31 Jan 22 | HDFCBANK6% ₹4,834 Cr 64,922,283
↑ 13,682,715 ICICI Bank Ltd (Financial Services)
Equity, Since 31 May 06 | ICICIBANK3% ₹2,678 Cr 21,315,375 Bajaj Finserv Ltd (Financial Services)
Equity, Since 31 Jan 24 | BAJAJFINSV3% ₹2,236 Cr 12,533,749
↓ -421,423 Axis Bank Ltd (Financial Services)
Equity, Since 31 Dec 20 | AXISBANK2% ₹2,067 Cr 16,068,164
↓ -628,125 Infosys Ltd (Technology)
Equity, Since 31 Oct 19 | INFY2% ₹1,966 Cr 16,935,773
↓ -400,000 InterGlobe Aviation Ltd (Industrials)
Equity, Since 28 Feb 23 | INDIGO2% ₹1,822 Cr 4,135,656
↓ -361,200 ITC Ltd (Consumer Defensive)
Equity, Since 31 Mar 24 | ITC2% ₹1,683 Cr 58,664,918 Reliance Industries Ltd (Energy)
Equity, Since 31 Dec 20 | RELIANCE2% ₹1,587 Cr 12,011,792 Maruti Suzuki India Ltd (Consumer Cyclical)
Equity, Since 31 Aug 21 | MARUTI2% ₹1,506 Cr 1,147,022 4. IDBI Hybrid Equity Fund
IDBI Hybrid Equity Fund
Normal Dividend, Payout Launch Date 24 Oct 16 NAV (28 Jul 23) ₹15.626 ↓ -0.01 (-0.05 %) Net Assets (Cr) ₹179 on 30 Jun 23 Category Hybrid - Hybrid Equity AMC IDBI Asset Management Limited Rating Risk Moderately High Expense Ratio 2.52 Sharpe Ratio 1.03 Information Ratio -1.05 Alpha Ratio -0.26 Min Investment 5,000 Min SIP Investment 500 Exit Load NIL Growth of 10,000 investment over the years.
Date Value 30 Jun 21 ₹10,000 30 Jun 22 ₹9,822 30 Jun 23 ₹11,551 Returns for IDBI Hybrid Equity Fund
absolute basis & more than 1 year are on CAGR (Compound Annual Growth Rate) basis. as on 22 Jul 26 Duration Returns 1 Month 2.1% 3 Month 7.8% 6 Month 9.8% 1 Year 12.1% 3 Year 14.4% 5 Year 7.1% 10 Year 15 Year Since launch 8.3% Historical performance (Yearly) on absolute basis
Year Returns 2025 2024 2023 2022 2021 2020 2019 2018 2017 2016 Fund Manager information for IDBI Hybrid Equity Fund
Name Since Tenure Data below for IDBI Hybrid Equity Fund as on 30 Jun 23
Asset Allocation
Asset Class Value Equity Sector Allocation
Sector Value Debt Sector Allocation
Sector Value Credit Quality
Rating Value Top Securities Holdings / Portfolio
Name Holding Value Quantity 5. Edelweiss Multi Asset Allocation Fund
Edelweiss Multi Asset Allocation Fund
Normal Dividend, Payout Launch Date 16 Jun 09 NAV (22 Jul 26) ₹64.73 ↓ -0.41 (-0.63 %) Net Assets (Cr) ₹3,784 on 30 Jun 26 Category Hybrid - Multi Asset AMC Edelweiss Asset Management Limited Rating ☆ Risk Moderately High Expense Ratio 1.98 Sharpe Ratio -0.48 Information Ratio 1.46 Alpha Ratio -1.02 Min Investment 5,000 Min SIP Investment 500 Exit Load NIL Growth of 10,000 investment over the years.
Date Value 30 Jun 21 ₹10,000 30 Jun 22 ₹10,882 30 Jun 23 ₹14,017 30 Jun 24 ₹19,438 30 Jun 25 ₹21,508 30 Jun 26 ₹21,247
Purchase not allowed Returns for Edelweiss Multi Asset Allocation Fund
absolute basis & more than 1 year are on CAGR (Compound Annual Growth Rate) basis. as on 22 Jul 26 Duration Returns 1 Month -0.5% 3 Month 0.6% 6 Month 1.6% 1 Year 0.6% 3 Year 14.2% 5 Year 16.1% 10 Year 15 Year Since launch 14.4% Historical performance (Yearly) on absolute basis
Year Returns 2025 6% 2024 23.7% 2023 31.2% 2022 10.4% 2021 34.7% 2020 22.7% 2019 14% 2018 1.1% 2017 33% 2016 6.5% Fund Manager information for Edelweiss Multi Asset Allocation Fund
Name Since Tenure Kedar Karnik 15 Jan 26 0.46 Yr. Bhavesh Jain 14 Oct 15 10.72 Yr. Bharat Lahoti 1 Oct 21 4.75 Yr. Rahul Dedhia 1 Jul 24 2 Yr. Data below for Edelweiss Multi Asset Allocation Fund as on 30 Jun 26
Asset Allocation
Asset Class Value Cash 9.07% Equity 77.65% Debt 13.27% Other 0.01% Equity Sector Allocation
Sector Value Financial Services 23.18% Consumer Cyclical 8.98% Health Care 8.48% Basic Materials 7.76% Industrials 7.29% Consumer Defensive 5.52% Communication Services 4.42% Technology 3.29% Energy 3.21% Utility 2.83% Real Estate 1.9% Debt Sector Allocation
Sector Value Corporate 10.94% Cash Equivalent 6.77% Government 4.64% Credit Quality
Rating Value AAA 100% Top Securities Holdings / Portfolio
Name Holding Value Quantity ICICI Bank Ltd (Financial Services)
Equity, Since 31 Mar 15 | ICICIBANK4% ₹143 Cr 1,141,855
↓ -93,934 National Bank For Agriculture And Rural Development
Debentures | -4% ₹139 Cr 14,000,000 HDFC Bank Ltd (Financial Services)
Equity, Since 31 Oct 15 | HDFCBANK3% ₹124 Cr 1,667,382 Bharti Airtel Ltd (Communication Services)
Equity, Since 31 Oct 19 | BHARTIARTL3% ₹123 Cr 673,607 State Bank of India (Financial Services)
Equity, Since 30 Jun 15 | SBIN3% ₹122 Cr 1,264,882 Reliance Industries Ltd (Energy)
Equity, Since 31 Aug 20 | RELIANCE3% ₹98 Cr 740,965
↑ 55,946 NTPC Ltd (Utilities)
Equity, Since 30 Nov 21 | NTPC2% ₹82 Cr 2,112,334 Sun Pharmaceuticals Industries Ltd (Healthcare)
Equity, Since 31 Oct 19 | SUNPHARMA2% ₹81 Cr 451,425
↑ 59,969 Aditya Birla Capital Limited
Debentures | -2% ₹75 Cr 7,500,000 Hdb Financial Services Limited
Debentures | -2% ₹75 Cr 7,500,000 6. Baroda Pioneer Hybrid Equity Fund
Baroda Pioneer Hybrid Equity Fund
Normal Dividend, Payout Launch Date 12 Sep 03 NAV (11 Mar 22) ₹18.8096 ↑ 0.08 (0.45 %) Net Assets (Cr) ₹389 on 31 Jan 22 Category Hybrid - Hybrid Equity AMC Baroda Pioneer Asset Management Co. Ltd. Rating ☆☆☆ Risk Moderately High Expense Ratio 2.48 Sharpe Ratio 2.59 Information Ratio -0.17 Alpha Ratio 6.52 Min Investment 5,000 Min SIP Investment 500 Exit Load 0-12 Months (1%),12 Months and above(NIL) Growth of 10,000 investment over the years.
Date Value 30 Jun 21 ₹10,000 Returns for Baroda Pioneer Hybrid Equity Fund
absolute basis & more than 1 year are on CAGR (Compound Annual Growth Rate) basis. as on 22 Jul 26 Duration Returns 1 Month -2.8% 3 Month -3.5% 6 Month -0.8% 1 Year 14.8% 3 Year 13.8% 5 Year 10.7% 10 Year 15 Year Since launch 11.7% Historical performance (Yearly) on absolute basis
Year Returns 2025 2024 2023 2022 2021 2020 2019 2018 2017 2016 Fund Manager information for Baroda Pioneer Hybrid Equity Fund
Name Since Tenure Data below for Baroda Pioneer Hybrid Equity Fund as on 31 Jan 22
Asset Allocation
Asset Class Value Equity Sector Allocation
Sector Value Debt Sector Allocation
Sector Value Credit Quality
Rating Value Top Securities Holdings / Portfolio
Name Holding Value Quantity
यहां प्रदान की गई जानकारी सटीक है, यह सुनिश्चित करने के लिए सभी प्रयास किए गए हैं। हालांकि, डेटा की शुद्धता के संबंध में कोई गारंटी नहीं दी जाती है। कृपया कोई भी निवेश करने से पहले योजना सूचना दस्तावेज के साथ सत्यापित करें।


AMFI Registration No. 112358 | CIN: U74999MH2016PTC282153
Shepard Technologies Pvt. Ltd. (with ARN code 112358) makes no warranties or representations, express or implied, on products offered through the platform. It accepts no liability for any damages or losses, however caused, in connection with the use of, or on the reliance of its product or related services. Terms and conditions of the website are applicable.
©2026 Shepard Technologies Private Limited. All Rights Reserved
Research Highlights for BOI AXA Mid and Small Cap Equity and Debt Fund