SIP 2022 – 2023 ಗಾಗಿ ಭಾರತದಲ್ಲಿ ಅತ್ಯುತ್ತಮ ಮ್ಯೂಚುಯಲ್ ಫಂಡ್ಗಳು
ಒಂದು ವ್ಯವಸ್ಥಿತಹೂಡಿಕೆ ಯೋಜನೆ (SIP) ಅತ್ಯಂತ ಪರಿಣಾಮಕಾರಿ ಮಾರ್ಗವೆಂದು ಪರಿಗಣಿಸಲಾಗಿದೆಮ್ಯೂಚುವಲ್ ಫಂಡ್ಗಳಲ್ಲಿ ಹೂಡಿಕೆ ಮಾಡಿ, ವಿಶೇಷವಾಗಿ ದೀರ್ಘಕಾಲ-ಅವಧಿ ಯೋಜನೆ. ದೀರ್ಘಾವಧಿಯ ಉಳಿತಾಯ ಯೋಜನೆಯನ್ನು ಕಾರ್ಯಗತಗೊಳಿಸಲು ಹೂಡಿಕೆದಾರರಿಗೆ ಪ್ರತಿ ತಿಂಗಳು ನಿರ್ದಿಷ್ಟ ದಿನಾಂಕದಂದು ಘಟಕವನ್ನು ಖರೀದಿಸಲು ಇದು ಅನುಮತಿಸುತ್ತದೆ. ಹೂಡಿಕೆದಾರರು ಹಾಯಾಗಿರಲು ಕಾರಣಗಳಲ್ಲಿ ಒಂದಾಗಿದೆಹೂಡಿಕೆ SIP ನಲ್ಲಿ ಅವರು ನೀಡುವ ನಮ್ಯತೆ. ಹೂಡಿಕೆದಾರರು ಮಾಡಬಹುದುSIP ನಲ್ಲಿ ಹೂಡಿಕೆ ಮಾಡಿ ಮಾಸಿಕ, ತ್ರೈಮಾಸಿಕ ಅಥವಾ ವಾರಕ್ಕೊಮ್ಮೆಆಧಾರ, ಅವರ ಅನುಕೂಲಕ್ಕೆ ತಕ್ಕಂತೆ. ಒಬ್ಬರು ಅದನ್ನು ಹೇಗೆ ಸಾಧಿಸಬಹುದು ಎಂಬುದರ ಕುರಿತು ಇನ್ನಷ್ಟು ತಿಳಿದುಕೊಳ್ಳೋಣಹಣಕಾಸಿನ ಗುರಿಗಳು ವ್ಯವಸ್ಥಿತ ಹೂಡಿಕೆ ಯೋಜನೆಗಳೊಂದಿಗೆ, ಹೇಗೆಸಿಪ್ ಕ್ಯಾಲ್ಕುಲೇಟರ್ ಜೊತೆಗೆ ಹೂಡಿಕೆಯಲ್ಲಿ ಸಹಕಾರಿಯಾಗಿದೆಅತ್ಯುತ್ತಮ ಮ್ಯೂಚುಯಲ್ ಫಂಡ್ಗಳು SIP ಗಾಗಿ ಭಾರತದಲ್ಲಿ.
SIP- ಆರ್ಥಿಕ ಗುರಿಗಳನ್ನು ಸಾಧಿಸಲು ಸೂಕ್ತ ಮಾರ್ಗ
SIP ಅನ್ನು ಸುಲಭವಾಗಿ ತಮ್ಮ ಹೂಡಿಕೆಗಳನ್ನು ಪೂರ್ವ-ಯೋಜನೆ ಮತ್ತು ಅವರ ಹಣಕಾಸಿನ ಗುರಿಗಳಿಗೆ ಅನುಗುಣವಾಗಿ ಹೂಡಿಕೆ ಮಾಡುವ ರೀತಿಯಲ್ಲಿ ವಿನ್ಯಾಸಗೊಳಿಸಲಾಗಿದೆ. ಆದರೆ, SIP ಮೂಲಕ ಗುರಿಗಳನ್ನು ಸಾಧಿಸಲು ದೀರ್ಘಕಾಲ ಹೂಡಿಕೆ ಮಾಡಬೇಕು. ಸಾಮಾನ್ಯವಾಗಿ, SIP ಅನ್ನು ಗುರಿಗಳನ್ನು ಯೋಜಿಸಲು ವ್ಯಾಪಕವಾಗಿ ಬಳಸಲಾಗುತ್ತದೆ-
Talk to our investment specialist
- ಕಾರು ಖರೀದಿ
- ಮನೆ ಖರೀದಿ
- ಮದುವೆ
- ಮಗುವಿನ ಶಿಕ್ಷಣ
- ಅಂತರರಾಷ್ಟ್ರೀಯ ಪ್ರವಾಸಕ್ಕಾಗಿ ಉಳಿಸಿ
- ನಿವೃತ್ತಿ
- ವೈದ್ಯಕೀಯ ತುರ್ತುಸ್ಥಿತಿಗಳು ಇತ್ಯಾದಿ.
ಒಬ್ಬರು ಕನಿಷ್ಠ INR 500 ಮತ್ತು INR 1000 ಮೊತ್ತದೊಂದಿಗೆ SIP ಗಳಲ್ಲಿ ಹೂಡಿಕೆ ಮಾಡಲು ಪ್ರಾರಂಭಿಸಬಹುದು. ಒಮ್ಮೆ ನೀವು SIP ನಲ್ಲಿ ಹೂಡಿಕೆ ಮಾಡಲು ಪ್ರಾರಂಭಿಸಿದ ನಂತರ ನಿಮ್ಮ ಹಣವು ಸ್ಟಾಕ್ಗೆ ತೆರೆದುಕೊಂಡಂತೆ ಪ್ರತಿದಿನವೂ ಹೋಗಲಾರಂಭಿಸುತ್ತದೆಮಾರುಕಟ್ಟೆ. ಅದಕ್ಕಾಗಿಯೇ SIP ಗಳನ್ನು ಒಂದು ಮಾರ್ಗವಾಗಿ ಹೆಚ್ಚಾಗಿ ಆದ್ಯತೆ ನೀಡಲಾಗುತ್ತದೆಇಕ್ವಿಟಿ ಫಂಡ್ಗಳು. ಇದಲ್ಲದೆ, ಐತಿಹಾಸಿಕವಾಗಿ, ಈಕ್ವಿಟಿ ಸ್ಟಾಕ್ಗಳಲ್ಲಿನ ಹೂಡಿಕೆಯು ಇತರ ಎಲ್ಲಾ ಆಸ್ತಿ ವರ್ಗಗಳ ನಡುವೆ ಪ್ರಭಾವಶಾಲಿ ಆದಾಯವನ್ನು ನೀಡಿದೆ, ಹೂಡಿಕೆಯನ್ನು ಶಿಸ್ತು ಮತ್ತು ದೀರ್ಘಾವಧಿಯ ಹಾರಿಜಾನ್ನೊಂದಿಗೆ ಮಾಡಿದ್ದರೆ.
ಇಕ್ವಿಟಿಯಲ್ಲಿನ SIP ಮಾರುಕಟ್ಟೆಯ ಸಮಯದ ಅಪಾಯವನ್ನು ತಪ್ಪಿಸಲು ಸಹಾಯ ಮಾಡುತ್ತದೆ ಮತ್ತು ಹೂಡಿಕೆಯ ವೆಚ್ಚವನ್ನು ಸರಾಸರಿ ಮಾಡುವ ಮೂಲಕ ಸಂಪತ್ತು ಸೃಷ್ಟಿಗೆ ಅನುಕೂಲವಾಗುತ್ತದೆ. ಇನ್ನು ಕೆಲವನ್ನು ನೋಡೋಣSIP ನ ಪ್ರಯೋಜನಗಳು ಇದು ದೀರ್ಘಕಾಲೀನ ಗುರಿಗಳನ್ನು ಸಾಧಿಸಲು ಸಹಾಯ ಮಾಡುತ್ತದೆ:
ಸಂಯೋಜನೆಯ ಶಕ್ತಿ- ನೀವು ಅಸಲು ಮಾತ್ರ ಆಸಕ್ತಿಯನ್ನು ಪಡೆದಾಗ ಸರಳ ಆಸಕ್ತಿ. ಚಕ್ರಬಡ್ಡಿಯ ಸಂದರ್ಭದಲ್ಲಿ, ಬಡ್ಡಿ ಮೊತ್ತವನ್ನು ಅಸಲಿಗೆ ಸೇರಿಸಲಾಗುತ್ತದೆ ಮತ್ತು ಹೊಸ ಅಸಲು (ಹಳೆಯ ಅಸಲು ಮತ್ತು ಲಾಭಗಳು) ಮೇಲೆ ಬಡ್ಡಿಯನ್ನು ಲೆಕ್ಕಹಾಕಲಾಗುತ್ತದೆ. ಈ ಪ್ರಕ್ರಿಯೆಯು ಪ್ರತಿ ಬಾರಿಯೂ ಮುಂದುವರಿಯುತ್ತದೆ. SIP ರಿಂದಮ್ಯೂಚುಯಲ್ ಫಂಡ್ಗಳು ಕಂತುಗಳಲ್ಲಿ ಇವೆ, ಅವು ಸಂಯುಕ್ತವಾಗಿರುತ್ತವೆ, ಇದು ಆರಂಭದಲ್ಲಿ ಹೂಡಿಕೆ ಮಾಡಿದ ಮೊತ್ತಕ್ಕೆ ಹೆಚ್ಚಿನದನ್ನು ಸೇರಿಸುತ್ತದೆ.
ಅಪಾಯ ಕಡಿತ- ಒಂದು SIP ದೀರ್ಘಾವಧಿಯವರೆಗೆ ಹರಡಿರುವುದರಿಂದ, ಒಬ್ಬರು ಷೇರು ಮಾರುಕಟ್ಟೆಯ ಎಲ್ಲಾ ಅವಧಿಗಳು, ಏರಿಳಿತಗಳು ಮತ್ತು ಹೆಚ್ಚು ಮುಖ್ಯವಾಗಿ ಕುಸಿತಗಳನ್ನು ಹಿಡಿಯುತ್ತಾರೆ. ಕುಸಿತಗಳಲ್ಲಿ, ಹೆಚ್ಚಿನ ಹೂಡಿಕೆದಾರರನ್ನು ಭಯವು ಸೆಳೆದಾಗ, SIP ಕಂತುಗಳು ಹೂಡಿಕೆದಾರರು "ಕಡಿಮೆ" ಖರೀದಿಸುವುದನ್ನು ಖಾತ್ರಿಪಡಿಸುವುದನ್ನು ಮುಂದುವರಿಸುತ್ತವೆ.
SIP ಗಳ ಅನುಕೂಲತೆ- ಅನುಕೂಲತೆಯು SIP ಯ ದೊಡ್ಡ ಪ್ರಯೋಜನಗಳಲ್ಲಿ ಒಂದಾಗಿದೆ. ಬಳಕೆದಾರರು ಒಂದು ಬಾರಿ ಸೈನ್-ಅಪ್ ಮಾಡಬೇಕು ಮತ್ತು ದಾಖಲೆಗಳ ಮೂಲಕ ಹೋಗಬೇಕು. ಒಮ್ಮೆ ಮಾಡಿದ ನಂತರ, ನಂತರದ ಹೂಡಿಕೆಗಳಿಗೆ ಡೆಬಿಟ್ಗಳು ಸ್ವಯಂಚಾಲಿತವಾಗಿ ನಡೆಯುತ್ತವೆಹೂಡಿಕೆದಾರ ಕೇವಲ ಹೂಡಿಕೆಗಳನ್ನು ಮೇಲ್ವಿಚಾರಣೆ ಮಾಡಬೇಕು.
SIP 2022 - 2023 ಗಾಗಿ ಭಾರತದಲ್ಲಿ ಅತ್ಯುತ್ತಮ ಮ್ಯೂಚುಯಲ್ ಫಂಡ್ಗಳು
SIP ಗಾಗಿ ಅತ್ಯುತ್ತಮ ಲಾರ್ಜ್ ಕ್ಯಾಪ್ ಫಂಡ್ಗಳು
Fund NAV Net Assets (Cr) Min SIP Investment 3 MO (%) 6 MO (%) 1 YR (%) 3 YR (%) 5 YR (%) 2024 (%) Invesco India Largecap Fund Growth ₹72.47
↑ 0.57 ₹1,847 100 7.5 5 5.9 13.5 12.1 5.5 Bandhan Large Cap Fund Growth ₹78.741
↑ 0.25 ₹2,061 100 4.3 1.2 2.5 12.5 11.7 8.2 ICICI Prudential Bluechip Fund Growth ₹109.76
↑ 0.34 ₹79,421 100 2.9 -1.8 0 12.1 13.2 11.3 Nippon India Large Cap Fund Growth ₹90.5135
↑ 0.23 ₹53,227 100 2.1 -0.8 0.4 11.9 14.9 9.2 DSP TOP 100 Equity Growth ₹463.475
↑ 1.75 ₹7,190 500 2.6 -2.4 -1.3 11.5 10.4 8.4 Note: Returns up to 1 year are on absolute basis & more than 1 year are on CAGR basis. as on 31 Jul 26 Research Highlights & Commentary of 5 Funds showcased
Commentary Invesco India Largecap Fund Bandhan Large Cap Fund ICICI Prudential Bluechip Fund Nippon India Large Cap Fund DSP TOP 100 Equity Point 1 Bottom quartile AUM (₹1,847 Cr). Bottom quartile AUM (₹2,061 Cr). Highest AUM (₹79,421 Cr). Upper mid AUM (₹53,227 Cr). Lower mid AUM (₹7,190 Cr). Point 2 Established history (16+ yrs). Established history (20+ yrs). Established history (18+ yrs). Established history (18+ yrs). Oldest track record among peers (23 yrs). Point 3 Rating: 3★ (lower mid). Rating: 2★ (bottom quartile). Top rated. Rating: 4★ (upper mid). Rating: 2★ (bottom quartile). Point 4 Risk profile: Moderately High. Risk profile: Moderately High. Risk profile: Moderately High. Risk profile: Moderately High. Risk profile: Moderately High. Point 5 5Y return: 12.12% (lower mid). 5Y return: 11.66% (bottom quartile). 5Y return: 13.21% (upper mid). 5Y return: 14.95% (top quartile). 5Y return: 10.41% (bottom quartile). Point 6 3Y return: 13.55% (top quartile). 3Y return: 12.50% (upper mid). 3Y return: 12.13% (lower mid). 3Y return: 11.92% (bottom quartile). 3Y return: 11.48% (bottom quartile). Point 7 1Y return: 5.93% (top quartile). 1Y return: 2.51% (upper mid). 1Y return: -0.01% (bottom quartile). 1Y return: 0.41% (lower mid). 1Y return: -1.33% (bottom quartile). Point 8 Alpha: 3.75 (top quartile). Alpha: 2.34 (upper mid). Alpha: -1.21 (bottom quartile). Alpha: 1.07 (lower mid). Alpha: -2.70 (bottom quartile). Point 9 Sharpe: -0.25 (top quartile). Sharpe: -0.35 (upper mid). Sharpe: -0.55 (bottom quartile). Sharpe: -0.43 (lower mid). Sharpe: -0.68 (bottom quartile). Point 10 Information ratio: 0.82 (lower mid). Information ratio: 0.63 (bottom quartile). Information ratio: 0.85 (upper mid). Information ratio: 0.98 (top quartile). Information ratio: 0.53 (bottom quartile). Invesco India Largecap Fund
Bandhan Large Cap Fund
ICICI Prudential Bluechip Fund
Nippon India Large Cap Fund
DSP TOP 100 Equity
SIP ಗಾಗಿ ಅತ್ಯುತ್ತಮ ಮಲ್ಟಿ ಕ್ಯಾಪ್ ಫಂಡ್ಗಳು
Fund NAV Net Assets (Cr) Min SIP Investment 3 MO (%) 6 MO (%) 1 YR (%) 3 YR (%) 5 YR (%) 2024 (%) Aditya Birla Sun Life Manufacturing Equity Fund Growth ₹38.44
↑ 0.31 ₹1,229 1,000 8.9 19.7 21.8 19.7 14.4 3.5 Motilal Oswal Multicap 35 Fund Growth ₹61.5094
↑ 0.31 ₹13,294 500 10.5 7 -0.3 18.7 12.4 -5.6 BNP Paribas Multi Cap Fund Growth ₹73.5154
↓ -0.01 ₹588 300 -4.6 -2.6 19.3 17.3 13.6 Mahindra Badhat Yojana Growth ₹38.4617
↑ 0.10 ₹6,926 500 6.7 9 8.7 16.8 15.3 3.4 ICICI Prudential Multicap Fund Growth ₹858.09
↑ 6.67 ₹18,194 100 5.2 9.7 8.1 16.5 15.3 5.7 Note: Returns up to 1 year are on absolute basis & more than 1 year are on CAGR basis. as on 31 Jul 26 Research Highlights & Commentary of 5 Funds showcased
Commentary Aditya Birla Sun Life Manufacturing Equity Fund Motilal Oswal Multicap 35 Fund BNP Paribas Multi Cap Fund Mahindra Badhat Yojana ICICI Prudential Multicap Fund Point 1 Bottom quartile AUM (₹1,229 Cr). Upper mid AUM (₹13,294 Cr). Bottom quartile AUM (₹588 Cr). Lower mid AUM (₹6,926 Cr). Highest AUM (₹18,194 Cr). Point 2 Established history (11+ yrs). Established history (12+ yrs). Established history (20+ yrs). Established history (9+ yrs). Oldest track record among peers (31 yrs). Point 3 Not Rated. Top rated. Rating: 4★ (upper mid). Not Rated. Rating: 3★ (lower mid). Point 4 Risk profile: High. Risk profile: Moderately High. Risk profile: Moderately High. Risk profile: Moderately High. Risk profile: Moderately High. Point 5 5Y return: 14.39% (lower mid). 5Y return: 12.41% (bottom quartile). 5Y return: 13.57% (bottom quartile). 5Y return: 15.32% (top quartile). 5Y return: 15.29% (upper mid). Point 6 3Y return: 19.72% (top quartile). 3Y return: 18.75% (upper mid). 3Y return: 17.28% (lower mid). 3Y return: 16.76% (bottom quartile). 3Y return: 16.48% (bottom quartile). Point 7 1Y return: 21.76% (top quartile). 1Y return: -0.33% (bottom quartile). 1Y return: 19.34% (upper mid). 1Y return: 8.75% (lower mid). 1Y return: 8.11% (bottom quartile). Point 8 Alpha: 0.00 (lower mid). Alpha: -7.36 (bottom quartile). Alpha: 0.00 (bottom quartile). Alpha: 4.46 (upper mid). Alpha: 6.49 (top quartile). Point 9 Sharpe: 0.54 (upper mid). Sharpe: -0.74 (bottom quartile). Sharpe: 2.86 (top quartile). Sharpe: 0.01 (bottom quartile). Sharpe: 0.09 (lower mid). Point 10 Information ratio: 0.00 (bottom quartile). Information ratio: 0.53 (lower mid). Information ratio: 0.00 (bottom quartile). Information ratio: 0.64 (top quartile). Information ratio: 0.61 (upper mid). Aditya Birla Sun Life Manufacturing Equity Fund
Motilal Oswal Multicap 35 Fund
BNP Paribas Multi Cap Fund
Mahindra Badhat Yojana
ICICI Prudential Multicap Fund
SIP ಗಾಗಿ ಅತ್ಯುತ್ತಮ ಮಿಡ್ ಕ್ಯಾಪ್ ಫಂಡ್ಗಳು
Fund NAV Net Assets (Cr) Min SIP Investment 3 MO (%) 6 MO (%) 1 YR (%) 3 YR (%) 5 YR (%) 2024 (%) ICICI Prudential MidCap Fund Growth ₹338.35
↑ 3.08 ₹7,846 100 2.7 10.1 14 21.8 17.1 11.1 BNP Paribas Mid Cap Fund Growth ₹111.57
↑ 0.71 ₹2,513 300 4.7 8.2 11.1 17.7 14.8 2.5 Aditya Birla Sun Life Midcap Fund Growth ₹840.89
↑ 1.78 ₹6,624 1,000 5.9 9 7.2 16.2 14.4 4.4 TATA Mid Cap Growth Fund Growth ₹462.27
↑ 1.26 ₹5,868 150 5 6.2 7.6 15.9 15.2 5.8 Note: Returns up to 1 year are on absolute basis & more than 1 year are on CAGR basis. as on 31 Jul 26 Research Highlights & Commentary of 4 Funds showcased
Commentary ICICI Prudential MidCap Fund BNP Paribas Mid Cap Fund Aditya Birla Sun Life Midcap Fund TATA Mid Cap Growth Fund Point 1 Highest AUM (₹7,846 Cr). Bottom quartile AUM (₹2,513 Cr). Upper mid AUM (₹6,624 Cr). Lower mid AUM (₹5,868 Cr). Point 2 Established history (21+ yrs). Established history (20+ yrs). Established history (23+ yrs). Oldest track record among peers (32 yrs). Point 3 Rating: 2★ (lower mid). Top rated. Rating: 3★ (upper mid). Rating: 2★ (bottom quartile). Point 4 Risk profile: Moderately High. Risk profile: High. Risk profile: Moderately High. Risk profile: Moderately High. Point 5 5Y return: 17.12% (top quartile). 5Y return: 14.79% (lower mid). 5Y return: 14.35% (bottom quartile). 5Y return: 15.16% (upper mid). Point 6 3Y return: 21.81% (top quartile). 3Y return: 17.66% (upper mid). 3Y return: 16.17% (lower mid). 3Y return: 15.94% (bottom quartile). Point 7 1Y return: 14.01% (top quartile). 1Y return: 11.06% (upper mid). 1Y return: 7.24% (bottom quartile). 1Y return: 7.55% (lower mid). Point 8 Alpha: 6.02 (top quartile). Alpha: 3.32 (upper mid). Alpha: -0.17 (lower mid). Alpha: -0.52 (bottom quartile). Point 9 Sharpe: 0.32 (top quartile). Sharpe: 0.22 (upper mid). Sharpe: 0.01 (lower mid). Sharpe: -0.01 (bottom quartile). Point 10 Information ratio: 0.87 (top quartile). Information ratio: -0.21 (upper mid). Information ratio: -0.44 (lower mid). Information ratio: -0.66 (bottom quartile). ICICI Prudential MidCap Fund
BNP Paribas Mid Cap Fund
Aditya Birla Sun Life Midcap Fund
TATA Mid Cap Growth Fund
SIP ಗಾಗಿ ಅತ್ಯುತ್ತಮ ಸ್ಮಾಲ್ ಕ್ಯಾಪ್ ಫಂಡ್ಗಳು
Fund NAV Net Assets (Cr) Min SIP Investment 3 MO (%) 6 MO (%) 1 YR (%) 3 YR (%) 5 YR (%) 2024 (%) Sundaram Small Cap Fund Growth ₹286.659
↑ 1.70 ₹3,872 100 6.7 14.3 10.8 16.8 16 0.4 IDBI Small Cap Fund Growth ₹33.3898
↑ 0.27 ₹743 500 9.1 20 9.5 16.7 17 -13.4 DSP Small Cap Fund Growth ₹220.438
↑ 0.67 ₹19,635 500 8.9 18.6 10.4 16.3 16.5 -2.8 Nippon India Small Cap Fund Growth ₹179.922
↑ 1.16 ₹78,407 100 5.6 13 6.2 15.9 18.4 -4.7 Aditya Birla Sun Life Small Cap Fund Growth ₹96.6213
↑ 0.64 ₹5,731 1,000 8.8 17.5 12.8 15.1 12.4 -3.7 Note: Returns up to 1 year are on absolute basis & more than 1 year are on CAGR basis. as on 31 Jul 26 Research Highlights & Commentary of 5 Funds showcased
Commentary Sundaram Small Cap Fund IDBI Small Cap Fund DSP Small Cap Fund Nippon India Small Cap Fund Aditya Birla Sun Life Small Cap Fund Point 1 Bottom quartile AUM (₹3,872 Cr). Bottom quartile AUM (₹743 Cr). Upper mid AUM (₹19,635 Cr). Highest AUM (₹78,407 Cr). Lower mid AUM (₹5,731 Cr). Point 2 Oldest track record among peers (21 yrs). Established history (9+ yrs). Established history (19+ yrs). Established history (15+ yrs). Established history (19+ yrs). Point 3 Rating: 3★ (bottom quartile). Not Rated. Rating: 4★ (upper mid). Rating: 4★ (lower mid). Top rated. Point 4 Risk profile: Moderately High. Risk profile: Moderately High. Risk profile: Moderately High. Risk profile: Moderately High. Risk profile: Moderately High. Point 5 5Y return: 16.00% (bottom quartile). 5Y return: 17.01% (upper mid). 5Y return: 16.54% (lower mid). 5Y return: 18.43% (top quartile). 5Y return: 12.43% (bottom quartile). Point 6 3Y return: 16.83% (top quartile). 3Y return: 16.70% (upper mid). 3Y return: 16.27% (lower mid). 3Y return: 15.86% (bottom quartile). 3Y return: 15.12% (bottom quartile). Point 7 1Y return: 10.83% (upper mid). 1Y return: 9.50% (bottom quartile). 1Y return: 10.38% (lower mid). 1Y return: 6.20% (bottom quartile). 1Y return: 12.80% (top quartile). Point 8 Alpha: 8.89 (upper mid). Alpha: 9.18 (top quartile). Alpha: 0.00 (bottom quartile). Alpha: 3.21 (lower mid). Alpha: 0.00 (bottom quartile). Point 9 Sharpe: 0.25 (upper mid). Sharpe: 0.27 (top quartile). Sharpe: 0.19 (bottom quartile). Sharpe: 0.02 (bottom quartile). Sharpe: 0.22 (lower mid). Point 10 Information ratio: -0.17 (lower mid). Information ratio: -0.23 (bottom quartile). Information ratio: 0.00 (top quartile). Information ratio: -0.27 (bottom quartile). Information ratio: 0.00 (upper mid). Sundaram Small Cap Fund
IDBI Small Cap Fund
DSP Small Cap Fund
Nippon India Small Cap Fund
Aditya Birla Sun Life Small Cap Fund
SIP ಗಾಗಿ ಅತ್ಯುತ್ತಮ ELSS (ತೆರಿಗೆ ಉಳಿತಾಯ ಮ್ಯೂಚುಯಲ್ ಫಂಡ್ಗಳು).
Fund NAV Net Assets (Cr) Min SIP Investment 3 MO (%) 6 MO (%) 1 YR (%) 3 YR (%) 5 YR (%) 2024 (%) IDBI Equity Advantage Fund Growth ₹43.39
↑ 0.04 ₹485 500 9.7 15.1 16.9 20.8 10 HDFC Long Term Advantage Fund Growth ₹595.168
↑ 0.28 ₹1,318 500 1.2 15.4 35.5 20.6 17.4 Motilal Oswal Long Term Equity Fund Growth ₹54.6311
↑ 0.63 ₹4,862 500 1.9 12.3 5.2 20.2 16.3 -9.1 Baroda Pioneer ELSS 96 Growth ₹68.6676
↑ 0.33 ₹210 500 -6.1 -3.5 17.6 16.7 11.6 JM Tax Gain Fund Growth ₹51.8462
↑ 0.32 ₹232 500 9.8 9.5 8.3 15.8 14.8 2.5 Note: Returns up to 1 year are on absolute basis & more than 1 year are on CAGR basis. as on 28 Jul 23 Research Highlights & Commentary of 5 Funds showcased
Commentary IDBI Equity Advantage Fund HDFC Long Term Advantage Fund Motilal Oswal Long Term Equity Fund Baroda Pioneer ELSS 96 JM Tax Gain Fund Point 1 Lower mid AUM (₹485 Cr). Upper mid AUM (₹1,318 Cr). Highest AUM (₹4,862 Cr). Bottom quartile AUM (₹210 Cr). Bottom quartile AUM (₹232 Cr). Point 2 Established history (12+ yrs). Oldest track record among peers (25 yrs). Established history (11+ yrs). Established history (11+ yrs). Established history (18+ yrs). Point 3 Top rated. Rating: 3★ (upper mid). Not Rated. Not Rated. Rating: 3★ (lower mid). Point 4 Risk profile: Moderately High. Risk profile: Moderately High. Risk profile: Moderately High. Risk profile: Moderately High. Risk profile: Moderately High. Point 5 5Y return: 9.97% (bottom quartile). 5Y return: 17.39% (top quartile). 5Y return: 16.33% (upper mid). 5Y return: 11.62% (bottom quartile). 5Y return: 14.83% (lower mid). Point 6 3Y return: 20.84% (top quartile). 3Y return: 20.64% (upper mid). 3Y return: 20.25% (lower mid). 3Y return: 16.70% (bottom quartile). 3Y return: 15.80% (bottom quartile). Point 7 1Y return: 16.92% (lower mid). 1Y return: 35.51% (top quartile). 1Y return: 5.16% (bottom quartile). 1Y return: 17.56% (upper mid). 1Y return: 8.30% (bottom quartile). Point 8 Alpha: 1.78 (bottom quartile). Alpha: 1.75 (bottom quartile). Alpha: 6.27 (top quartile). Alpha: 5.69 (upper mid). Alpha: 4.31 (lower mid). Point 9 Sharpe: 1.21 (lower mid). Sharpe: 2.27 (upper mid). Sharpe: 0.02 (bottom quartile). Sharpe: 2.51 (top quartile). Sharpe: -0.11 (bottom quartile). Point 10 Information ratio: -1.13 (bottom quartile). Information ratio: -0.15 (bottom quartile). Information ratio: 0.76 (top quartile). Information ratio: -0.09 (lower mid). Information ratio: 0.50 (upper mid). IDBI Equity Advantage Fund
HDFC Long Term Advantage Fund
Motilal Oswal Long Term Equity Fund
Baroda Pioneer ELSS 96
JM Tax Gain Fund
SIP ಗಾಗಿ ಉತ್ತಮ ವಲಯದ ನಿಧಿಗಳು
Fund NAV Net Assets (Cr) Min SIP Investment 3 MO (%) 6 MO (%) 1 YR (%) 3 YR (%) 5 YR (%) 2024 (%) DSP Natural Resources and New Energy Fund Growth ₹106.327
↑ 0.33 ₹2,401 500 -4.7 0.4 18.3 19.2 15 17.5 BOI AXA Manufacturing and Infrastructure Fund Growth ₹66.6
↑ 0.16 ₹837 1,000 6.1 15 17.9 22.3 20.3 7.8 SBI Healthcare Opportunities Fund Growth ₹513.305
↑ 1.98 ₹4,998 500 16.9 26.5 16.3 23.1 17 -3.5 DSP India T.I.G.E.R Fund Growth ₹359.538
↑ 2.49 ₹6,264 500 4.5 16.6 15.1 21.2 21.6 -2.5 UTI Transportation & Logistics Fund Growth ₹300.36
↑ 3.32 ₹3,962 500 10.7 6.5 14 18.7 20.3 19.5 Note: Returns up to 1 year are on absolute basis & more than 1 year are on CAGR basis. as on 30 Jul 26 Research Highlights & Commentary of 5 Funds showcased
Commentary DSP Natural Resources and New Energy Fund BOI AXA Manufacturing and Infrastructure Fund SBI Healthcare Opportunities Fund DSP India T.I.G.E.R Fund UTI Transportation & Logistics Fund Point 1 Bottom quartile AUM (₹2,401 Cr). Bottom quartile AUM (₹837 Cr). Upper mid AUM (₹4,998 Cr). Highest AUM (₹6,264 Cr). Lower mid AUM (₹3,962 Cr). Point 2 Established history (18+ yrs). Established history (16+ yrs). Established history (21+ yrs). Oldest track record among peers (22 yrs). Established history (22+ yrs). Point 3 Top rated. Not Rated. Rating: 2★ (bottom quartile). Rating: 4★ (upper mid). Rating: 3★ (lower mid). Point 4 Risk profile: High. Risk profile: High. Risk profile: High. Risk profile: High. Risk profile: High. Point 5 5Y return: 14.99% (bottom quartile). 5Y return: 20.28% (upper mid). 5Y return: 16.97% (bottom quartile). 5Y return: 21.62% (top quartile). 5Y return: 20.25% (lower mid). Point 6 3Y return: 19.21% (bottom quartile). 3Y return: 22.25% (upper mid). 3Y return: 23.13% (top quartile). 3Y return: 21.24% (lower mid). 3Y return: 18.66% (bottom quartile). Point 7 1Y return: 18.33% (top quartile). 1Y return: 17.88% (upper mid). 1Y return: 16.28% (lower mid). 1Y return: 15.10% (bottom quartile). 1Y return: 14.00% (bottom quartile). Point 8 Alpha: 0.00 (upper mid). Alpha: 0.00 (lower mid). Alpha: 2.23 (top quartile). Alpha: 0.00 (bottom quartile). Alpha: 0.00 (bottom quartile). Point 9 Sharpe: 0.72 (top quartile). Sharpe: 0.53 (lower mid). Sharpe: 0.59 (upper mid). Sharpe: 0.44 (bottom quartile). Sharpe: 0.12 (bottom quartile). Point 10 Information ratio: 0.00 (top quartile). Information ratio: 0.00 (upper mid). Information ratio: -0.17 (bottom quartile). Information ratio: 0.00 (lower mid). Information ratio: 0.00 (bottom quartile). DSP Natural Resources and New Energy Fund
BOI AXA Manufacturing and Infrastructure Fund
SBI Healthcare Opportunities Fund
DSP India T.I.G.E.R Fund
UTI Transportation & Logistics Fund
SIP ಗಾಗಿ ಅತ್ಯುತ್ತಮ ಕೇಂದ್ರೀಕೃತ ನಿಧಿಗಳು
Fund NAV Net Assets (Cr) Min SIP Investment 3 MO (%) 6 MO (%) 1 YR (%) 3 YR (%) 5 YR (%) 2024 (%) Sundaram Select Focus Fund Growth ₹264.968
↓ -1.18 ₹1,354 100 -5 8.5 24.5 17 17.3 ICICI Prudential Focused Equity Fund Growth ₹95.91
↑ 0.47 ₹17,012 100 6.2 1.2 5 16.7 16.2 15.4 HDFC Focused 30 Fund Growth ₹234.77
↑ 0.13 ₹27,303 300 5.5 0.3 3.1 15.9 18.4 10.9 SBI Focused Equity Fund Growth ₹393.977
↓ -0.28 ₹47,274 500 2.1 5.5 12.4 14.9 12.8 15.7 DSP Focus Fund Growth ₹55.826
↑ 0.33 ₹2,601 500 6.8 2.2 2.7 13.7 10.9 7.3 Note: Returns up to 1 year are on absolute basis & more than 1 year are on CAGR basis. as on 24 Dec 21 Research Highlights & Commentary of 5 Funds showcased
Commentary Sundaram Select Focus Fund ICICI Prudential Focused Equity Fund HDFC Focused 30 Fund SBI Focused Equity Fund DSP Focus Fund Point 1 Bottom quartile AUM (₹1,354 Cr). Lower mid AUM (₹17,012 Cr). Upper mid AUM (₹27,303 Cr). Highest AUM (₹47,274 Cr). Bottom quartile AUM (₹2,601 Cr). Point 2 Oldest track record among peers (24 yrs). Established history (17+ yrs). Established history (21+ yrs). Established history (21+ yrs). Established history (16+ yrs). Point 3 Top rated. Rating: 2★ (bottom quartile). Rating: 3★ (upper mid). Rating: 2★ (bottom quartile). Rating: 3★ (lower mid). Point 4 Risk profile: Moderately High. Risk profile: Moderately High. Risk profile: Moderately High. Risk profile: Moderately High. Risk profile: Moderately High. Point 5 5Y return: 17.29% (upper mid). 5Y return: 16.23% (lower mid). 5Y return: 18.36% (top quartile). 5Y return: 12.77% (bottom quartile). 5Y return: 10.86% (bottom quartile). Point 6 3Y return: 17.03% (top quartile). 3Y return: 16.70% (upper mid). 3Y return: 15.86% (lower mid). 3Y return: 14.94% (bottom quartile). 3Y return: 13.71% (bottom quartile). Point 7 1Y return: 24.49% (top quartile). 1Y return: 5.03% (lower mid). 1Y return: 3.05% (bottom quartile). 1Y return: 12.43% (upper mid). 1Y return: 2.75% (bottom quartile). Point 8 Alpha: -5.62 (bottom quartile). Alpha: 2.26 (upper mid). Alpha: -0.27 (bottom quartile). Alpha: 10.04 (top quartile). Alpha: 0.68 (lower mid). Point 9 Sharpe: 1.85 (top quartile). Sharpe: -0.20 (lower mid). Sharpe: -0.32 (bottom quartile). Sharpe: 0.18 (upper mid). Sharpe: -0.27 (bottom quartile). Point 10 Information ratio: -0.52 (bottom quartile). Information ratio: 1.27 (top quartile). Information ratio: 0.67 (upper mid). Information ratio: 0.49 (lower mid). Information ratio: 0.39 (bottom quartile). Sundaram Select Focus Fund
ICICI Prudential Focused Equity Fund
HDFC Focused 30 Fund
SBI Focused Equity Fund
DSP Focus Fund
SIP ಗಾಗಿ ಉತ್ತಮ ಮೌಲ್ಯ ನಿಧಿಗಳು
Fund NAV Net Assets (Cr) Min SIP Investment 3 MO (%) 6 MO (%) 1 YR (%) 3 YR (%) 5 YR (%) 2024 (%) HDFC Capital Builder Value Fund Growth ₹788.576
↑ 2.63 ₹7,583 300 6.1 4.5 6.8 15.8 14.6 8.6 Nippon India Value Fund Growth ₹226.633
↑ 1.01 ₹8,962 100 1.6 0 1.2 15.4 14.8 4.2 Aditya Birla Sun Life Pure Value Fund Growth ₹135.586
↓ -0.14 ₹6,603 1,000 5.3 7.4 10.8 15.4 14.2 2.6 ICICI Prudential Value Discovery Fund Growth ₹466.24
↑ 0.70 ₹60,198 100 1 -4 -0.1 13.5 16.1 13.8 UTI Value Opportunities Fund Growth ₹167.41
↑ 0.11 ₹9,440 500 3 -1.1 0.2 13.4 12.2 7 Note: Returns up to 1 year are on absolute basis & more than 1 year are on CAGR basis. as on 31 Jul 26 Research Highlights & Commentary of 5 Funds showcased
Commentary HDFC Capital Builder Value Fund Nippon India Value Fund Aditya Birla Sun Life Pure Value Fund ICICI Prudential Value Discovery Fund UTI Value Opportunities Fund Point 1 Bottom quartile AUM (₹7,583 Cr). Lower mid AUM (₹8,962 Cr). Bottom quartile AUM (₹6,603 Cr). Highest AUM (₹60,198 Cr). Upper mid AUM (₹9,440 Cr). Point 2 Oldest track record among peers (32 yrs). Established history (21+ yrs). Established history (18+ yrs). Established history (21+ yrs). Established history (21+ yrs). Point 3 Top rated. Not Rated. Rating: 3★ (upper mid). Rating: 2★ (lower mid). Rating: 1★ (bottom quartile). Point 4 Risk profile: Moderately High. Risk profile: Moderately High. Risk profile: Moderately High. Risk profile: Moderately High. Risk profile: Moderately High. Point 5 5Y return: 14.64% (lower mid). 5Y return: 14.85% (upper mid). 5Y return: 14.16% (bottom quartile). 5Y return: 16.07% (top quartile). 5Y return: 12.24% (bottom quartile). Point 6 3Y return: 15.84% (top quartile). 3Y return: 15.44% (upper mid). 3Y return: 15.40% (lower mid). 3Y return: 13.45% (bottom quartile). 3Y return: 13.35% (bottom quartile). Point 7 1Y return: 6.80% (upper mid). 1Y return: 1.21% (lower mid). 1Y return: 10.76% (top quartile). 1Y return: -0.15% (bottom quartile). 1Y return: 0.16% (bottom quartile). Point 8 Alpha: 3.42 (upper mid). Alpha: -0.61 (lower mid). Alpha: 6.28 (top quartile). Alpha: -3.68 (bottom quartile). Alpha: -3.38 (bottom quartile). Point 9 Sharpe: -0.13 (upper mid). Sharpe: -0.36 (lower mid). Sharpe: 0.01 (top quartile). Sharpe: -0.58 (bottom quartile). Sharpe: -0.53 (bottom quartile). Point 10 Information ratio: 1.47 (top quartile). Information ratio: 1.12 (upper mid). Information ratio: 0.70 (lower mid). Information ratio: 0.38 (bottom quartile). Information ratio: 0.27 (bottom quartile). HDFC Capital Builder Value Fund
Nippon India Value Fund
Aditya Birla Sun Life Pure Value Fund
ICICI Prudential Value Discovery Fund
UTI Value Opportunities Fund
SIP ಕ್ಯಾಲ್ಕುಲೇಟರ್
ಮ್ಯೂಚುಯಲ್ ಫಂಡ್ಗಳಲ್ಲಿ ಹೂಡಿಕೆ ಮಾಡುವಾಗ ಹೂಡಿಕೆದಾರರು ಬಳಸಬಹುದಾದ ಪರಿಣಾಮಕಾರಿ ಸಾಧನಗಳಲ್ಲಿ SIP ಕ್ಯಾಲ್ಕುಲೇಟರ್ ಒಂದಾಗಿದೆ. ಕಾರು/ಮನೆ ಖರೀದಿಸಲು ಹೂಡಿಕೆ ಮಾಡಲು, ನಿವೃತ್ತಿ ಯೋಜನೆ, ಮಗುವಿನ ಉನ್ನತ ಶಿಕ್ಷಣ ಅಥವಾ ಯಾವುದೇ ಇತರ ಆಸ್ತಿಗಾಗಿ, SIP ಕ್ಯಾಲ್ಕುಲೇಟರ್ ಅನ್ನು ಬಳಸಬಹುದು. ನಿರ್ದಿಷ್ಟ ಹಣಕಾಸಿನ ಗುರಿಯನ್ನು ತಲುಪಲು ಹೂಡಿಕೆಗೆ ಅಗತ್ಯವಿರುವ ಹೂಡಿಕೆಯ ಮೊತ್ತ ಮತ್ತು ಅವಧಿಯನ್ನು ಲೆಕ್ಕಹಾಕಲು ಇದು ಸಹಾಯ ಮಾಡುತ್ತದೆ. ಆದ್ದರಿಂದ, ಸಾಮಾನ್ಯ ಪ್ರಶ್ನೆಗಳು "ಎಷ್ಟುSIP ನಲ್ಲಿ ಹೂಡಿಕೆ ಮಾಡಿ ಅಥವಾ ಆ ಸಮಯದವರೆಗೆ ನಾನು ಹೇಗೆ ಹೂಡಿಕೆ ಮಾಡಬೇಕು", ಈ ಕ್ಯಾಲ್ಕುಲೇಟರ್ ಬಳಸಿ ಪರಿಹರಿಸುತ್ತದೆ.
SIP ಕ್ಯಾಲ್ಕುಲೇಟರ್ ಅನ್ನು ಬಳಸುವಾಗ, ಒಬ್ಬರು ಕೆಲವು ವೇರಿಯಬಲ್ಗಳನ್ನು ಭರ್ತಿ ಮಾಡಬೇಕು, ಅದರಲ್ಲಿ (ವಿವರಣೆಯನ್ನು ಕೆಳಗೆ ನೀಡಲಾಗಿದೆ)-
- ಅಪೇಕ್ಷಿತ ಹೂಡಿಕೆಯ ಅವಧಿ
- ಅಂದಾಜು ಮಾಸಿಕ SIP ಮೊತ್ತ
- ನಿರೀಕ್ಷಿಸಲಾಗಿದೆಹಣದುಬ್ಬರ ಮುಂಬರುವ ವರ್ಷಗಳಲ್ಲಿ ದರ (ವಾರ್ಷಿಕ).
- ಹೂಡಿಕೆಗಳ ಮೇಲೆ ದೀರ್ಘಾವಧಿಯ ಬೆಳವಣಿಗೆ ದರ
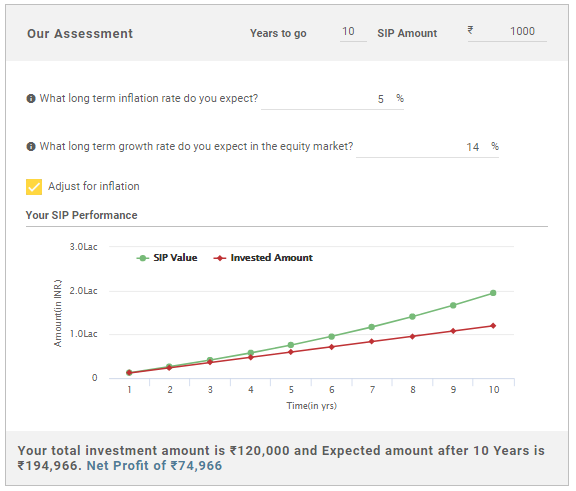
ಒಮ್ಮೆ ನೀವು ಮೇಲೆ ತಿಳಿಸಲಾದ ಎಲ್ಲಾ ಮಾಹಿತಿಯನ್ನು ಫೀಡ್ ಮಾಡಿದ ನಂತರ, ಕ್ಯಾಲ್ಕುಲೇಟರ್ ನಿಮಗೆ ನಮೂದಿಸಿದ ವರ್ಷಗಳ ನಂತರ ನೀವು ಸ್ವೀಕರಿಸುವ ಮೊತ್ತವನ್ನು (ನಿಮ್ಮ SIP ರಿಟರ್ನ್ಸ್) ನೀಡುತ್ತದೆ. ನಿಮ್ಮ ನಿವ್ವಳ ಲಾಭವನ್ನು ಹೈಲೈಟ್ ಮಾಡಲಾಗುತ್ತದೆ ಇದರಿಂದ ನಿಮ್ಮ ಗುರಿಯ ನೆರವೇರಿಕೆಗೆ ಅನುಗುಣವಾಗಿ ನೀವು ಅಂದಾಜು ಮಾಡಬಹುದು.
ಅತ್ಯುತ್ತಮ ಮ್ಯೂಚುಯಲ್ ಫಂಡ್ಗಳಲ್ಲಿ ಹೂಡಿಕೆ ಮಾಡುವುದು ಹೇಗೆ?
Fincash.com ನಲ್ಲಿ ಜೀವಮಾನಕ್ಕಾಗಿ ಉಚಿತ ಹೂಡಿಕೆ ಖಾತೆಯನ್ನು ತೆರೆಯಿರಿ.
ನಿಮ್ಮ ನೋಂದಣಿ ಮತ್ತು KYC ಪ್ರಕ್ರಿಯೆಯನ್ನು ಪೂರ್ಣಗೊಳಿಸಿ
ದಾಖಲೆಗಳನ್ನು ಅಪ್ಲೋಡ್ ಮಾಡಿ (PAN, ಆಧಾರ್, ಇತ್ಯಾದಿ).ಮತ್ತು, ನೀವು ಹೂಡಿಕೆ ಮಾಡಲು ಸಿದ್ಧರಿದ್ದೀರಿ!
ಇಲ್ಲಿ ಒದಗಿಸಲಾದ ಮಾಹಿತಿಯು ನಿಖರವಾಗಿದೆ ಎಂದು ಖಚಿತಪಡಿಸಿಕೊಳ್ಳಲು ಎಲ್ಲಾ ಪ್ರಯತ್ನಗಳನ್ನು ಮಾಡಲಾಗಿದೆ. ಆದಾಗ್ಯೂ, ಡೇಟಾದ ನಿಖರತೆಯ ಬಗ್ಗೆ ಯಾವುದೇ ಗ್ಯಾರಂಟಿಗಳನ್ನು ನೀಡಲಾಗುವುದಿಲ್ಲ. ಯಾವುದೇ ಹೂಡಿಕೆ ಮಾಡುವ ಮೊದಲು ದಯವಿಟ್ಟು ಸ್ಕೀಮ್ ಮಾಹಿತಿ ದಾಖಲೆಯೊಂದಿಗೆ ಪರಿಶೀಲಿಸಿ.


AMFI Registration No. 112358 | CIN: U74999MH2016PTC282153
Shepard Technologies Pvt. Ltd. (with ARN code 112358) makes no warranties or representations, express or implied, on products offered through the platform. It accepts no liability for any damages or losses, however caused, in connection with the use of, or on the reliance of its product or related services. Terms and conditions of the website are applicable.
©2026 Shepard Technologies Private Limited. All Rights Reserved