
 +91-22-48913909
MFOnline: നിക്ഷേപം എളുപ്പമാക്കി
MFOnline എന്ന പദം നിങ്ങൾ കേട്ടിട്ടുണ്ടോ? ശരി, ഇത് ഇതിനകം അറിയാവുന്നവർക്കും അറിയാത്തവർക്കും, ഈ ലേഖനം MFOnline എന്ന ആശയം ലളിതമാക്കുകയും വിശദീകരിക്കുകയും ചെയ്യും. MFOnline അല്ലെങ്കിൽ മ്യൂച്വൽ ഫണ്ട് ഓൺലൈൻ മാർഗങ്ങൾനിക്ഷേപിക്കുന്നു ഇൻമ്യൂച്വൽ ഫണ്ടുകൾ കടലാസ് രഹിത മാർഗങ്ങളിലൂടെ. മ്യൂച്വൽ ഫണ്ട് കമ്പനിയുടെ വെബ്സൈറ്റോ മറ്റ് വെബ് പോർട്ടലുകളോ സന്ദർശിച്ച് മ്യൂച്വൽ ഫണ്ട് സ്കീമുകളിൽ നിക്ഷേപിക്കാൻ വ്യക്തികൾക്ക് MFOnline തിരഞ്ഞെടുക്കാം. ഒരു വ്യക്തിക്ക് ഏത് സ്ഥലത്തും എപ്പോൾ വേണമെങ്കിലും മ്യൂച്വൽ ഫണ്ടുകളിൽ നിക്ഷേപിക്കാനും വ്യാപാരം നടത്താനും കഴിയുന്ന തരത്തിൽ സാങ്കേതിക രംഗത്തെ പുരോഗതി വളരെ വലുതാണ്. അതിനാൽ, മ്യൂച്വൽ ഫണ്ടുകൾ, ഓൺലൈൻ നിക്ഷേപമുള്ള ഫണ്ട് ഹൗസുകൾ തുടങ്ങിയ MFOnline-ന്റെ വിവിധ വശങ്ങൾ നമുക്ക് മനസ്സിലാക്കാം.സൗകര്യം, ഉദാഹരണത്തിന്, യുടിഐ മ്യൂച്വൽ ഫണ്ടുകൾ, ഫസ്റ്റ് ടൈമറുകൾക്കായി മ്യൂച്വൽ ഫണ്ടുകളിൽ ഓൺലൈനായി നിക്ഷേപിക്കുന്ന പ്രക്രിയ, ഓൺലൈൻ മ്യൂച്വൽ ഫണ്ട് നിക്ഷേപ രീതികൾ, ഓൺലൈൻഎസ്.ഐ.പി.
Talk to our investment specialist
MFOnline: ആദ്യ ടൈമറുകൾക്കുള്ള ഓൺലൈൻ നിക്ഷേപങ്ങൾ
സാങ്കേതികവിദ്യയുടെ പുരോഗതിയോടെ, MFOnline പ്രക്രിയ എളുപ്പവും ലളിതവുമാണ്. എന്നിരുന്നാലും, നിക്ഷേപം ആരംഭിക്കുന്നതിന് മുമ്പ് നിങ്ങളുടെ ഉപഭോക്താവിനെ അറിയുക (KYC) ആവശ്യകതകളുടെ ഒരു അധിക നടപടിക്രമം ഫസ്റ്റ് ടൈമർമാർ പൂർത്തിയാക്കേണ്ടതുണ്ട്. യുടെ സഹായത്തോടെ ഇത് ചെയ്യാംഇ.കെ.വൈ.സി. eKYC എന്നത് KYC പ്രക്രിയ പൂർത്തിയാക്കുന്നതിനുള്ള ഒരു പേപ്പർ രഹിത സാങ്കേതികതയാണ്. eKYC പ്രവർത്തനം നടത്തുന്ന സ്ഥാപനങ്ങളിലൊന്ന് കമ്പ്യൂട്ടർ ഏജ് മാനേജ്മെന്റ് സർവീസസ് പ്രൈവറ്റ് ലിമിറ്റഡ് എന്നറിയപ്പെടുന്നു. ലിമിറ്റഡ് സ്നേഹപൂർവ്വം അറിയപ്പെടുന്നുക്യാമറകൾ. യുഐഡി (ആധാർ) നമ്പർ നൽകി, ലഭിച്ച ഒടിപി നൽകി ഇകെവൈസി പ്രക്രിയ പൂർത്തിയാക്കാം.
MFOnline: മ്യൂച്വൽ ഫണ്ടുകൾ ഓൺലൈനായി എങ്ങനെ വാങ്ങാം
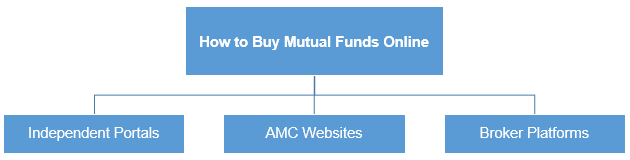
MFOnline ഓൺലൈൻ വഴി മ്യൂച്വൽ ഫണ്ടുകളിലെ നിക്ഷേപം മൂന്ന് തരത്തിൽ നടത്താം. അവർ:
സ്വതന്ത്ര പോർട്ടലുകൾ
മ്യൂച്വൽ ഫണ്ട് ഡിസ്ട്രിബ്യൂട്ടേഴ്സിന്റെ സ്വതന്ത്ര പോർട്ടലുകൾ ആളുകൾക്ക് കഴിയുന്ന ചാനലുകളിലൊന്നാണ്മ്യൂച്വൽ ഫണ്ടുകളിൽ നിക്ഷേപിക്കുക. ഈ പോർട്ടലുകളുടെ ഹൈലൈറ്റ് പോയിന്റുകളിലൊന്ന് അവർ വ്യക്തികളിൽ നിന്ന് യാതൊരു ഇടപാട് ഫീസും ഈടാക്കുന്നില്ല എന്നതാണ്. കൂടാതെ, വിവിധ മ്യൂച്വൽ ഫണ്ട് സ്കീമുകൾക്കായി അവർ ആഴത്തിലുള്ള വിശകലനവും നൽകുന്നു. ഒരു വെബ്സൈറ്റ് സന്ദർശിച്ചുകൊണ്ട് വ്യക്തികൾക്ക് വിവിധ മ്യൂച്വൽ ഫണ്ട് സ്കീമുകളിൽ നിക്ഷേപിക്കാൻ കഴിയുന്ന അഗ്രഗേറ്ററുകൾ പോലെ സ്വതന്ത്ര പോർട്ടലുകളും പ്രവർത്തിക്കുന്നു. സ്വതന്ത്ര പോർട്ടലുകൾ വഴി മ്യൂച്വൽ ഫണ്ടുകൾ വാങ്ങുന്നതിന്റെ ഗുണങ്ങളും പരിമിതികളും ഇവയാണ്:
പ്രയോജനങ്ങൾ:
- ഇടപാട് നിരക്കുകളൊന്നുമില്ല
- വിവിധ മ്യൂച്വൽ ഫണ്ട് സ്കീമുകളുടെ ആഴത്തിലുള്ള വിശകലനം ഏത് സ്കീമിലാണ് നിക്ഷേപിക്കേണ്ടതെന്ന് മനസ്സിലാക്കാൻ സഹായിക്കുന്നു
ദോഷങ്ങൾ:
- ഒരു വ്യക്തിയുടേതാണെങ്കിൽബാങ്ക് പോർട്ടലുമായി ബന്ധമില്ല, നെറ്റ് ബാങ്കിംഗിലേക്കുള്ള പ്രവേശനം ലഭ്യമായേക്കില്ല.
AMC വെബ്സൈറ്റുകൾ
വ്യക്തികൾക്ക് മ്യൂച്വൽ ഫണ്ട് കമ്പനിയിൽ നിന്നോ AMC യുടെ വെബ്സൈറ്റിൽ നിന്നോ MFOnline മോഡിലൂടെ ഒരു ബട്ടണിൽ ക്ലിക്ക് ചെയ്യുന്നതിലൂടെ നേരിട്ട് മ്യൂച്വൽ ഫണ്ടുകൾ വാങ്ങാം. ഫണ്ട് ഹൗസിൽ നിന്ന് തന്നെ വ്യക്തികൾക്ക് മ്യൂച്വൽ ഫണ്ട് സ്കീമുകൾ വാങ്ങാൻ കഴിയുന്നതിനാൽ ഇത് എളുപ്പമുള്ള ഓപ്ഷനായി കണക്കാക്കപ്പെടുന്നു. ഫണ്ട് ഹൗസുകളിൽ നിന്ന് നേരിട്ട് മ്യൂച്വൽ ഫണ്ട് സ്കീമുകൾ വാങ്ങുന്നതിന്റെ ചില ഗുണങ്ങളും പരിമിതികളും ഇവയാണ്:
പ്രയോജനങ്ങൾ
- ലളിതമായ രജിസ്ട്രേഷനും നിക്ഷേപ പ്രക്രിയയും
- ഫണ്ട് ഹൗസിനോ ഏതെങ്കിലും ഏജന്റിനോ ഇടപാട് ഫീസ് നൽകേണ്ടതില്ല
ദോഷങ്ങൾ
- വിവിധ ഫണ്ട് ഹൗസുകൾ നടത്തുന്ന വ്യത്യസ്ത മ്യൂച്വൽ ഫണ്ട് സ്കീമുകളിൽ നിക്ഷേപിക്കാൻ പദ്ധതിയിടുകയാണെങ്കിൽ, ഓരോ മ്യൂച്വൽ ഫണ്ടിന്റെയും രജിസ്ട്രേഷൻ നടപടിക്രമങ്ങൾ വ്യക്തികൾ പൂർത്തിയാക്കേണ്ടതുണ്ട്.
- വ്യക്തികൾ എല്ലാ നടപടിക്രമങ്ങളും പൂർത്തിയാക്കേണ്ടതുണ്ട്
ബ്രോക്കർ പ്ലാറ്റ്ഫോമുകൾ
മ്യൂച്വൽ ഫണ്ടുകളിൽ ഓൺലൈനായി നിക്ഷേപിക്കുന്നതിന് ഒരു വ്യക്തിക്ക് തിരഞ്ഞെടുക്കാവുന്ന മറ്റൊരു മാധ്യമമാണ് ബ്രോക്കർ പ്ലാറ്റ്ഫോമുകൾ. എ ഉള്ള വ്യക്തികൾഡീമാറ്റ് അക്കൗണ്ട് മ്യൂച്വൽ ഫണ്ടുകളിൽ നിക്ഷേപിക്കാൻ സ്റ്റോക്കുകളിലെ ഓൺലൈൻ ട്രേഡിംഗിന് അതേ ഡീമാറ്റ് അക്കൗണ്ട് ഉപയോഗിക്കാം. ഈ ബ്രോക്കർ അക്കൗണ്ടുകളിൽ ഭൂരിഭാഗവും ബിഎസ്ഇ അല്ലെങ്കിൽ എൻഎസ്ഇയുടെ മ്യൂച്വൽ ഫണ്ട് എക്സ്ചേഞ്ച് പ്ലാറ്റ്ഫോമുമായി ബന്ധിപ്പിച്ചിരിക്കുന്നു. വ്യക്തികൾ ബ്രോക്കർ ടെർമിനലിൽ നിന്ന് അവരുടെ അക്കൗണ്ടുകളിലേക്ക് ലോഗിൻ ചെയ്യണം, അവർ നിക്ഷേപിക്കാൻ ഇഷ്ടപ്പെടുന്ന സ്കീം തിരഞ്ഞെടുത്ത് പണം നിക്ഷേപിക്കേണ്ടതുണ്ട്. യൂണിറ്റുകൾ അവരുടെ ഡീമാറ്റ് അക്കൗണ്ടിലേക്ക് ക്രെഡിറ്റ് ചെയ്യപ്പെടുന്നു. ബ്രോക്കർ പ്ലാറ്റ്ഫോമുകളിലൂടെ മ്യൂച്വൽ ഫണ്ടുകൾ വാങ്ങുന്നതിന്റെ ഗുണങ്ങളും ദോഷങ്ങളും ഇവയാണ്:
പ്രയോജനങ്ങൾ
- ബ്രോക്കറുമായി ഒരു അക്കൗണ്ട് തുറക്കുന്നതിലൂടെ വ്യക്തികൾക്ക് സ്റ്റോക്കുകൾ പോലെയുള്ള നിരവധി സാമ്പത്തിക ഉപകരണങ്ങളിൽ നിക്ഷേപിക്കാൻ കഴിയും,ബോണ്ടുകൾ, ഓഹരികൾ, മ്യൂച്വൽ ഫണ്ട് സ്കീമുകൾക്കൊപ്പം
- എല്ലാ നിക്ഷേപങ്ങളും ഒരിടത്ത് ആയതിനാൽ തടസ്സമില്ല
ദോഷങ്ങൾ
- ഉയർന്ന ബ്രോക്കറേജ് ചാർജുകൾ
- ഉയർന്ന ബ്രോക്കറേജ് കാരണം വ്യക്തികൾക്ക് കുറഞ്ഞ ലാഭം ലഭിക്കുമെന്നതിനാൽ ഹ്രസ്വകാല നിക്ഷേപകർക്ക് സൗകര്യപ്രദമല്ല
ചുവടെ നൽകിയിരിക്കുന്ന ചിത്രം വാങ്ങുന്നതിന്റെ മൂന്ന് ചാനലുകൾ കാണിക്കുന്നുമ്യൂച്വൽ ഫണ്ടുകൾ ഓൺലൈനിൽ.
ഓൺലൈൻ എസ്.ഐ.പി
വ്യവസ്ഥാപിതംനിക്ഷേപ പദ്ധതി അല്ലെങ്കിൽ SIP എന്നാൽ വ്യക്തികൾ മ്യൂച്വൽ ഫണ്ട് സ്കീമുകളിൽ കൃത്യമായ ഇടവേളകളിൽ ചെറിയ തുക നിക്ഷേപിക്കുന്ന സാഹചര്യം എന്നാണ് അർത്ഥമാക്കുന്നത്. മ്യൂച്വൽ ഫണ്ടുകളിലെ മൊത്തത്തിലുള്ള നിക്ഷേപ രീതിക്ക് പകരം നിക്ഷേപകർക്ക് SIP മോഡ് തിരഞ്ഞെടുക്കാം. തുക നിക്ഷേപിക്കുന്നതിന് കൃത്യമായ ഇടവേളകളിൽ ഫണ്ട് ഹൗസ് ഓഫീസ് സന്ദർശിക്കേണ്ടതില്ലാത്തിടത്ത് വ്യക്തികൾക്ക് SIP-യുടെ MFOnline മോഡ് തിരഞ്ഞെടുക്കാം. ഇവിടെ, ഒരു ബട്ടണിൽ ക്ലിക്ക് ചെയ്താൽ തുക നിക്ഷേപിക്കാം. അതിനാൽ, ഈ രീതി വ്യക്തികൾക്ക് മ്യൂച്വൽ ഫണ്ടുകളിൽ നിക്ഷേപിക്കാൻ എളുപ്പമാണ്.
മ്യൂച്വൽ ഫണ്ടുകൾ ഓൺലൈനിൽ മനസ്സിലാക്കുക
സാമ്പത്തിക സെക്യൂരിറ്റികളിൽ നിക്ഷേപിക്കുകയും വ്യാപാരം നടത്തുകയും ചെയ്യുക എന്ന പൊതു ലക്ഷ്യമുള്ള വിവിധ വ്യക്തികളിൽ നിന്ന് പണം ശേഖരിക്കുന്ന ഒരു നിക്ഷേപ വാഹനത്തെയാണ് മ്യൂച്വൽ ഫണ്ട് സൂചിപ്പിക്കുന്നത്. തുടക്കത്തിൽ, വ്യക്തികൾ അതത് ഫണ്ട് ഹൗസുകളുടെ ഓഫീസുകൾ സന്ദർശിച്ച് മ്യൂച്വൽ ഫണ്ടുകളിൽ നിക്ഷേപിക്കാറുണ്ടായിരുന്നു. എന്നിരുന്നാലും, കാലക്രമേണ, സാങ്കേതിക മുന്നേറ്റങ്ങൾ മ്യൂച്വൽ ഫണ്ട് വ്യവസായത്തിൽ അതിന്റെ മുദ്ര പതിപ്പിച്ചു. ഇന്ന്, മ്യൂച്വൽ ഫണ്ട് നിക്ഷേപ പ്രക്രിയ വളരെ ലളിതമാക്കിയിരിക്കുന്നു, മ്യൂച്വൽ ഫണ്ടുകളിൽ നിക്ഷേപിക്കുന്നതിനായി വ്യക്തികൾക്ക് ലാപ്ടോപ്പുകൾ, സ്മാർട്ട്ഫോണുകൾ, കമ്പ്യൂട്ടറുകൾ തുടങ്ങിയ ഉപകരണങ്ങൾ ഉപയോഗിച്ച് ഒരു ബട്ടണിൽ ക്ലിക്ക് ചെയ്യുന്നതിലൂടെ വിവിധ ഫണ്ടുകളിൽ നിക്ഷേപിക്കാനും വ്യാപാരം നടത്താനും കഴിയും.
ഓൺലൈൻ നിക്ഷേപ സൗകര്യമുള്ള ഫണ്ട് ഹൗസുകൾ
നിലവിൽ, മിക്കവാറും എല്ലാ ഫണ്ട് ഹൗസുകളും അല്ലെങ്കിൽഅസറ്റ് മാനേജ്മെന്റ് കമ്പനികൾ (AMCs) MFOnline സൗകര്യം നൽകുന്നു. ഈ മ്യൂച്വൽ ഫണ്ട് കമ്പനികളിൽ ചിലത് യുടിഐ മ്യൂച്വൽ ഫണ്ടുകൾ, റിലയൻസ് മ്യൂച്വൽ ഫണ്ടുകൾ, ടാറ്റ മ്യൂച്വൽ ഫണ്ടുകൾ തുടങ്ങിയവ ഉൾപ്പെടുന്നു. ഈ ഫണ്ട് ഹൗസുകളുടെ വിശദമായ വിവരണവും അവ വാഗ്ദാനം ചെയ്യുന്ന മികച്ച മ്യൂച്വൽ ഫണ്ട് സ്കീമുകളും ഇനിപ്പറയുന്നതാണ്:
യുടിഐ മ്യൂച്വൽ ഫണ്ട്
യുടിഐ എന്ന ചുരുക്കപ്പേരുള്ള യൂണിറ്റ് ട്രസ്റ്റ് ഓഫ് ഇന്ത്യ, ഇന്ത്യയിലെ ആദ്യത്തെ മ്യൂച്വൽ ഫണ്ട് കമ്പനിയാണ്. 1963-ലെ യുടിഐ ആക്ട് പ്രകാരം 1963-ൽ രൂപീകരിച്ചത്.യുടിഐ മ്യൂച്വൽ ഫണ്ട് നിയമം നിർത്തലാക്കിയതിന് ശേഷം 2003-ൽ രൂപീകരിച്ചു. വ്യക്തികൾക്ക് ഓൺലൈൻ മോഡ് വഴി മ്യൂച്വൽ ഫണ്ടുകളിൽ നിക്ഷേപിക്കാൻ കഴിയുന്ന ഓൺലൈൻ ട്രേഡിംഗ് സൗകര്യം യുടിഐ മ്യൂച്വൽ ഫണ്ടുകൾ വാഗ്ദാനം ചെയ്യുന്നു. അവർക്ക് മ്യൂച്വൽ ഫണ്ട് സ്കീമുകളുടെ യൂണിറ്റുകൾ വാങ്ങാനും വിൽക്കാനും നിക്ഷേപിക്കാനും കഴിയും, അവരുടെ ബാലൻസ് പരിശോധിക്കാം, അവരുടെ മ്യൂച്വൽ ഫണ്ട് സ്കീമുകളുടെ പ്രകടനം പരിശോധിക്കാം, എല്ലാം ഒരു മൗസ് ക്ലിക്കിലൂടെ.
മികച്ച UTI മ്യൂച്വൽ ഫണ്ട് സ്കീമുകൾ 2022
Fund NAV Net Assets (Cr) 3 MO (%) 6 MO (%) 1 YR (%) 3 YR (%) 5 YR (%) 2025 (%) UTI Banking & PSU Debt Fund Growth ₹23.6447
↑ 0.01 ₹1,486 1.6 3.2 5.7 7.3 7.5 7.8 UTI Dynamic Bond Fund Growth ₹32.388
↑ 0.03 ₹405 0.2 1.8 3.6 6.5 6.8 6 UTI Money Market Fund Growth ₹3,346.76
↑ 1.22 ₹19,468 1.7 3.4 6.5 7.3 6.7 7.5 UTI Ultra Short Term Fund Growth ₹4,567.92
↑ 1.30 ₹3,536 1.6 3.2 6 6.7 6.1 6.6 UTI Treasury Advantage Fund Growth ₹3,833.62
↑ 1.10 ₹2,397 1.4 3.1 6 7.2 6.5 7.5 Note: Returns up to 1 year are on absolute basis & more than 1 year are on CAGR basis. as on 9 Oct 26 Research Highlights & Commentary of 5 Funds showcased
Commentary UTI Banking & PSU Debt Fund UTI Dynamic Bond Fund UTI Money Market Fund UTI Ultra Short Term Fund UTI Treasury Advantage Fund Point 1 Bottom quartile AUM (₹1,486 Cr). Bottom quartile AUM (₹405 Cr). Highest AUM (₹19,468 Cr). Upper mid AUM (₹3,536 Cr). Lower mid AUM (₹2,397 Cr). Point 2 Established history (12+ yrs). Established history (16+ yrs). Established history (17+ yrs). Oldest track record among peers (23 yrs). Established history (19+ yrs). Point 3 Top rated. Rating: 5★ (upper mid). Rating: 4★ (lower mid). Rating: 4★ (bottom quartile). Rating: 4★ (bottom quartile). Point 4 Risk profile: Moderate. Risk profile: Moderate. Risk profile: Low. Risk profile: Moderately Low. Risk profile: Moderately Low. Point 5 1Y return: 5.72% (bottom quartile). 1Y return: 3.63% (bottom quartile). 1Y return: 6.45% (top quartile). 1Y return: 5.99% (upper mid). 1Y return: 5.97% (lower mid). Point 6 1M return: 0.40% (lower mid). 1M return: -0.21% (bottom quartile). 1M return: 0.45% (top quartile). 1M return: 0.40% (upper mid). 1M return: 0.27% (bottom quartile). Point 7 Sharpe: 0.31 (bottom quartile). Sharpe: -0.17 (bottom quartile). Sharpe: 0.97 (top quartile). Sharpe: 0.61 (lower mid). Sharpe: 0.63 (upper mid). Point 8 Information ratio: 0.00 (top quartile). Information ratio: 0.00 (upper mid). Information ratio: 0.00 (lower mid). Information ratio: 0.00 (bottom quartile). Information ratio: 0.00 (bottom quartile). Point 9 Yield to maturity (debt): 6.98% (bottom quartile). Yield to maturity (debt): 7.36% (top quartile). Yield to maturity (debt): 6.92% (bottom quartile). Yield to maturity (debt): 7.13% (lower mid). Yield to maturity (debt): 7.25% (upper mid). Point 10 Modified duration: 0.59 yrs (lower mid). Modified duration: 1.89 yrs (bottom quartile). Modified duration: 0.46 yrs (upper mid). Modified duration: 0.44 yrs (top quartile). Modified duration: 0.74 yrs (bottom quartile). UTI Banking & PSU Debt Fund
UTI Dynamic Bond Fund
UTI Money Market Fund
UTI Ultra Short Term Fund
UTI Treasury Advantage Fund
റിലയൻസ് മ്യൂച്വൽ ഫണ്ട്
റിലയൻസ് മ്യൂച്വൽ ഫണ്ട് ഇന്ത്യയിൽ അതിവേഗം വളരുന്ന മ്യൂച്വൽ ഫണ്ട് കമ്പനികളിൽ ഒന്നാണ്. ജാപ്പനീസ് കമ്പനിയായ നിപ്പോണിന്റെ സംയുക്ത സംരംഭമാണിത്ലൈഫ് ഇൻഷുറൻസ് ഇന്ത്യൻ കമ്പനി റിലയൻസുംമൂലധനം. മ്യൂച്വൽ ഫണ്ടുകളിൽ പേപ്പർ രഹിത നിക്ഷേപം പ്രോത്സാഹിപ്പിക്കുന്നതിന് വ്യക്തികൾക്ക് MFOnline എന്ന സൗകര്യവും ഈ കമ്പനി നൽകുന്നു. 1995-ലാണ് ഈ ഫണ്ട് ഹൗസ് സ്ഥാപിതമായത്.
മികച്ച റിലയൻസ് മ്യൂച്വൽ ഫണ്ട് സ്കീമുകൾ 2022
No Funds available.
ടാറ്റ മ്യൂച്വൽ ഫണ്ട്
ടാറ്റ മ്യൂച്വൽ ഫണ്ട് MFOnline നിക്ഷേപ രീതിയെ പ്രോത്സാഹിപ്പിക്കുന്ന ഒരു ഫണ്ടാണ്. ടാറ്റ മ്യൂച്വൽ ഫണ്ടുകൾ നിക്ഷേപിക്കാൻ തിരഞ്ഞെടുക്കുന്ന വ്യക്തികൾക്ക് കമ്പനിയുടെ വെബ്സൈറ്റ്, അല്ലെങ്കിൽ ബ്രോക്കർമാർ, അല്ലെങ്കിൽ സ്വതന്ത്ര പോർട്ടലുകൾ എന്നിവയിലൂടെ നിക്ഷേപിക്കാം. 1995-ൽ സ്ഥാപിതമായ ഈ മ്യൂച്വൽ ഫണ്ടിന്റെ പ്രധാന സ്പോൺസർമാർ ടാറ്റ സൺസ് ലിമിറ്റഡും ടാറ്റ ഇൻവെസ്റ്റ്മെന്റ് കോർപ്പറേഷൻ ലിമിറ്റഡുമാണ്.
മികച്ച ടാറ്റ മ്യൂച്വൽ ഫണ്ട് സ്കീമുകൾ 2022
Fund NAV Net Assets (Cr) 3 MO (%) 6 MO (%) 1 YR (%) 3 YR (%) 5 YR (%) 2025 (%) Tata Retirement Savings Fund-Moderate Growth ₹64.7288
↑ 0.50 ₹2,251 -3.2 5.9 0.6 9.9 7.7 1 Tata Retirement Savings Fund - Progressive Growth ₹65.2067
↑ 0.59 ₹2,255 -3.7 6.6 0.4 10.3 7.6 -1.2 Tata India Tax Savings Fund Growth ₹44.3058
↑ 0.41 ₹4,747 -4 2 -0.4 10.3 9.5 4.9 Tata Equity PE Fund Growth ₹337.178
↑ 5.12 ₹8,656 -2.7 -0.4 -4.1 11.3 10.9 3.7 Tata Liquid Fund Growth ₹4,444.99
↑ 1.23 ₹32,370 1.6 3.2 6.4 6.8 6.3 6.5 Note: Returns up to 1 year are on absolute basis & more than 1 year are on CAGR basis. as on 9 Oct 26 Research Highlights & Commentary of 5 Funds showcased
Commentary Tata Retirement Savings Fund-Moderate Tata Retirement Savings Fund - Progressive Tata India Tax Savings Fund Tata Equity PE Fund Tata Liquid Fund Point 1 Bottom quartile AUM (₹2,251 Cr). Bottom quartile AUM (₹2,255 Cr). Lower mid AUM (₹4,747 Cr). Upper mid AUM (₹8,656 Cr). Highest AUM (₹32,370 Cr). Point 2 Established history (14+ yrs). Established history (14+ yrs). Established history (12+ yrs). Oldest track record among peers (22 yrs). Established history (22+ yrs). Point 3 Top rated. Rating: 5★ (upper mid). Rating: 5★ (lower mid). Rating: 5★ (bottom quartile). Rating: 4★ (bottom quartile). Point 4 Risk profile: Moderately High. Risk profile: Moderately High. Risk profile: Moderately High. Risk profile: Moderately High. Risk profile: Low. Point 5 5Y return: 7.70% (lower mid). 5Y return: 7.62% (bottom quartile). 5Y return: 9.48% (upper mid). 5Y return: 10.92% (top quartile). 1Y return: 6.40% (top quartile). Point 6 3Y return: 9.86% (bottom quartile). 3Y return: 10.34% (upper mid). 3Y return: 10.33% (lower mid). 3Y return: 11.28% (top quartile). 1M return: 0.47% (top quartile). Point 7 1Y return: 0.61% (upper mid). 1Y return: 0.43% (lower mid). 1Y return: -0.39% (bottom quartile). 1Y return: -4.11% (bottom quartile). Sharpe: 2.98 (top quartile). Point 8 1M return: -5.38% (lower mid). 1M return: -5.99% (bottom quartile). Alpha: 6.01 (top quartile). Alpha: 1.44 (lower mid). Information ratio: 0.00 (bottom quartile). Point 9 Alpha: 0.00 (bottom quartile). Alpha: 5.12 (upper mid). Sharpe: 0.40 (upper mid). Sharpe: 0.16 (bottom quartile). Yield to maturity (debt): 6.41% (top quartile). Point 10 Sharpe: 0.33 (bottom quartile). Sharpe: 0.34 (lower mid). Information ratio: 0.18 (upper mid). Information ratio: 0.31 (top quartile). Modified duration: 0.12 yrs (bottom quartile). Tata Retirement Savings Fund-Moderate
Tata Retirement Savings Fund - Progressive
Tata India Tax Savings Fund
Tata Equity PE Fund
Tata Liquid Fund
ഐസിഐസിഐ മ്യൂച്വൽ ഫണ്ട്
icici മ്യൂച്വൽ ഫണ്ട് ഇന്ത്യയിൽ സ്ഥാപിതമായതും അറിയപ്പെടുന്നതുമായ ഫണ്ട് ഹൗസുകളിൽ ഒന്നാണ്. എന്നിവർ തമ്മിലുള്ള സംയുക്ത സംരംഭമാണ് കമ്പനിഐസിഐസിഐ ബാങ്ക് ലിമിറ്റഡ് ആൻഡ് പ്രുഡൻഷ്യൽ PLC. ഐസിഐസിഐ മ്യൂച്വൽ ഫണ്ട് ഓൺലൈൻ നിക്ഷേപ രീതിയും നൽകുന്നു. ഓൺലൈൻ മോഡ് വഴി, ആളുകൾക്ക് ഐസിഐസിഐയുടെ വിവിധ സ്കീമുകളിൽ ഫണ്ട് ഹൗസിന്റെ വെബ്സൈറ്റ് വഴിയോ മറ്റെന്തെങ്കിലും വഴിയോ നിക്ഷേപിക്കാംവിതരണക്കാരൻയുടെ പോർട്ടൽ.
മികച്ച ഐസിഐസിഐ മ്യൂച്വൽ ഫണ്ട് സ്കീമുകൾ 2022
Fund NAV Net Assets (Cr) 3 MO (%) 6 MO (%) 1 YR (%) 3 YR (%) 5 YR (%) 2025 (%) ICICI Prudential Long Term Plan Growth ₹38.9417
↑ 0.00 ₹13,163 -0.4 2.5 3.7 6.8 6.2 7.2 ICICI Prudential MIP 25 Growth ₹78.063
↑ 0.18 ₹3,329 -1.3 1.4 1.3 7.8 7.2 7.9 ICICI Prudential Nifty Next 50 Index Fund Growth ₹59.9039
↑ 0.48 ₹10,117 -4.5 2.9 -0.5 15.3 9.5 2.1 ICICI Prudential Banking and Financial Services Fund Growth ₹126.81
↑ 1.38 ₹11,229 -4 0.4 -5.5 8.9 8.1 15.9 ICICI Prudential US Bluechip Equity Fund Growth ₹79.71
↑ 0.84 ₹4,071 6.3 12.7 16 16.9 11.8 15.8 Note: Returns up to 1 year are on absolute basis & more than 1 year are on CAGR basis. as on 9 Oct 26 Research Highlights & Commentary of 5 Funds showcased
Commentary ICICI Prudential Long Term Plan ICICI Prudential MIP 25 ICICI Prudential Nifty Next 50 Index Fund ICICI Prudential Banking and Financial Services Fund ICICI Prudential US Bluechip Equity Fund Point 1 Highest AUM (₹13,163 Cr). Bottom quartile AUM (₹3,329 Cr). Lower mid AUM (₹10,117 Cr). Upper mid AUM (₹11,229 Cr). Bottom quartile AUM (₹4,071 Cr). Point 2 Established history (16+ yrs). Oldest track record among peers (22 yrs). Established history (16+ yrs). Established history (18+ yrs). Established history (14+ yrs). Point 3 Top rated. Rating: 5★ (upper mid). Rating: 5★ (lower mid). Rating: 5★ (bottom quartile). Rating: 4★ (bottom quartile). Point 4 Risk profile: Moderate. Risk profile: Moderately High. Risk profile: Moderately High. Risk profile: High. Risk profile: High. Point 5 1Y return: 3.66% (upper mid). 5Y return: 7.24% (bottom quartile). 5Y return: 9.55% (upper mid). 5Y return: 8.06% (lower mid). 5Y return: 11.84% (top quartile). Point 6 1M return: -0.63% (upper mid). 3Y return: 7.84% (bottom quartile). 3Y return: 15.32% (upper mid). 3Y return: 8.88% (lower mid). 3Y return: 16.85% (top quartile). Point 7 Sharpe: 0.05 (lower mid). 1Y return: 1.34% (lower mid). 1Y return: -0.48% (bottom quartile). 1Y return: -5.55% (bottom quartile). 1Y return: 16.04% (top quartile). Point 8 Information ratio: 0.00 (top quartile). 1M return: -0.88% (lower mid). 1M return: -6.51% (bottom quartile). Alpha: -3.59 (bottom quartile). Alpha: 7.29 (top quartile). Point 9 Yield to maturity (debt): 8.03% (upper mid). Alpha: 0.00 (lower mid). Alpha: -0.90 (bottom quartile). Sharpe: -0.30 (bottom quartile). Sharpe: 1.35 (top quartile). Point 10 Modified duration: 5.50 yrs (bottom quartile). Sharpe: -0.35 (bottom quartile). Sharpe: 0.38 (upper mid). Information ratio: -0.32 (lower mid). Information ratio: -1.12 (bottom quartile). ICICI Prudential Long Term Plan
ICICI Prudential MIP 25
ICICI Prudential Nifty Next 50 Index Fund
ICICI Prudential Banking and Financial Services Fund
ICICI Prudential US Bluechip Equity Fund
എസ്ബിഐ മ്യൂച്വൽ ഫണ്ട്
എസ്ബിഐ മ്യൂച്വൽ ഫണ്ട് ഇന്ത്യയിലെ ഏറ്റവും പഴക്കമേറിയതും പ്രശസ്തവുമായ ബാങ്കായ സ്റ്റേറ്റ് ബാങ്ക് ഓഫ് ഇന്ത്യ (എസ്ബിഐ) സ്ഥാപിച്ചതാണ്. ഓൺലൈൻ നിക്ഷേപ രീതിയിലൂടെ ആളുകൾക്ക് അവരുടെ സൗകര്യത്തിനനുസരിച്ച് നിക്ഷേപിക്കാൻ കഴിയുന്ന നിരവധി സ്കീമുകൾ എസ്ബിഐ വാഗ്ദാനം ചെയ്യുന്നു. ഓൺലൈൻ മോഡ് ഉപയോഗിച്ച്, ആളുകൾക്ക് അവരുടെ സൗകര്യത്തിനനുസരിച്ച് എപ്പോൾ വേണമെങ്കിലും എവിടെനിന്നും നിക്ഷേപിക്കാം. ഓൺലൈൻ മോഡിൽ, നിക്ഷേപം നടത്താൻ ആളുകൾക്ക് ഒന്നുകിൽ മ്യൂച്വൽ ഫണ്ട് വിതരണക്കാരുടെ പോർട്ടലോ ഫണ്ട് ഹൗസിന്റെ വെബ്സൈറ്റോ തിരഞ്ഞെടുക്കാം. എസ്ബിഐയുടെ ഏറ്റവും മികച്ചതും മികച്ചതുമായ ചില സ്കീമുകൾ താഴെ കൊടുത്തിരിക്കുന്നു.
മികച്ച എസ്ബിഐ മ്യൂച്വൽ ഫണ്ട് സ്കീമുകൾ 2022
Fund NAV Net Assets (Cr) 3 MO (%) 6 MO (%) 1 YR (%) 3 YR (%) 5 YR (%) 2025 (%) SBI Magnum Children's Benefit Plan Growth ₹119.411
↑ 0.12 ₹149 1.1 7.3 8.6 10.9 9.9 3.2 SBI Small Cap Fund Growth ₹176.983
↑ 0.57 ₹42,631 -1.3 12.4 4 10 11.3 -4.9 SBI Debt Hybrid Fund Growth ₹76.0291
↑ 0.09 ₹10,226 -0.2 3.1 3.5 7.8 7.7 6.7 SBI Credit Risk Fund Growth ₹49.8088
↑ 0.04 ₹2,186 1.3 4 7 7.8 7 7.9 SBI Dynamic Bond Fund Growth ₹37.5854
↑ 0.01 ₹3,553 0.5 2.6 4.3 6.8 6 5.5 Note: Returns up to 1 year are on absolute basis & more than 1 year are on CAGR basis. as on 9 Oct 26 Research Highlights & Commentary of 5 Funds showcased
Commentary SBI Magnum Children's Benefit Plan SBI Small Cap Fund SBI Debt Hybrid Fund SBI Credit Risk Fund SBI Dynamic Bond Fund Point 1 Bottom quartile AUM (₹149 Cr). Highest AUM (₹42,631 Cr). Upper mid AUM (₹10,226 Cr). Bottom quartile AUM (₹2,186 Cr). Lower mid AUM (₹3,553 Cr). Point 2 Established history (24+ yrs). Established history (17+ yrs). Oldest track record among peers (25 yrs). Established history (22+ yrs). Established history (22+ yrs). Point 3 Top rated. Rating: 5★ (upper mid). Rating: 5★ (lower mid). Rating: 4★ (bottom quartile). Rating: 4★ (bottom quartile). Point 4 Risk profile: Moderately High. Risk profile: Moderately High. Risk profile: Moderate. Risk profile: Moderate. Risk profile: Moderate. Point 5 5Y return: 9.86% (upper mid). 5Y return: 11.27% (top quartile). 5Y return: 7.69% (lower mid). 1Y return: 6.97% (upper mid). 1Y return: 4.32% (lower mid). Point 6 3Y return: 10.95% (top quartile). 3Y return: 10.01% (upper mid). 3Y return: 7.77% (bottom quartile). 1M return: -0.18% (upper mid). 1M return: -0.02% (top quartile). Point 7 1Y return: 8.62% (top quartile). 1Y return: 4.04% (bottom quartile). 1Y return: 3.49% (bottom quartile). Sharpe: 1.34 (top quartile). Sharpe: -0.08 (bottom quartile). Point 8 1M return: -0.74% (lower mid). Alpha: 1.92 (top quartile). 1M return: -0.94% (bottom quartile). Information ratio: 0.00 (lower mid). Information ratio: 0.00 (bottom quartile). Point 9 Alpha: 0.00 (upper mid). Sharpe: 0.35 (lower mid). Alpha: 0.00 (lower mid). Yield to maturity (debt): 8.55% (top quartile). Yield to maturity (debt): 7.20% (bottom quartile). Point 10 Sharpe: 0.73 (upper mid). Information ratio: -0.31 (bottom quartile). Sharpe: 0.10 (bottom quartile). Modified duration: 2.13 yrs (upper mid). Modified duration: 3.48 yrs (bottom quartile). SBI Magnum Children's Benefit Plan
SBI Small Cap Fund
SBI Debt Hybrid Fund
SBI Credit Risk Fund
SBI Dynamic Bond Fund
HDFC മ്യൂച്വൽ ഫണ്ട്
HDFC മ്യൂച്വൽ ഫണ്ട് 2000-ലാണ് സ്ഥാപിതമായത്. ഇത് വീണ്ടും ഇന്ത്യയിലെ പ്രശസ്തമായ മ്യൂച്വൽ ഫണ്ട് കമ്പനികളിലൊന്നാണ്. മറ്റ് മ്യൂച്വൽ ഫണ്ട് കമ്പനികളെപ്പോലെ HDFC മ്യൂച്വൽ ഫണ്ടും ഓൺലൈൻ നിക്ഷേപ രീതി വാഗ്ദാനം ചെയ്യുന്നു. ഓൺലൈൻ നിക്ഷേപ രീതി ആളുകൾക്ക് സൗകര്യപ്രദമായി കണക്കാക്കപ്പെടുന്നു. ഓൺലൈൻ മോഡ് വഴി, ആളുകൾക്ക് മ്യൂച്വൽ ഫണ്ട് യൂണിറ്റുകൾ വാങ്ങാനും റിഡീം ചെയ്യാനും അവരുടെ പോർട്ട്ഫോളിയോയുടെ ട്രാക്ക് സൂക്ഷിക്കാനും അവരുടെ സ്കീമുകൾ എങ്ങനെ പ്രവർത്തിക്കുന്നുവെന്ന് പരിശോധിക്കാനും മറ്റ് അനുബന്ധ പ്രവർത്തനങ്ങൾ നടത്താനും കഴിയും. ഫണ്ട് ഹൗസിന്റെ വെബ്സൈറ്റ് വഴിയോ ഏതെങ്കിലും വിതരണക്കാരുടെ പോർട്ടൽ വഴിയോ ആളുകൾക്ക് എച്ച്ഡിഎഫ്സി സ്കീമുകളിൽ നിക്ഷേപിക്കാം. എന്നിരുന്നാലും, അതിലൊന്ന്നിക്ഷേപത്തിന്റെ നേട്ടങ്ങൾ ഡിസ്ട്രിബ്യൂട്ടർ മുഖേന ആളുകൾക്ക് ഒരു പോർട്ട്ഫോളിയോയ്ക്ക് കീഴിൽ നിരവധി സ്കീമുകൾ കണ്ടെത്താനാകും.
മികച്ച HDFC മ്യൂച്വൽ ഫണ്ട് സ്കീമുകൾ 2022
Fund NAV Net Assets (Cr) 3 MO (%) 6 MO (%) 1 YR (%) 3 YR (%) 5 YR (%) 2025 (%) HDFC Banking and PSU Debt Fund Growth ₹24.3339
↑ 0.00 ₹5,186 0.1 2.3 3.9 6.6 5.8 7.5 HDFC Corporate Bond Fund Growth ₹34.2721
↑ 0.01 ₹30,286 -0.2 2.2 3.4 6.7 5.9 7.3 HDFC Credit Risk Debt Fund Growth ₹26.0864
↑ 0.02 ₹7,666 1.2 3.4 6.2 7.6 6.5 8 HDFC Equity Savings Fund Growth ₹66.551
↑ 0.30 ₹5,758 -1.1 0.3 -0.2 6.9 6.7 6.8 HDFC Hybrid Debt Fund Growth ₹82.434
↑ 0.18 ₹3,201 -1.8 0.1 -0.3 6.5 6.8 5.5 Note: Returns up to 1 year are on absolute basis & more than 1 year are on CAGR basis. as on 9 Oct 26 Research Highlights & Commentary of 5 Funds showcased
Commentary HDFC Banking and PSU Debt Fund HDFC Corporate Bond Fund HDFC Credit Risk Debt Fund HDFC Equity Savings Fund HDFC Hybrid Debt Fund Point 1 Bottom quartile AUM (₹5,186 Cr). Highest AUM (₹30,286 Cr). Upper mid AUM (₹7,666 Cr). Lower mid AUM (₹5,758 Cr). Bottom quartile AUM (₹3,201 Cr). Point 2 Established history (12+ yrs). Established history (16+ yrs). Established history (12+ yrs). Oldest track record among peers (22 yrs). Established history (22+ yrs). Point 3 Top rated. Rating: 5★ (upper mid). Rating: 4★ (lower mid). Rating: 4★ (bottom quartile). Rating: 4★ (bottom quartile). Point 4 Risk profile: Moderately Low. Risk profile: Moderately Low. Risk profile: Moderate. Risk profile: Moderately High. Risk profile: Moderately High. Point 5 1Y return: 3.93% (upper mid). 1Y return: 3.43% (lower mid). 1Y return: 6.19% (top quartile). 5Y return: 6.74% (upper mid). 5Y return: 6.83% (top quartile). Point 6 1M return: -0.37% (upper mid). 1M return: -0.52% (lower mid). 1M return: -0.05% (top quartile). 3Y return: 6.95% (upper mid). 3Y return: 6.53% (bottom quartile). Point 7 Sharpe: -0.22 (upper mid). Sharpe: -0.23 (lower mid). Sharpe: 0.88 (top quartile). 1Y return: -0.16% (bottom quartile). 1Y return: -0.28% (bottom quartile). Point 8 Information ratio: 0.00 (top quartile). Information ratio: 0.00 (upper mid). Information ratio: 0.00 (lower mid). 1M return: -1.47% (bottom quartile). 1M return: -1.17% (bottom quartile). Point 9 Yield to maturity (debt): 7.56% (bottom quartile). Yield to maturity (debt): 7.61% (lower mid). Yield to maturity (debt): 8.76% (top quartile). Alpha: 0.00 (bottom quartile). Alpha: 0.00 (bottom quartile). Point 10 Modified duration: 2.89 yrs (lower mid). Modified duration: 3.81 yrs (bottom quartile). Modified duration: 2.27 yrs (top quartile). Sharpe: -0.27 (bottom quartile). Sharpe: -0.40 (bottom quartile). HDFC Banking and PSU Debt Fund
HDFC Corporate Bond Fund
HDFC Credit Risk Debt Fund
HDFC Equity Savings Fund
HDFC Hybrid Debt Fund
ഉപസംഹാരം
മൊത്തത്തിൽ, സാങ്കേതികവിദ്യയിൽ വളരെയധികം പുരോഗതികൾ ഉണ്ടായിട്ടുണ്ടെങ്കിലും, വ്യക്തികൾ എല്ലായ്പ്പോഴും ലക്ഷ്യങ്ങൾക്ക് അനുസൃതമായ മ്യൂച്വൽ ഫണ്ട് സ്കീമുകൾ തിരഞ്ഞെടുത്ത് നിക്ഷേപിക്കണം എന്ന് നിഗമനം ചെയ്യാം. കൂടാതെ, അവർക്ക് MFOnline-നെ കുറിച്ച് സമഗ്രമായ വീക്ഷണവും ഉണ്ടായിരിക്കണം, അതുവഴി അവരുടെ നിക്ഷേപം അവർക്ക് ആവശ്യമായ ഫലങ്ങൾ നൽകുന്നു.
ഇവിടെ നൽകിയിരിക്കുന്ന വിവരങ്ങൾ കൃത്യമാണെന്ന് ഉറപ്പാക്കാൻ എല്ലാ ശ്രമങ്ങളും നടത്തിയിട്ടുണ്ട്. എന്നിരുന്നാലും, ഡാറ്റയുടെ കൃത്യത സംബന്ധിച്ച് യാതൊരു ഉറപ്പും നൽകുന്നില്ല. എന്തെങ്കിലും നിക്ഷേപം നടത്തുന്നതിന് മുമ്പ് സ്കീം വിവര രേഖ ഉപയോഗിച്ച് പരിശോധിക്കുക.











AMFI Registration No. 112358 | CIN: U74999MH2016PTC282153
Shepard Technologies Pvt. Ltd. (with ARN code 112358) makes no warranties or representations, express or implied, on products offered through the platform. It accepts no liability for any damages or losses, however caused, in connection with the use of, or on the reliance of its product or related services. Terms and conditions of the website are applicable.
©2026 Shepard Technologies Private Limited. All Rights Reserved