ਲੰਬੀ ਮਿਆਦ ਦੇ ਨਿਵੇਸ਼ 2022 ਲਈ ਵਧੀਆ SIP ਯੋਜਨਾਵਾਂ
ਪ੍ਰਣਾਲੀਗਤ ਦੀ ਧਾਰਨਾਨਿਵੇਸ਼ ਯੋਜਨਾ (SIP) ਪਿਛਲੇ ਕੁਝ ਸਾਲਾਂ ਤੋਂ ਭਾਰਤੀ ਨਿਵੇਸ਼ਕਾਂ ਵਿੱਚ ਬਹੁਤ ਪ੍ਰਸਿੱਧੀ ਪ੍ਰਾਪਤ ਕਰ ਰਿਹਾ ਹੈ। ਇਹ ਲੰਬੇ ਸਮੇਂ ਦੀ ਬੱਚਤ ਦੀ ਆਦਤ ਬਣਾਉਣ ਦਾ ਇੱਕ ਵਧੀਆ ਤਰੀਕਾ ਹੈ। ਇਹ ਭਵਿੱਖ ਲਈ ਇੱਕ ਵੱਡਾ ਕਾਰਪਸ ਬਣਾਉਣ ਵਿੱਚ ਮਦਦ ਕਰਦਾ ਹੈਵਿੱਤੀ ਟੀਚੇ. ਇੱਕ SIP ਵਿੱਚ, ਇੱਕ ਨਿਸ਼ਚਿਤ ਰਕਮ ਦੁਆਰਾ ਇੱਕ ਨਿਸ਼ਚਿਤ ਮਿਤੀ ਨੂੰ ਇੱਕ ਫੰਡ ਵਿੱਚ ਮਹੀਨਾਵਾਰ ਨਿਵੇਸ਼ ਕੀਤਾ ਜਾਂਦਾ ਹੈਨਿਵੇਸ਼ਕ. ਇੱਕ ਵਾਰ ਜਦੋਂ ਤੁਸੀਂ ਸ਼ੁਰੂ ਕਰਦੇ ਹੋਨਿਵੇਸ਼ ਲੰਬੇ ਸਮੇਂ ਲਈ ਇੱਕ SIP ਵਿੱਚ ਮਹੀਨਾਵਾਰ, ਤੁਹਾਡਾ ਪੈਸਾ ਹਰ ਦਿਨ ਵਧਣਾ ਸ਼ੁਰੂ ਹੁੰਦਾ ਹੈ (ਸਟਾਕ ਵਿੱਚ ਨਿਵੇਸ਼ ਕੀਤਾ ਜਾ ਰਿਹਾ ਹੈਬਜ਼ਾਰ). ਸਿਸਟਮੈਟਿਕ ਇਨਵੈਸਟਮੈਂਟ ਪਲਾਨ ਤੁਹਾਡੀ ਖਰੀਦ ਲਾਗਤ ਨੂੰ ਔਸਤ ਕਰਨ ਅਤੇ ਰਿਟਰਨ ਨੂੰ ਵੱਧ ਤੋਂ ਵੱਧ ਕਰਨ ਵਿੱਚ ਤੁਹਾਡੀ ਮਦਦ ਕਰਦਾ ਹੈ। ਜਦੋਂ ਇੱਕ ਨਿਵੇਸ਼ਕ ਇੱਕ ਅਵਧੀ ਵਿੱਚ ਨਿਯਮਿਤ ਤੌਰ 'ਤੇ ਨਿਵੇਸ਼ ਕਰਦਾ ਹੈ, ਬਜ਼ਾਰ ਦੀਆਂ ਸਥਿਤੀਆਂ ਦੀ ਪਰਵਾਹ ਕੀਤੇ ਬਿਨਾਂ, ਉਸਨੂੰ ਮਾਰਕੀਟ ਘੱਟ ਹੋਣ 'ਤੇ ਵਧੇਰੇ ਯੂਨਿਟਾਂ ਅਤੇ ਜਦੋਂ ਮਾਰਕੀਟ ਉੱਚੀ ਹੁੰਦੀ ਹੈ ਤਾਂ ਘੱਟ ਇਕਾਈਆਂ ਪ੍ਰਾਪਤ ਹੁੰਦੀਆਂ ਹਨ। ਇਹ ਤੁਹਾਡੀਆਂ ਮਿਉਚੁਅਲ ਫੰਡ ਇਕਾਈਆਂ ਦੀ ਖਰੀਦ ਲਾਗਤ ਦਾ ਔਸਤ ਕੱਢਦਾ ਹੈ। ਇਸੇ ਤਰ੍ਹਾਂ, ਆਓ ਲੰਬੇ ਸਮੇਂ ਵਿੱਚ ਇੱਕ SIP ਦੇ ਕੁਝ ਸਭ ਤੋਂ ਮਹੱਤਵਪੂਰਨ ਲਾਭਾਂ ਦੀ ਜਾਂਚ ਕਰੀਏ.
Talk to our investment specialist
ਲੰਬੇ ਸਮੇਂ ਦੇ SIP ਨਿਵੇਸ਼ ਦੇ ਲਾਭ
SIP ਦੇ ਕੁਝ ਮਹੱਤਵਪੂਰਨ ਫਾਇਦੇ ਹਨ:
ਮਿਸ਼ਰਿਤ ਕਰਨ ਦੀ ਸ਼ਕਤੀ
ਜਦੋਂ ਤੁਸੀਂ ਲੰਬੇ ਸਮੇਂ ਲਈ ਨਿਵੇਸ਼ ਕਰਦੇ ਹੋ, ਤਾਂ ਤੁਹਾਡਾ ਨਿਵੇਸ਼ ਸ਼ੁਰੂ ਹੁੰਦਾ ਹੈਮਿਸ਼ਰਤ. ਇਸਦਾ ਮਤਲਬ ਇਹ ਹੈ ਕਿ ਜਦੋਂ ਤੁਸੀਂ ਆਪਣੇ ਨਿਵੇਸ਼ ਦੁਆਰਾ ਪ੍ਰਾਪਤ ਕੀਤੇ ਰਿਟਰਨ 'ਤੇ ਰਿਟਰਨ ਕਮਾਉਂਦੇ ਹੋ, ਤਾਂ ਤੁਹਾਡਾ ਪੈਸਾ ਮਿਸ਼ਰਿਤ ਹੋਣਾ ਸ਼ੁਰੂ ਹੋ ਜਾਵੇਗਾ। ਇਹ ਤੁਹਾਨੂੰ ਨਿਯਮਤ ਛੋਟੇ ਨਿਵੇਸ਼ਾਂ ਦੇ ਨਾਲ ਲੰਬੇ ਸਮੇਂ ਲਈ ਇੱਕ ਵੱਡਾ ਕਾਰਪਸ ਬਣਾਉਣ ਵਿੱਚ ਮਦਦ ਕਰਦਾ ਹੈ।
ਟੀਚਿਆਂ ਨੂੰ ਪ੍ਰਾਪਤ ਕਰਨ ਵਿੱਚ ਮਦਦ ਕਰਦਾ ਹੈ
SIP ਤੁਹਾਡੇ ਲੰਬੇ ਸਮੇਂ ਦੇ ਵਿੱਤੀ ਟੀਚਿਆਂ ਨੂੰ ਪ੍ਰਾਪਤ ਕਰਨ ਦਾ ਇੱਕ ਸਮਾਰਟ ਤਰੀਕਾ ਹੈ ਜਿਵੇਂ ਕਿਸੇਵਾਮੁਕਤੀ, ਵਿਆਹ, ਘਰ/ਕਾਰ ਦੀ ਖਰੀਦਦਾਰੀ ਆਦਿ ਨਿਵੇਸ਼ਕ ਬਸ ਸ਼ੁਰੂ ਕਰ ਸਕਦੇ ਹਨਮਿਉਚੁਅਲ ਫੰਡਾਂ ਵਿੱਚ ਨਿਵੇਸ਼ ਕਰਨਾ ਉਹਨਾਂ ਦੇ ਵਿੱਤੀ ਟੀਚਿਆਂ ਦੇ ਅਨੁਸਾਰ ਅਤੇ ਉਹਨਾਂ ਨੂੰ ਨਿਸ਼ਚਿਤ ਸਮੇਂ 'ਤੇ ਪ੍ਰਾਪਤ ਕਰਨਾ। ਜੇਕਰ ਕੋਈ ਛੋਟੀ ਉਮਰ ਵਿੱਚ ਨਿਵੇਸ਼ ਕਰਨਾ ਸ਼ੁਰੂ ਕਰ ਦਿੰਦਾ ਹੈ, ਤਾਂ ਉਹਨਾਂ ਦੇ SIP ਨੂੰ ਵਧਣ ਲਈ ਕਾਫ਼ੀ ਸਮਾਂ ਹੁੰਦਾ ਹੈ। ਇਸ ਤਰ੍ਹਾਂ ਆਪਣੇ ਸਾਰੇ ਟੀਚਿਆਂ ਨੂੰ ਸਮੇਂ ਸਿਰ ਪੂਰਾ ਕਰਨਾ ਵੀ ਆਸਾਨ ਹੋ ਜਾਂਦਾ ਹੈ।
ਕਿਫਾਇਤੀ
ਯੋਜਨਾਬੱਧ ਨਿਵੇਸ਼ ਯੋਜਨਾ ਦੇ ਸਭ ਤੋਂ ਆਕਰਸ਼ਕ ਹਿੱਸਿਆਂ ਵਿੱਚੋਂ ਇੱਕ ਇਸਦੀ ਸਮਰੱਥਾ ਹੈ। ਕੋਈ ਵੀ INR 500 ਤੋਂ ਘੱਟ ਰਕਮ ਦਾ ਨਿਵੇਸ਼ ਕਰ ਸਕਦਾ ਹੈ, ਜਿਸ ਨਾਲ ਵੱਡੀ ਗਿਣਤੀ ਵਿੱਚ ਭਾਰਤੀਆਂ ਨੂੰ ਨਿਵੇਸ਼ ਸ਼ੁਰੂ ਕਰਨ ਦਾ ਰਸਤਾ ਮਿਲਦਾ ਹੈ। ਇਸ ਲਈ, ਜੋ ਇੱਕਮੁਸ਼ਤ ਭੁਗਤਾਨ ਨਹੀਂ ਕਰ ਸਕਦਾ, ਇੱਕ SIP ਦੁਆਰਾ ਨਿਵੇਸ਼ ਕਰ ਸਕਦਾ ਹੈਮਿਉਚੁਅਲ ਫੰਡ.
ਲੰਬੇ ਸਮੇਂ ਦੇ ਨਿਵੇਸ਼ ਲਈ SIP ਸਭ ਤੋਂ ਵਧੀਆ ਕਿਉਂ ਹੈ?
ਨਿਵੇਸ਼ਕ ਅਕਸਰ ਹੈਰਾਨ ਹੁੰਦੇ ਹਨ ਕਿ ਇੱਕਮੁਸ਼ਤ ਮੋਡ ਨਾਲੋਂ ਲੰਬੇ ਸਮੇਂ ਵਿੱਚ SIPs ਵਧੇਰੇ ਲਾਭਕਾਰੀ ਕਿਵੇਂ ਹਨ। ਖੈਰ, ਇਤਿਹਾਸਕ ਡੇਟਾ ਅਜਿਹਾ ਕਹਿੰਦਾ ਹੈ! ਆਉ ਸਟਾਕ ਮਾਰਕੀਟ ਦੇ ਸਭ ਤੋਂ ਭੈੜੇ ਦੌਰ ਦੇ ਡੇਟਾ ਦੀ ਜਾਂਚ ਕਰੀਏ.
ਨਿਵੇਸ਼ ਸ਼ੁਰੂ ਕਰਨ ਦਾ ਸਭ ਤੋਂ ਮਾੜਾ ਸਮਾਂ ਸਤੰਬਰ 1994 ਦੇ ਆਸਪਾਸ ਸੀ (ਇਹ ਉਹ ਸਮਾਂ ਸੀ ਜਦੋਂ ਸਟਾਕ ਮਾਰਕੀਟ ਸਿਖਰ 'ਤੇ ਸੀ)। ਜੇਕਰ ਕੋਈ ਬਜ਼ਾਰ ਦੇ ਅੰਕੜਿਆਂ 'ਤੇ ਨਜ਼ਰ ਮਾਰਦਾ ਹੈ, ਜਿਸ ਨਿਵੇਸ਼ਕ ਨੇ ਇੱਕਮੁਸ਼ਤ ਨਿਵੇਸ਼ ਕੀਤਾ ਸੀ, ਉਹ 59 ਮਹੀਨਿਆਂ (ਲਗਭਗ 5 ਸਾਲ!) ਲਈ ਨਕਾਰਾਤਮਕ ਰਿਟਰਨ 'ਤੇ ਬੈਠਾ ਸੀ। 1999 ਦੇ ਲਗਭਗ ਜੁਲਾਈ ਵਿੱਚ ਨਿਵੇਸ਼ਕ ਵੀ ਟੁੱਟ ਗਿਆ। ਅਗਲੇ ਸਾਲ ਹਾਲਾਂਕਿ ਕੁਝ ਰਿਟਰਨ ਪੈਦਾ ਹੋਏ ਸਨ, ਪਰ ਬਾਅਦ ਵਿੱਚ 2000 ਦੇ ਸਟਾਕ ਮਾਰਕੀਟ ਕਰੈਸ਼ ਕਾਰਨ ਇਹ ਰਿਟਰਨ ਥੋੜ੍ਹੇ ਸਮੇਂ ਲਈ ਰਹੇ। ਹੋਰ 4 ਸਾਲ ਤਕ ਦੁੱਖ ਝੱਲਣ ਤੋਂ ਬਾਅਦ (ਨਕਾਰਾਤਮਕ ਰਿਟਰਨ ਦੇ ਨਾਲ) ਅਤੇ ਨਿਵੇਸ਼ਕ ਅੰਤ ਵਿੱਚ ਅਕਤੂਬਰ 2003 ਵਿੱਚ ਸਕਾਰਾਤਮਕ ਹੋ ਗਿਆ। ਇਹ ਇੱਕਮੁਸ਼ਤ ਨਿਵੇਸ਼ ਕਰਨ ਦਾ ਸਭ ਤੋਂ ਬੁਰਾ ਸਮਾਂ ਸੀ।
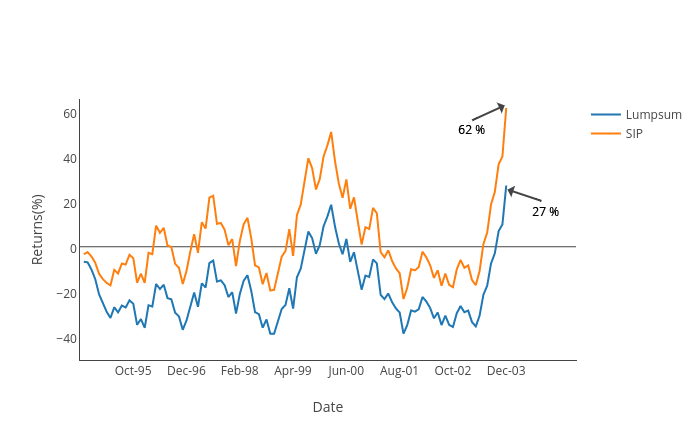
SIP ਨਿਵੇਸ਼ਕ ਨੂੰ ਕੀ ਹੋਇਆ? ਯੋਜਨਾਬੱਧ ਨਿਵੇਸ਼ ਯੋਜਨਾ ਨਿਵੇਸ਼ਕ ਸਿਰਫ 19 ਮਹੀਨਿਆਂ ਲਈ ਨਕਾਰਾਤਮਕ ਸੀ ਅਤੇ ਮੁਨਾਫੇ ਪੋਸਟ ਕਰਨਾ ਸ਼ੁਰੂ ਕਰ ਦਿੱਤਾ, ਹਾਲਾਂਕਿ, ਇਹ ਥੋੜ੍ਹੇ ਸਮੇਂ ਲਈ ਸਨ। ਐਸਆਈਪੀ ਨਿਵੇਸ਼ਕ ਅੰਤਰਿਮ ਨੁਕਸਾਨ ਝੱਲਣ ਤੋਂ ਬਾਅਦ ਮਈ 1999 ਤੱਕ ਦੁਬਾਰਾ ਵੱਧ ਗਏ ਸਨ। ਹਾਲਾਂਕਿ ਯਾਤਰਾ ਅਜੇ ਵੀ ਅਸਥਿਰ ਰਹੀ, SIP ਨਿਵੇਸ਼ਕਾਂ ਨੇ ਪੋਰਟਫੋਲੀਓ ਵਿੱਚ ਬਹੁਤ ਪਹਿਲਾਂ ਮੁਨਾਫਾ ਦਿਖਾਇਆ.
ਤਾਂ, ਕਿਸਨੇ ਬਿਹਤਰ ਮੁਨਾਫਾ ਕਮਾਇਆ? ਇੱਕਮੁਸ਼ਤ ਨਿਵੇਸ਼ਕ ਲਈ ਵੱਧ ਤੋਂ ਵੱਧ ਨੁਕਸਾਨ ਲਗਭਗ 40% ਸੀ, ਜਦੋਂ ਕਿ SIP ਨਿਵੇਸ਼ਕ ਲਈ 23% ਸੀ। ਯੋਜਨਾਬੱਧ ਨਿਵੇਸ਼ ਯੋਜਨਾ ਨਿਵੇਸ਼ਕ ਕੋਲ ਪੋਰਟਫੋਲੀਓ ਵਿੱਚ ਘੱਟ ਨੁਕਸਾਨ ਦੇ ਨਾਲ-ਨਾਲ ਤੇਜ਼ੀ ਨਾਲ ਰਿਕਵਰੀ ਦੀ ਮਿਆਦ ਸੀ।
ਲੰਬੀ ਮਿਆਦ ਦੇ SIP ਨਿਵੇਸ਼ ਲਈ ਸਰਬੋਤਮ ਮਿਉਚੁਅਲ ਫੰਡ
ਦੇ ਕੁਝਵਧੀਆ ਮਿਉਚੁਅਲ ਫੰਡ ਲੰਬੇ ਸਮੇਂ ਲਈ SIP ਹੇਠ ਲਿਖੇ ਅਨੁਸਾਰ ਹਨ-
ਲੰਬੀ ਮਿਆਦ ਦੇ SIP ਲਈ ਵਧੀਆ ਵੱਡੇ ਕੈਪ ਫੰਡ
ਵੱਡੇ ਕੈਪ ਫੰਡ ਦੀ ਇੱਕ ਕਿਸਮ ਹਨਇਕੁਇਟੀ ਮਿਉਚੁਅਲ ਫੰਡ ਜਿੱਥੇ ਕਾਰਪਸ ਨੂੰ ਵੱਡੀ ਮਾਰਕੀਟ ਪੂੰਜੀਕਰਣ ਵਾਲੀਆਂ ਕੰਪਨੀਆਂ ਦੇ ਸਟਾਕਾਂ ਵਿੱਚ ਨਿਵੇਸ਼ ਕੀਤਾ ਜਾਂਦਾ ਹੈ। ਇਹ ਕੰਪਨੀਆਂ ਮੁੱਖ ਤੌਰ 'ਤੇ ਵੱਡੇ ਕਾਰੋਬਾਰਾਂ ਅਤੇ ਵੱਡੀਆਂ ਟੀਮਾਂ ਵਾਲੀਆਂ ਵੱਡੀਆਂ ਫਰਮਾਂ ਹਨ। ਇਹਨਾਂ ਕੰਪਨੀਆਂ ਦਾ ਮਾਰਕੀਟ ਪੂੰਜੀਕਰਣ INR 1000 ਕਰੋੜ ਅਤੇ ਹੋਰ ਹੈ। ਕਿਉਂਕਿ, ਨਿਵੇਸ਼ ਵੱਡੀਆਂ ਕੰਪਨੀਆਂ ਵਿੱਚ ਕੀਤੇ ਜਾਂਦੇ ਹਨ, ਇਹਨਾਂ ਫਰਮਾਂ ਵਿੱਚ ਸਾਲ ਦਰ ਸਾਲ ਸਥਿਰ ਵਾਧਾ ਦਰਸਾਉਣ ਦੀ ਵਧੇਰੇ ਸੰਭਾਵਨਾ ਹੁੰਦੀ ਹੈ, ਜੋ ਬਦਲੇ ਵਿੱਚ ਸਮੇਂ ਦੇ ਨਾਲ ਸਥਿਰਤਾ ਦੀ ਪੇਸ਼ਕਸ਼ ਵੀ ਕਰਦੀ ਹੈ। ਇਹ ਫੰਡ ਮੱਧ ਅਤੇ ਦੇ ਮੁਕਾਬਲੇ ਬਾਜ਼ਾਰ ਦੇ ਉਤਰਾਅ-ਚੜ੍ਹਾਅ ਲਈ ਸੁਰੱਖਿਅਤ ਅਤੇ ਘੱਟ ਅਸਥਿਰ ਮੰਨੇ ਜਾਂਦੇ ਹਨਸਮਾਲ ਕੈਪ ਫੰਡ.
Fund NAV Net Assets (Cr) Min SIP Investment 3 MO (%) 6 MO (%) 1 YR (%) 3 YR (%) 5 YR (%) 2025 (%) Invesco India Largecap Fund Growth ₹71.9
↓ -0.13 ₹1,847 100 6.7 4.2 4.8 13.5 11.9 5.5 Bandhan Large Cap Fund Growth ₹78.49
↑ 0.17 ₹2,061 100 4 0.8 1.8 12.5 11.6 8.2 ICICI Prudential Bluechip Fund Growth ₹109.42
↑ 0.39 ₹79,421 100 2.6 -2.1 -0.7 12.2 13.1 11.3 Nippon India Large Cap Fund Growth ₹90.2869
↑ 0.11 ₹53,227 100 1.8 -1 0.1 12.1 14.9 9.2 DSP TOP 100 Equity Growth ₹461.724
↑ 0.93 ₹7,190 500 2.2 -2.7 -2.2 11.6 10.3 8.4 Note: Returns up to 1 year are on absolute basis & more than 1 year are on CAGR basis. as on 30 Jul 26 Research Highlights & Commentary of 5 Funds showcased
Commentary Invesco India Largecap Fund Bandhan Large Cap Fund ICICI Prudential Bluechip Fund Nippon India Large Cap Fund DSP TOP 100 Equity Point 1 Bottom quartile AUM (₹1,847 Cr). Bottom quartile AUM (₹2,061 Cr). Highest AUM (₹79,421 Cr). Upper mid AUM (₹53,227 Cr). Lower mid AUM (₹7,190 Cr). Point 2 Established history (16+ yrs). Established history (20+ yrs). Established history (18+ yrs). Established history (18+ yrs). Oldest track record among peers (23 yrs). Point 3 Rating: 3★ (lower mid). Rating: 2★ (bottom quartile). Top rated. Rating: 4★ (upper mid). Rating: 2★ (bottom quartile). Point 4 Risk profile: Moderately High. Risk profile: Moderately High. Risk profile: Moderately High. Risk profile: Moderately High. Risk profile: Moderately High. Point 5 5Y return: 11.94% (lower mid). 5Y return: 11.59% (bottom quartile). 5Y return: 13.14% (upper mid). 5Y return: 14.89% (top quartile). 5Y return: 10.33% (bottom quartile). Point 6 3Y return: 13.53% (top quartile). 3Y return: 12.49% (upper mid). 3Y return: 12.24% (lower mid). 3Y return: 12.05% (bottom quartile). 3Y return: 11.55% (bottom quartile). Point 7 1Y return: 4.81% (top quartile). 1Y return: 1.79% (upper mid). 1Y return: -0.73% (bottom quartile). 1Y return: 0.06% (lower mid). 1Y return: -2.19% (bottom quartile). Point 8 Alpha: 3.75 (top quartile). Alpha: 2.34 (upper mid). Alpha: -1.21 (bottom quartile). Alpha: 1.07 (lower mid). Alpha: -2.70 (bottom quartile). Point 9 Sharpe: -0.25 (top quartile). Sharpe: -0.35 (upper mid). Sharpe: -0.55 (bottom quartile). Sharpe: -0.43 (lower mid). Sharpe: -0.68 (bottom quartile). Point 10 Information ratio: 0.82 (lower mid). Information ratio: 0.63 (bottom quartile). Information ratio: 0.85 (upper mid). Information ratio: 0.98 (top quartile). Information ratio: 0.53 (bottom quartile). Invesco India Largecap Fund
Bandhan Large Cap Fund
ICICI Prudential Bluechip Fund
Nippon India Large Cap Fund
DSP TOP 100 Equity
ਲੰਬੀ ਮਿਆਦ ਦੇ SIP ਲਈ ਵਧੀਆ ਮਿਡ ਅਤੇ ਸਮਾਲ ਕੈਪ ਫੰਡ
ਮਿਡ ਕੈਪ ਅਤੇ ਸਮਾਲ ਕੈਪ ਫੰਡ ਇੱਕ ਕਿਸਮ ਦੇ ਇਕੁਇਟੀ ਮਿਉਚੁਅਲ ਫੰਡ ਹਨ ਜੋ ਭਾਰਤ ਵਿੱਚ ਉੱਭਰ ਰਹੀਆਂ ਕੰਪਨੀਆਂ ਵਿੱਚ ਨਿਵੇਸ਼ ਕਰਦੇ ਹਨ।ਮਿਡ ਕੈਪ ਫੰਡ ਉਹਨਾਂ ਕੰਪਨੀਆਂ ਵਿੱਚ ਨਿਵੇਸ਼ ਕਰੋ ਜਿਹਨਾਂ ਦੀ ਮਾਰਕੀਟ ਪੂੰਜੀਕਰਣ INR 500 ਤੋਂ 1000 ਕਰੋੜ ਹੈ। ਅਤੇ, ਛੋਟੇ ਕੈਪਸ ਨੂੰ ਆਮ ਤੌਰ 'ਤੇ ਲਗਭਗ INR 500 ਕਰੋੜ ਦੀ ਮਾਰਕੀਟ ਕੈਪ ਵਾਲੀਆਂ ਫਰਮਾਂ ਵਜੋਂ ਪਰਿਭਾਸ਼ਿਤ ਕੀਤਾ ਜਾਂਦਾ ਹੈ। ਇਹਨਾਂ ਫਰਮਾਂ ਨੂੰ ਮਾਰਕੀਟ ਦੇ ਭਵਿੱਖ ਦੇ ਨੇਤਾ ਕਿਹਾ ਜਾਂਦਾ ਹੈ. ਜੇਕਰ ਕੰਪਨੀ ਭਵਿੱਖ ਵਿੱਚ ਵਧੀਆ ਪ੍ਰਦਰਸ਼ਨ ਕਰਦੀ ਹੈ, ਤਾਂ ਇਹਨਾਂ ਫੰਡਾਂ ਵਿੱਚ ਲੰਬੇ ਸਮੇਂ ਵਿੱਚ ਵਧੀਆ ਰਿਟਰਨ ਪ੍ਰਦਾਨ ਕਰਨ ਦੀ ਬਹੁਤ ਸੰਭਾਵਨਾ ਹੈ। ਪਰ, ਮਿਡ ਅਤੇ ਸਮਾਲ ਕੈਪ ਫੰਡਾਂ ਵਿੱਚ ਜੋਖਮ ਵੱਧ ਹੁੰਦਾ ਹੈ। ਇਸ ਲਈ, ਜਦੋਂ ਕੋਈ ਨਿਵੇਸ਼ਕ ਇਹਨਾਂ ਫੰਡਾਂ ਵਿੱਚ ਨਿਵੇਸ਼ ਕਰ ਰਿਹਾ ਹੈ, ਤਾਂ ਉਹਨਾਂ ਨੂੰ ਲੰਬੇ ਸਮੇਂ ਲਈ ਨਿਵੇਸ਼ ਕਰਨਾ ਚਾਹੀਦਾ ਹੈ।
Fund NAV Net Assets (Cr) Min SIP Investment 3 MO (%) 6 MO (%) 1 YR (%) 3 YR (%) 5 YR (%) 2025 (%) Motilal Oswal Midcap 30 Fund Growth ₹99.866
↓ -0.47 ₹37,474 500 9.8 8.5 -2 19.2 21.6 -12.1 Invesco India Mid Cap Fund Growth ₹197.48
↓ -1.53 ₹13,767 500 10.4 14.8 9.5 24.4 19.2 6.3 Nippon India Small Cap Fund Growth ₹178.759
↓ -0.94 ₹78,407 100 4.9 12.2 4.9 16 18.3 -4.7 Edelweiss Mid Cap Fund Growth ₹108.248
↓ -0.25 ₹17,748 500 5.1 6.1 8.2 21.8 17.9 3.8 Sundaram Mid Cap Fund Growth ₹1,505.42
↓ -2.40 ₹14,026 100 6.3 8.1 9.3 20.7 17.8 4.1 Note: Returns up to 1 year are on absolute basis & more than 1 year are on CAGR basis. as on 30 Jul 26 Research Highlights & Commentary of 5 Funds showcased
Commentary Motilal Oswal Midcap 30 Fund Invesco India Mid Cap Fund Nippon India Small Cap Fund Edelweiss Mid Cap Fund Sundaram Mid Cap Fund Point 1 Upper mid AUM (₹37,474 Cr). Bottom quartile AUM (₹13,767 Cr). Highest AUM (₹78,407 Cr). Lower mid AUM (₹17,748 Cr). Bottom quartile AUM (₹14,026 Cr). Point 2 Established history (12+ yrs). Established history (19+ yrs). Established history (15+ yrs). Established history (18+ yrs). Oldest track record among peers (24 yrs). Point 3 Rating: 3★ (lower mid). Rating: 2★ (bottom quartile). Top rated. Rating: 3★ (bottom quartile). Rating: 4★ (upper mid). Point 4 Risk profile: Moderately High. Risk profile: Moderately High. Risk profile: Moderately High. Risk profile: High. Risk profile: Moderately High. Point 5 5Y return: 21.58% (top quartile). 5Y return: 19.17% (upper mid). 5Y return: 18.27% (lower mid). 5Y return: 17.87% (bottom quartile). 5Y return: 17.81% (bottom quartile). Point 6 3Y return: 19.16% (bottom quartile). 3Y return: 24.40% (top quartile). 3Y return: 16.02% (bottom quartile). 3Y return: 21.76% (upper mid). 3Y return: 20.69% (lower mid). Point 7 1Y return: -1.98% (bottom quartile). 1Y return: 9.46% (top quartile). 1Y return: 4.86% (bottom quartile). 1Y return: 8.20% (lower mid). 1Y return: 9.31% (upper mid). Point 8 Alpha: -14.72 (bottom quartile). Alpha: 0.00 (lower mid). Alpha: 3.21 (top quartile). Alpha: -1.09 (bottom quartile). Alpha: 0.71 (upper mid). Point 9 Sharpe: -0.71 (bottom quartile). Sharpe: 0.19 (top quartile). Sharpe: 0.02 (lower mid). Sharpe: -0.04 (bottom quartile). Sharpe: 0.06 (upper mid). Point 10 Information ratio: -0.25 (bottom quartile). Information ratio: 0.00 (lower mid). Information ratio: -0.27 (bottom quartile). Information ratio: 0.48 (top quartile). Information ratio: 0.32 (upper mid). Motilal Oswal Midcap 30 Fund
Invesco India Mid Cap Fund
Nippon India Small Cap Fund
Edelweiss Mid Cap Fund
Sundaram Mid Cap Fund
ਲੰਬੀ ਮਿਆਦ ਦੇ SIP ਲਈ ਵਧੀਆ ਵਿਭਿੰਨ ਫੰਡ
ਵਿਵਿਧ ਫੰਡ ਇਕੁਇਟੀ ਮਿਉਚੁਅਲ ਫੰਡਾਂ ਦੀ ਇੱਕ ਸ਼੍ਰੇਣੀ ਹੈ। ਇਹ ਉਹ ਫੰਡ ਹਨ ਜੋ ਮਾਰਕੀਟ ਪੂੰਜੀਕਰਣ ਵਿੱਚ ਨਿਵੇਸ਼ ਕਰਦੇ ਹਨ, ਅਰਥਾਤ, ਵੱਡੇ, ਮੱਧ ਅਤੇ ਛੋਟੇ ਕੈਪ ਫੰਡਾਂ ਵਿੱਚ। ਜਿਵੇਂ ਕਿ, ਵਿਭਿੰਨ ਫੰਡ ਮਾਰਕੀਟ ਕੈਪਸ ਵਿੱਚ ਨਿਵੇਸ਼ ਕਰਦੇ ਹਨ, ਉਹ ਪੋਰਟਫੋਲੀਓ ਨੂੰ ਸੰਤੁਲਿਤ ਕਰਨ ਵਿੱਚ ਮਾਹਰ ਹੁੰਦੇ ਹਨ। ਨਿਵੇਸ਼ਕ ਵਿਭਿੰਨ ਫੰਡਾਂ ਵਿੱਚ ਨਿਵੇਸ਼ ਕਰਕੇ ਆਪਣੇ ਪੋਰਟਫੋਲੀਓ ਵਿੱਚ ਇੱਕ ਚੰਗਾ ਸੰਤੁਲਨ ਬਣਾ ਸਕਦੇ ਹਨ। ਹਾਲਾਂਕਿ, ਉਹ ਅਜੇ ਵੀ ਇੱਕ ਅਸਥਿਰ ਮਾਰਕੀਟ ਸਥਿਤੀ ਦੇ ਦੌਰਾਨ ਇਕੁਇਟੀ ਦੀ ਅਸਥਿਰਤਾ ਦੁਆਰਾ ਪ੍ਰਭਾਵਿਤ ਹੋਣਗੇ.
Fund NAV Net Assets (Cr) Min SIP Investment 3 MO (%) 6 MO (%) 1 YR (%) 3 YR (%) 5 YR (%) 2025 (%) IDBI Diversified Equity Fund Growth ₹37.99
↑ 0.14 ₹382 500 10.2 13.2 13.5 22.7 12 Aditya Birla Sun Life Manufacturing Equity Fund Growth ₹38.13
↑ 0.16 ₹1,229 1,000 8 18.7 19.6 19.7 14.2 3.5 Motilal Oswal Multicap 35 Fund Growth ₹61.2017
↓ -0.37 ₹13,294 500 9.9 6.5 -1.2 18.6 12.3 -5.6 BNP Paribas Multi Cap Fund Growth ₹73.5154
↓ -0.01 ₹588 300 -4.6 -2.6 19.3 17.3 13.6 Mahindra Badhat Yojana Growth ₹38.357
↓ -0.08 ₹6,926 500 6.4 8.7 7.6 16.9 15.3 3.4 Note: Returns up to 1 year are on absolute basis & more than 1 year are on CAGR basis. as on 28 Jul 23 Research Highlights & Commentary of 5 Funds showcased
Commentary IDBI Diversified Equity Fund Aditya Birla Sun Life Manufacturing Equity Fund Motilal Oswal Multicap 35 Fund BNP Paribas Multi Cap Fund Mahindra Badhat Yojana Point 1 Bottom quartile AUM (₹382 Cr). Lower mid AUM (₹1,229 Cr). Highest AUM (₹13,294 Cr). Bottom quartile AUM (₹588 Cr). Upper mid AUM (₹6,926 Cr). Point 2 Established history (12+ yrs). Established history (11+ yrs). Established history (12+ yrs). Oldest track record among peers (20 yrs). Established history (9+ yrs). Point 3 Rating: 2★ (lower mid). Not Rated. Top rated. Rating: 4★ (upper mid). Not Rated. Point 4 Risk profile: Moderately High. Risk profile: High. Risk profile: Moderately High. Risk profile: Moderately High. Risk profile: Moderately High. Point 5 5Y return: 12.03% (bottom quartile). 5Y return: 14.20% (upper mid). 5Y return: 12.30% (bottom quartile). 5Y return: 13.57% (lower mid). 5Y return: 15.26% (top quartile). Point 6 3Y return: 22.73% (top quartile). 3Y return: 19.70% (upper mid). 3Y return: 18.62% (lower mid). 3Y return: 17.28% (bottom quartile). 3Y return: 16.88% (bottom quartile). Point 7 1Y return: 13.54% (lower mid). 1Y return: 19.64% (top quartile). 1Y return: -1.24% (bottom quartile). 1Y return: 19.34% (upper mid). 1Y return: 7.59% (bottom quartile). Point 8 Alpha: -1.07 (bottom quartile). Alpha: 0.00 (upper mid). Alpha: -7.36 (bottom quartile). Alpha: 0.00 (lower mid). Alpha: 4.46 (top quartile). Point 9 Sharpe: 1.01 (upper mid). Sharpe: 0.54 (lower mid). Sharpe: -0.74 (bottom quartile). Sharpe: 2.86 (top quartile). Sharpe: 0.01 (bottom quartile). Point 10 Information ratio: -0.53 (bottom quartile). Information ratio: 0.00 (lower mid). Information ratio: 0.53 (upper mid). Information ratio: 0.00 (bottom quartile). Information ratio: 0.64 (top quartile). IDBI Diversified Equity Fund
Aditya Birla Sun Life Manufacturing Equity Fund
Motilal Oswal Multicap 35 Fund
BNP Paribas Multi Cap Fund
Mahindra Badhat Yojana
SIP ਲੰਬੀ ਮਿਆਦ ਲਈ ਵਧੀਆ ਸੈਕਟਰ ਫੰਡ
ਸੈਕਟਰ ਫੰਡ ਦੇ ਖਾਸ ਸੈਕਟਰਾਂ ਦੀਆਂ ਪ੍ਰਤੀਭੂਤੀਆਂ ਵਿੱਚ ਨਿਵੇਸ਼ ਕਰਦਾ ਹੈਆਰਥਿਕਤਾ, ਜਿਵੇਂ ਕਿ ਟੈਲੀਕਾਮ, ਬੈਂਕਿੰਗ, FMCG, ਸੂਚਨਾ ਤਕਨਾਲੋਜੀ (IT), ਫਾਰਮਾਸਿਊਟੀਕਲ, ਅਤੇ ਬੁਨਿਆਦੀ ਢਾਂਚਾ, ਆਦਿ। ਉਦਾਹਰਨ ਲਈ, ਇੱਕ ਫਾਰਮਾ ਫੰਡ ਸਿਰਫ ਫਾਰਮਾ ਕੰਪਨੀਆਂ ਦੇ ਸਟਾਕਾਂ ਵਿੱਚ ਨਿਵੇਸ਼ ਕਰ ਸਕਦਾ ਹੈ ਅਤੇ ਇੱਕ ਬੈਂਕਿੰਗ ਸੈਕਟਰ ਫੰਡ ਬੈਂਕਾਂ ਵਿੱਚ ਨਿਵੇਸ਼ ਕਰ ਸਕਦਾ ਹੈ। ਇੱਕ ਸੈਕਟਰ-ਵਿਸ਼ੇਸ਼ ਫੰਡ ਹੋਣ ਕਰਕੇ, ਅਜਿਹੇ ਫੰਡਾਂ ਵਿੱਚ ਜੋਖਮ ਵੱਧ ਹੁੰਦਾ ਹੈ। ਇਸ ਤਰ੍ਹਾਂ, ਇੱਕ ਨਿਵੇਸ਼ਕ ਨੂੰ ਫੰਡ ਵਿੱਚ ਨਿਵੇਸ਼ ਕਰਨ ਤੋਂ ਪਹਿਲਾਂ ਖਾਸ ਸੈਕਟਰ ਬਾਰੇ ਡੂੰਘਾਈ ਨਾਲ ਜਾਣਕਾਰੀ ਹੋਣੀ ਚਾਹੀਦੀ ਹੈ।
Fund NAV Net Assets (Cr) Min SIP Investment 3 MO (%) 6 MO (%) 1 YR (%) 3 YR (%) 5 YR (%) 2025 (%) DSP Natural Resources and New Energy Fund Growth ₹105.999
↑ 0.72 ₹2,401 500 -5.9 -2.6 17.9 19.1 14.8 17.5 Aditya Birla Sun Life Banking And Financial Services Fund Growth ₹62.72
↓ -0.31 ₹3,676 1,000 2.7 -1.3 3.7 10.3 11.3 17.5 Franklin Build India Fund Growth ₹143.407
↑ 0.15 ₹3,256 500 -2.7 1.2 0.9 18.3 19.5 3.7 Sundaram Rural and Consumption Fund Growth ₹95.0311
↑ 0.30 ₹1,422 100 5.9 4.7 -2 10.7 11.7 -0.1 Bandhan Infrastructure Fund Growth ₹49.149
↓ -0.30 ₹1,545 100 0.9 7.3 -2.7 16.5 16.3 -6.9 Note: Returns up to 1 year are on absolute basis & more than 1 year are on CAGR basis. as on 29 Jul 26 Research Highlights & Commentary of 5 Funds showcased
Commentary DSP Natural Resources and New Energy Fund Aditya Birla Sun Life Banking And Financial Services Fund Franklin Build India Fund Sundaram Rural and Consumption Fund Bandhan Infrastructure Fund Point 1 Lower mid AUM (₹2,401 Cr). Highest AUM (₹3,676 Cr). Upper mid AUM (₹3,256 Cr). Bottom quartile AUM (₹1,422 Cr). Bottom quartile AUM (₹1,545 Cr). Point 2 Established history (18+ yrs). Established history (12+ yrs). Established history (16+ yrs). Oldest track record among peers (20 yrs). Established history (15+ yrs). Point 3 Top rated. Rating: 5★ (upper mid). Rating: 5★ (lower mid). Rating: 5★ (bottom quartile). Rating: 5★ (bottom quartile). Point 4 Risk profile: High. Risk profile: High. Risk profile: High. Risk profile: Moderately High. Risk profile: High. Point 5 5Y return: 14.76% (lower mid). 5Y return: 11.33% (bottom quartile). 5Y return: 19.51% (top quartile). 5Y return: 11.72% (bottom quartile). 5Y return: 16.31% (upper mid). Point 6 3Y return: 19.09% (top quartile). 3Y return: 10.35% (bottom quartile). 3Y return: 18.30% (upper mid). 3Y return: 10.66% (bottom quartile). 3Y return: 16.47% (lower mid). Point 7 1Y return: 17.85% (top quartile). 1Y return: 3.74% (upper mid). 1Y return: 0.89% (lower mid). 1Y return: -2.02% (bottom quartile). 1Y return: -2.73% (bottom quartile). Point 8 Alpha: 0.00 (upper mid). Alpha: 3.47 (top quartile). Alpha: 0.00 (lower mid). Alpha: -6.29 (bottom quartile). Alpha: 0.00 (bottom quartile). Point 9 Sharpe: 0.72 (top quartile). Sharpe: -0.06 (lower mid). Sharpe: -0.04 (upper mid). Sharpe: -0.67 (bottom quartile). Sharpe: -0.25 (bottom quartile). Point 10 Information ratio: 0.00 (upper mid). Information ratio: 0.24 (top quartile). Information ratio: 0.00 (lower mid). Information ratio: -0.56 (bottom quartile). Information ratio: 0.00 (bottom quartile). DSP Natural Resources and New Energy Fund
Aditya Birla Sun Life Banking And Financial Services Fund
Franklin Build India Fund
Sundaram Rural and Consumption Fund
Bandhan Infrastructure Fund
ਇਹ ਯਕੀਨੀ ਬਣਾਉਣ ਲਈ ਸਾਰੇ ਯਤਨ ਕੀਤੇ ਗਏ ਹਨ ਕਿ ਇੱਥੇ ਦਿੱਤੀ ਗਈ ਜਾਣਕਾਰੀ ਸਹੀ ਹੈ। ਹਾਲਾਂਕਿ, ਡੇਟਾ ਦੀ ਸ਼ੁੱਧਤਾ ਬਾਰੇ ਕੋਈ ਗਾਰੰਟੀ ਨਹੀਂ ਦਿੱਤੀ ਗਈ ਹੈ। ਕਿਰਪਾ ਕਰਕੇ ਕੋਈ ਵੀ ਨਿਵੇਸ਼ ਕਰਨ ਤੋਂ ਪਹਿਲਾਂ ਸਕੀਮ ਜਾਣਕਾਰੀ ਦਸਤਾਵੇਜ਼ ਨਾਲ ਤਸਦੀਕ ਕਰੋ।
You Might Also Like


AMFI Registration No. 112358 | CIN: U74999MH2016PTC282153
Shepard Technologies Pvt. Ltd. (with ARN code 112358) makes no warranties or representations, express or implied, on products offered through the platform. It accepts no liability for any damages or losses, however caused, in connection with the use of, or on the reliance of its product or related services. Terms and conditions of the website are applicable.
©2026 Shepard Technologies Private Limited. All Rights Reserved
Very good for young generation.