SIP Vs FD
சிறந்த முதலீட்டு விருப்பம் எது?
இடையில் தேர்ந்தெடுக்கும் போது தனிநபர்கள் எப்போதுமே கேட்ச் 22 சூழ்நிலையில் இருப்பார்கள்FD மற்றும்எஸ்ஐபி முதலீட்டிற்கு.SIP என்பது முதலீட்டு முறைபரஸ்பர நிதி இதன் மூலம் தனிநபர்கள் சீரான இடைவெளியில் சிறிய தொகைகளை டெபாசிட் செய்யலாம்.மறுபுறம், FD என்பது ஒரு முதலீட்டு வழி, அங்கு மக்கள் ஒரு குறிப்பிட்ட தொகையை ஒரு குறிப்பிட்ட காலத்திற்கு டெபாசிட் செய்து, முதிர்வு காலத்தில் அந்தத் தொகையை வட்டியுடன் திரும்பப் பெறுவார்கள்.. எனவே, எஃப்டி மற்றும் எஸ்ஐபி, எஸ்ஐபி ரிட்டர்ன் கால்குலேட்டர் ஆகியவற்றுக்கு இடையே எது சிறந்தது என்பதைப் புரிந்துகொள்வோம்,சிறந்த SIP முதலீடு செய்ய, மேலும் பல.
முறையான முதலீட்டுத் திட்டம் அல்லது SIP என்றால் என்ன?
முறையானமுதலீட்டுத் திட்டம் அல்லது SIP என்பது மியூச்சுவல் ஃபண்டுகளில் ஒரு முதலீட்டு பயன்முறையாகும், இது வழக்கமான இடைவெளியில் சிறிய தொகையை டெபாசிட் செய்ய மக்களை அனுமதிக்கிறது. SIP ஐ இலக்கு அடிப்படையிலான முதலீடு என்றும் குறிப்பிடலாம். SIP என்பது மியூச்சுவல் ஃபண்டுகளின் அழகுகளில் ஒன்றாகும், இதன் மூலம் மக்கள் தங்கள் வசதிக்கேற்ப முதலீடு செய்யலாம். SIP மூலம் மக்கள் வீடு வாங்குதல், வாகனம் வாங்குதல், உயர்கல்விக்குத் திட்டமிடுதல் மற்றும் பல போன்ற பல நோக்கங்களை அடைய திட்டமிடலாம். பல திட்டங்களில் SIP முதலீட்டு முறைகள் கிடைத்தாலும், இது பொதுவாக சூழலில் குறிப்பிடப்படுகிறதுஈக்விட்டி நிதிகள்.

மக்கள் தொடங்கலாம்SIP முதலீடு 500 ரூபாய்க்கு குறைவான தொகையுடன்.
நிலையான வைப்பு அல்லது FD என்றால் என்ன?
FD இன் நிலையான வைப்பு என்பது பொதுவாக வங்கிகள் மற்றும் வழங்கும் முதலீட்டு வழியைக் குறிக்கிறதுதபால் அலுவலகம். FD விஷயத்தில், ஒரு குறிப்பிட்ட காலக்கெடுவிற்கு ஒருமுறை செலுத்தும் தொகையாக மக்கள் கணிசமான தொகையை டெபாசிட் செய்ய வேண்டும். இங்கே, மக்கள் தங்கள் முதலீட்டுத் தொகையை பதவிக்காலத்தின் முடிவில் திரும்பப் பெறுகிறார்கள். எவ்வாறாயினும், பதவிக்காலத்தில் மக்கள் FD ஐ உடைக்க முடியாது, மேலும் அவர்கள் உடைக்க முயற்சித்தால் அவர்கள் சில கட்டணங்களை செலுத்த வேண்டும்வங்கி. FDவருமானம் முதலீட்டுக்கு வட்டி கிடைக்கும். இந்த வட்டி வருமானம் முதலீட்டாளர்களின் கைகளில் வரிக்கு உட்பட்டது.
எதை தேர்வு செய்வது?
SIP என்பது மியூச்சுவல் ஃபண்டுகளில் ஒரு முதலீட்டு பயன்முறையாக இருப்பதால், FD என்பது ஒரு முதலீட்டு வழி; இரண்டும் வெவ்வேறு குணாதிசயங்களைக் காட்டுகின்றன. எனவே, இரண்டுக்கும் இடையிலான வேறுபாடுகளைப் புரிந்துகொள்வோம்.
குறைந்தபட்ச முதலீடு
SIP முதலீட்டு முறையில் மியூச்சுவல் ஃபண்டுகளில் குறைந்தபட்ச முதலீடு தொடங்குகிறது500 ரூபாய். எனவே, இது மக்களின் பாக்கெட்டுகளை அதிகம் கிள்ளாது என்பதை உறுதி செய்ய முடியும். மேலும், SIP இன் அதிர்வெண் மக்களின் வசதிக்கு ஏற்ப மாதாந்திர அல்லது காலாண்டுக்கு அமைக்கப்படலாம். மறுபுறம், FD இல் குறைந்தபட்ச முதலீட்டுத் தொகை INR 1 க்கு இடையில் இருக்கும்,000-10,0000. FD முதலீடு லம்ப்சம் முறையில் இருப்பதால், மக்கள் அதைத் தொடர்வதில்லைமுதலீடு தொகை.
பதவிக்காலம்
ஒரு பாரம்பரிய முதலீட்டு வழியான FDகள் குறுகிய கால மற்றும் நீண்ட கால முதலீட்டிற்காக கருதப்படுகின்றன. FD இன் காலம் 6 மாதங்கள், 1 வருடம் மற்றும் 5 ஆண்டுகள் வரை இருக்கலாம். மாறாக, SIP பொதுவாக நீண்ட கால முதலீட்டிற்குத் தேர்ந்தெடுக்கப்படுகிறது. எஸ்ஐபி பொதுவாக ஈக்விட்டி ஃபண்டுகளின் சூழலில் குறிப்பிடப்படுவதால், நீண்ட கால முதலீடு அதிகபட்ச வருவாயைப் பெற உங்களுக்கு உதவும். கூடுதலாக, மக்கள் நீண்ட நேரம் வைத்திருந்தால் அதிகபட்ச நன்மைகளை அனுபவிக்க முடியும்.
திரும்புகிறது
FD மீதான வருமானம் ஒரு குறிப்பிட்ட காலத்திற்கு மாறாத வட்டி வடிவத்தில் நிலையானது. 2017-18 நிதியாண்டிற்கான, FD விகிதங்கள்சரகம் தோராயமாக 6%-7% முதலீடு ஒரு வருடத்திற்கு வைத்திருந்தால். மாறாக, SIP விஷயத்தில், வருமானம் நிலையானது அல்ல, ஏனெனில் வருமானம் அதன் செயல்திறனைப் பொறுத்தது.அடிப்படை பங்கு பங்குகள். இருப்பினும், மியூச்சுவல் ஃபண்டுகள் ஐந்தாண்டுகளுக்கு மேல் வைத்திருந்தால், 15%க்கும் அதிகமான வரலாற்று வருமானத்தை அளித்திருக்கும்.
Talk to our investment specialist
ஆபத்து பசியின்மை
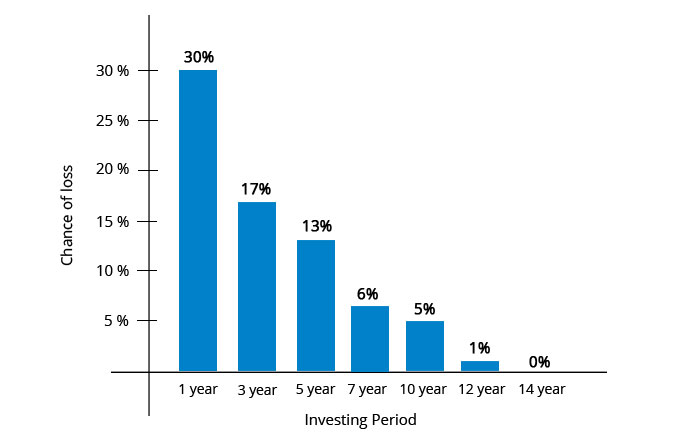
SIP உடன் ஒப்பிடும்போது FDயின் ஆபத்து-பசி குறைவாகக் கருதப்படுகிறது. FDகள் பொதுவாக வங்கிகளால் வழங்கப்படுகின்றன. மறுபுறம், திஆபத்து பசியின்மை SIP இன் FD ஐ விட அதிகம். இருப்பினும், SIP நீண்ட காலத்திற்கு வைத்திருந்தால், இழப்பின் நிகழ்தகவு குறைகிறது.
நீர்மை நிறை
திநீர்மை நிறை FD உடன் ஒப்பிடும்போது SIP இன் விஷயத்தில் அதிகம். SIP விஷயத்தில், மக்கள் தங்கள் முதலீட்டை மீட்டெடுத்தால், அவர்கள் பணத்தை திரும்பப் பெறலாம்ஈக்விட்டி ஃபண்டுகளுக்கு T+3 நாட்கள். இருப்பினும், வழக்கில்கடன் நிதி, தீர்வு காலம் ஆகும்T+1 நாட்கள். இருப்பினும், நிலையான வைப்புகளில், அதை மீட்டெடுப்பது எளிதானது அல்ல. மக்கள் முன்கூட்டியே திரும்பப் பெற முயற்சித்தாலும், அவர்கள் வங்கியில் சில கட்டணங்களைச் செலுத்த வேண்டும்.
வரிவிதிப்பு
மியூச்சுவல் ஃபண்டுகள் மற்றும் எஃப்டிகள் இரண்டிலும் வரிவிதிப்பு விதிகள் வேறுபட்டவை. FD களில், 2017-18 நிதியாண்டில், தனிநபர்களின் வழக்கமான வரி அடுக்குகளின்படி சம்பாதித்த வட்டி வசூலிக்கப்படும். இருப்பினும், எஸ்ஐபி பொதுவாக ஈக்விட்டி ஃபண்டுகளைப் பொறுத்தமட்டில் இருப்பதால், ஈக்விட்டி ஃபண்டுகள் தொடர்பான வரி விதிகள் பின்வருமாறு விளக்கப்பட்டுள்ளன.
2017-18 நிதியாண்டில், ஈக்விட்டி ஃபண்டுகள் வாங்கிய தேதியிலிருந்து ஒரு வருடத்திற்குப் பிறகு விற்கப்பட்டால், அவை நீண்ட காலத்திற்குப் பொருந்தும்.மூலதனம் வரி விதிக்கப்படாத ஆதாயங்கள். இருப்பினும், இந்த நிதிகள் வாங்கிய தேதியிலிருந்து ஒரு வருடத்திற்கு முன் விற்கப்பட்டால்; இது குறுகிய காலத்திற்கு உட்பட்டதுமூலதன ஆதாயம் a இல் வசூலிக்கப்படுகிறதுபிளாட் தனிநபரின் வரி ஸ்லாப்பைப் பொருட்படுத்தாமல் 15% விகிதம்.
சிறப்பியல்புகள்
SIP ஆனது ரூபாய் செலவு சராசரி, போன்ற பல அம்சங்களைக் கொண்டுள்ளதுகலவையின் சக்தி, மற்றும் பல, இது FD இல் கிடைக்காது. எனவே, இந்த பண்புகள் எதைக் குறிக்கின்றன என்பதைப் பார்ப்போம்.
1. ரூபாய் செலவு சராசரி
SIP வழக்கில், மக்கள்மியூச்சுவல் ஃபண்டில் முதலீடு செய்யுங்கள் சந்தைகள் வெவ்வேறு விலை நடத்தைகளைக் காட்டும் வழக்கமான காலகட்டங்களில் அலகுகள். எனவே, சந்தைகள் சரிவைக் காட்டும் போது, மக்கள் அதிக யூனிட்களை வாங்கலாம் மற்றும் நேர்மாறாகவும். எனவே, SIP காரணமாக யூனிட்களின் கொள்முதல் விலை சராசரியாக இருக்கும். எவ்வாறாயினும், எஃப்டியில், ஒரு முறை மட்டுமே தொகை டெபாசிட் செய்யப்படுவதால் இந்த அம்சம் கிடைக்காது.
2. கலப்பு சக்தி
SIP ஆனது கலவைக்கு பொருந்தும். கூட்டு வட்டி என்பது அசல் தொகை மற்றும் ஏற்கனவே திரட்டப்பட்ட வட்டியின் மீது வட்டித் தொகை கணக்கிடப்படும் கூட்டு வட்டியைக் குறிக்கிறது. FD விஷயத்தில், வட்டித் தொகையும் கூட்டுக்கு உட்பட்டது.
3. ஒழுக்கமான சேமிப்புப் பழக்கம்
சீரான இடைவெளியில் மக்கள் பணத்தை டெபாசிட் செய்ய வேண்டியிருப்பதால், SIP ஆனது தனிநபர்களிடையே ஒழுக்கமான சேமிப்புப் பழக்கத்தை உருவாக்குகிறது. மாறாக, FD இல், மக்கள் ஒருமுறை மட்டுமே பணத்தை டெபாசிட் செய்வதால், அவர்கள் ஒழுங்குபடுத்தப்பட்ட சேமிப்புப் பழக்கத்தை வளர்த்துக் கொள்ளலாம் அல்லது உருவாக்காமல் இருக்கலாம்.
கீழே கொடுக்கப்பட்டுள்ள அட்டவணை SIP மற்றும் நிலையான வைப்புகளுக்கு இடையிலான வேறுபாடுகளை சுருக்கமாகக் கூறுகிறது.
| அளவுருக்கள் | எஸ்ஐபி | நிலையான வைப்பு |
|---|---|---|
| திரும்புகிறது | ஃபண்டின் செயல்பாட்டின் படி மாறுபடும் | முன்னரே தீர்மானிக்கப்பட்டது |
| குறைந்தபட்ச முதலீடு | 500 ரூபாயில் இருந்து தொடங்குகிறது | INR 1,000 - 10,000 இடையே வரம்புகள் |
| பதவிக்காலம் | பொதுவாக நீண்ட காலத்திற்கு பயன்படுத்தப்படுகிறது | குறுகிய மற்றும் நீண்ட கால பதவிக்காலம் |
| ஆபத்து | உயர் | குறைந்த |
| நீர்மை நிறை | உயர் | குறைந்த |
| வரிவிதிப்பு | குறுகிய காலம்: 15% பிளாட் விகிதத்தில் வரி விதிக்கப்பட்டதுநீண்ட கால: வரி விதிக்கப்படவில்லை | தனிநபரின் அடுக்கு விகிதங்களின்படி வரி விதிக்கப்படுகிறது |
| அம்சங்கள் | ரூபாய் செலவு சராசரி, கூட்டு சக்தி மற்றும் ஒழுங்குபடுத்தப்பட்ட சேமிப்பு பழக்கம் | கலவையின் சக்தி |
FY 22 - 23 இல் முதலீடு செய்ய சிறந்த SIP
To seek to generate capital appreciation and provide long term growth opportunities by investing in equity and equity related securities of companies domiciled in India whose predominant economic activity is in the (a) discovery, development, production, or distribution of natural resources, viz., energy, mining etc; (b) alternative energy and energy technology sectors, with emphasis given to renewable energy, automotive and on-site power generation, energy storage and enabling energy technologies. also invest a certain portion of its corpus in the equity and equity related securities of companies domiciled overseas, which are principally engaged in the discovery, development, production or distribution of natural resources and alternative energy and/or the units shares of Merrill Lynch international Investment Funds New Energy Fund, Merrill Lynch International Investment Funds World Energy Fund and similar other overseas mutual fund schemes. Below is the key information for DSP Natural Resources and New Energy Fund Returns up to 1 year are on The primary investment objective of the Scheme is to generate long-term capital appreciation to unit holders from a portfolio that is invested predominantly in equity and equity related securities of companies engaged in banking and financial services. The Scheme does not guarantee/indicate any returns. There can be no assurance that the schemes’ objectives will be achieved. Research Highlights for Aditya Birla Sun Life Banking And Financial Services Fund Below is the key information for Aditya Birla Sun Life Banking And Financial Services Fund Returns up to 1 year are on The Scheme seeks to achieve capital appreciation by investing in companies engaged directly or indirectly in infrastructure related activities. Research Highlights for Franklin Build India Fund Below is the key information for Franklin Build India Fund Returns up to 1 year are on (Erstwhile Kotak Opportunities Scheme) To generate capital appreciation from a diversified portfolio of equity and equity
related securities. However, there is no assurance that the objective of the scheme will be realized. Research Highlights for Kotak Equity Opportunities Fund Below is the key information for Kotak Equity Opportunities Fund Returns up to 1 year are on (Erstwhile Kotak Select Focus Fund) The investment objective of the scheme is to generate long term appreciation from the portfolio of equity and equity related sectors, generally focussed on few selected sectors. Research Highlights for Kotak Standard Multicap Fund Below is the key information for Kotak Standard Multicap Fund Returns up to 1 year are on Fund NAV Net Assets (Cr) Min SIP Investment 3 MO (%) 6 MO (%) 1 YR (%) 3 YR (%) 5 YR (%) 2024 (%) DSP Natural Resources and New Energy Fund Growth ₹107.583
↓ -0.23 ₹1,765 500 11.4 20.5 33.2 23.2 21.5 17.5 Aditya Birla Sun Life Banking And Financial Services Fund Growth ₹64.83
↑ 0.21 ₹3,641 1,000 0.4 7.4 23.4 18 13 17.5 Franklin Build India Fund Growth ₹149.452
↑ 1.49 ₹3,003 500 2.3 5.3 21.1 28.1 23.9 3.7 Kotak Equity Opportunities Fund Growth ₹356.928
↑ 1.75 ₹29,991 1,000 0.7 4.4 17.9 19.9 17.3 5.6 Kotak Standard Multicap Fund Growth ₹87.925
↑ 0.42 ₹56,479 500 0 3.5 17.6 17.6 14.2 9.5 Note: Returns up to 1 year are on absolute basis & more than 1 year are on CAGR basis. as on 19 Feb 26 Research Highlights & Commentary of 5 Funds showcased
Commentary DSP Natural Resources and New Energy Fund Aditya Birla Sun Life Banking And Financial Services Fund Franklin Build India Fund Kotak Equity Opportunities Fund Kotak Standard Multicap Fund Point 1 Bottom quartile AUM (₹1,765 Cr). Lower mid AUM (₹3,641 Cr). Bottom quartile AUM (₹3,003 Cr). Upper mid AUM (₹29,991 Cr). Highest AUM (₹56,479 Cr). Point 2 Established history (17+ yrs). Established history (12+ yrs). Established history (16+ yrs). Oldest track record among peers (21 yrs). Established history (16+ yrs). Point 3 Top rated. Rating: 5★ (upper mid). Rating: 5★ (lower mid). Rating: 5★ (bottom quartile). Rating: 5★ (bottom quartile). Point 4 Risk profile: High. Risk profile: High. Risk profile: High. Risk profile: Moderately High. Risk profile: Moderately High. Point 5 5Y return: 21.51% (upper mid). 5Y return: 12.99% (bottom quartile). 5Y return: 23.93% (top quartile). 5Y return: 17.27% (lower mid). 5Y return: 14.16% (bottom quartile). Point 6 3Y return: 23.16% (upper mid). 3Y return: 18.03% (bottom quartile). 3Y return: 28.09% (top quartile). 3Y return: 19.87% (lower mid). 3Y return: 17.61% (bottom quartile). Point 7 1Y return: 33.22% (top quartile). 1Y return: 23.37% (upper mid). 1Y return: 21.11% (lower mid). 1Y return: 17.92% (bottom quartile). 1Y return: 17.61% (bottom quartile). Point 8 Alpha: 0.00 (bottom quartile). Alpha: 0.61 (lower mid). Alpha: 0.00 (bottom quartile). Alpha: 2.61 (upper mid). Alpha: 3.74 (top quartile). Point 9 Sharpe: 1.32 (top quartile). Sharpe: 1.03 (upper mid). Sharpe: 0.21 (bottom quartile). Sharpe: 0.44 (bottom quartile). Sharpe: 0.46 (lower mid). Point 10 Information ratio: 0.00 (bottom quartile). Information ratio: 0.25 (top quartile). Information ratio: 0.00 (bottom quartile). Information ratio: 0.08 (lower mid). Information ratio: 0.19 (upper mid). DSP Natural Resources and New Energy Fund
Aditya Birla Sun Life Banking And Financial Services Fund
Franklin Build India Fund
Kotak Equity Opportunities Fund
Kotak Standard Multicap Fund
1. DSP Natural Resources and New Energy Fund
DSP Natural Resources and New Energy Fund
Growth Launch Date 25 Apr 08 NAV (19 Feb 26) ₹107.583 ↓ -0.23 (-0.21 %) Net Assets (Cr) ₹1,765 on 31 Jan 26 Category Equity - Sectoral AMC DSP BlackRock Invmt Managers Pvt. Ltd. Rating ☆☆☆☆☆ Risk High Expense Ratio 1.99 Sharpe Ratio 1.32 Information Ratio 0 Alpha Ratio 0 Min Investment 1,000 Min SIP Investment 500 Exit Load 0-12 Months (1%),12 Months and above(NIL) Growth of 10,000 investment over the years.
Date Value 31 Jan 21 ₹10,000 31 Jan 22 ₹14,714 31 Jan 23 ₹16,147 31 Jan 24 ₹21,748 31 Jan 25 ₹23,125 31 Jan 26 ₹29,537 Returns for DSP Natural Resources and New Energy Fund
absolute basis & more than 1 year are on CAGR (Compound Annual Growth Rate) basis. as on 19 Feb 26 Duration Returns 1 Month 5.5% 3 Month 11.4% 6 Month 20.5% 1 Year 33.2% 3 Year 23.2% 5 Year 21.5% 10 Year 15 Year Since launch 14.3% Historical performance (Yearly) on absolute basis
Year Returns 2024 17.5% 2023 13.9% 2022 31.2% 2021 9.8% 2020 42.8% 2019 11.5% 2018 4.4% 2017 -15.3% 2016 43.1% 2015 43.1% Fund Manager information for DSP Natural Resources and New Energy Fund
Name Since Tenure Rohit Singhania 1 Jul 12 13.6 Yr. Data below for DSP Natural Resources and New Energy Fund as on 31 Jan 26
Equity Sector Allocation
Sector Value Energy 42.96% Basic Materials 36.91% Utility 7.36% Industrials 1.62% Technology 1.28% Consumer Cyclical 0.11% Asset Allocation
Asset Class Value Cash 9.76% Equity 90.24% Debt 0% Top Securities Holdings / Portfolio
Name Holding Value Quantity BGF World Energy I2
Investment Fund | -11% ₹192 Cr 602,478
↑ 214,175 Oil & Natural Gas Corp Ltd (Energy)
Equity, Since 31 May 20 | ONGC9% ₹159 Cr 5,905,732
↑ 107,567 Jindal Steel Ltd (Basic Materials)
Equity, Since 31 Mar 20 | JINDALSTEL9% ₹154 Cr 1,356,666 Tata Steel Ltd (Basic Materials)
Equity, Since 31 Aug 16 | TATASTEEL9% ₹153 Cr 7,896,586 Oil India Ltd (Energy)
Equity, Since 29 Feb 24 | OIL6% ₹100 Cr 1,954,429
↑ 363,081 National Aluminium Co Ltd (Basic Materials)
Equity, Since 28 Feb 22 | NATIONALUM5% ₹94 Cr 2,439,055 BGF Sustainable Energy I2
Investment Fund | -5% ₹80 Cr 330,203 Coal India Ltd (Energy)
Equity, Since 31 Mar 22 | COALINDIA4% ₹68 Cr 1,533,115 Hindalco Industries Ltd (Basic Materials)
Equity, Since 31 Oct 15 | HINDALCO4% ₹67 Cr 691,612
↓ -127,079 Petronet LNG Ltd (Energy)
Equity, Since 31 Jan 18 | PETRONET4% ₹63 Cr 2,180,366
↓ -116,682 2. Aditya Birla Sun Life Banking And Financial Services Fund
Aditya Birla Sun Life Banking And Financial Services Fund
Growth Launch Date 14 Dec 13 NAV (20 Feb 26) ₹64.83 ↑ 0.21 (0.32 %) Net Assets (Cr) ₹3,641 on 31 Jan 26 Category Equity - Sectoral AMC Birla Sun Life Asset Management Co Ltd Rating ☆☆☆☆☆ Risk High Expense Ratio 1.99 Sharpe Ratio 1.03 Information Ratio 0.25 Alpha Ratio 0.61 Min Investment 1,000 Min SIP Investment 1,000 Exit Load 0-365 Days (1%),365 Days and above(NIL) Growth of 10,000 investment over the years.
Date Value 31 Jan 21 ₹10,000 31 Jan 22 ₹12,928 31 Jan 23 ₹13,061 31 Jan 24 ₹16,628 31 Jan 25 ₹17,605 31 Jan 26 ₹21,057 Returns for Aditya Birla Sun Life Banking And Financial Services Fund
absolute basis & more than 1 year are on CAGR (Compound Annual Growth Rate) basis. as on 19 Feb 26 Duration Returns 1 Month 2.2% 3 Month 0.4% 6 Month 7.4% 1 Year 23.4% 3 Year 18% 5 Year 13% 10 Year 15 Year Since launch 16.6% Historical performance (Yearly) on absolute basis
Year Returns 2024 17.5% 2023 8.7% 2022 21.7% 2021 11.5% 2020 16.8% 2019 1.1% 2018 14.9% 2017 -2.4% 2016 47.6% 2015 15.7% Fund Manager information for Aditya Birla Sun Life Banking And Financial Services Fund
Name Since Tenure Dhaval Gala 26 Aug 15 10.44 Yr. Data below for Aditya Birla Sun Life Banking And Financial Services Fund as on 31 Jan 26
Equity Sector Allocation
Sector Value Financial Services 94.64% Technology 1% Asset Allocation
Asset Class Value Cash 4.36% Equity 95.64% Top Securities Holdings / Portfolio
Name Holding Value Quantity ICICI Bank Ltd (Financial Services)
Equity, Since 31 Dec 13 | ICICIBANK14% ₹504 Cr 3,717,929
↓ -960,000 HDFC Bank Ltd (Financial Services)
Equity, Since 31 Dec 13 | HDFCBANK14% ₹503 Cr 5,408,496 Axis Bank Ltd (Financial Services)
Equity, Since 31 Oct 18 | AXISBANK9% ₹315 Cr 2,302,100 State Bank of India (Financial Services)
Equity, Since 31 Oct 17 | SBIN6% ₹207 Cr 1,918,689 Bajaj Finance Ltd (Financial Services)
Equity, Since 30 Sep 16 | BAJFINANCE5% ₹199 Cr 2,137,250 Kotak Mahindra Bank Ltd (Financial Services)
Equity, Since 31 Jan 19 | KOTAKBANK4% ₹145 Cr 3,546,665 AU Small Finance Bank Ltd (Financial Services)
Equity, Since 30 Nov 23 | AUBANK4% ₹132 Cr 1,346,861 Shriram Finance Ltd (Financial Services)
Equity, Since 30 Jun 23 | SHRIRAMFIN3% ₹122 Cr 1,198,382 ICICI Lombard General Insurance Co Ltd (Financial Services)
Equity, Since 30 Sep 19 | ICICIGI3% ₹103 Cr 565,076 Billionbrains Garage Ventures Ltd (Financial Services)
Equity, Since 30 Nov 25 | GROWW2% ₹91 Cr 5,134,395 3. Franklin Build India Fund
Franklin Build India Fund
Growth Launch Date 4 Sep 09 NAV (20 Feb 26) ₹149.452 ↑ 1.49 (1.00 %) Net Assets (Cr) ₹3,003 on 31 Jan 26 Category Equity - Sectoral AMC Franklin Templeton Asst Mgmt(IND)Pvt Ltd Rating ☆☆☆☆☆ Risk High Expense Ratio 2.01 Sharpe Ratio 0.21 Information Ratio 0 Alpha Ratio 0 Min Investment 5,000 Min SIP Investment 500 Exit Load 0-1 Years (1%),1 Years and above(NIL) Growth of 10,000 investment over the years.
Date Value 31 Jan 21 ₹10,000 31 Jan 22 ₹14,734 31 Jan 23 ₹15,797 31 Jan 24 ₹25,867 31 Jan 25 ₹29,250 31 Jan 26 ₹31,672 Returns for Franklin Build India Fund
absolute basis & more than 1 year are on CAGR (Compound Annual Growth Rate) basis. as on 19 Feb 26 Duration Returns 1 Month 8.9% 3 Month 2.3% 6 Month 5.3% 1 Year 21.1% 3 Year 28.1% 5 Year 23.9% 10 Year 15 Year Since launch 17.9% Historical performance (Yearly) on absolute basis
Year Returns 2024 3.7% 2023 27.8% 2022 51.1% 2021 11.2% 2020 45.9% 2019 5.4% 2018 6% 2017 -10.7% 2016 43.3% 2015 8.4% Fund Manager information for Franklin Build India Fund
Name Since Tenure Ajay Argal 18 Oct 21 4.29 Yr. Kiran Sebastian 7 Feb 22 3.99 Yr. Sandeep Manam 18 Oct 21 4.29 Yr. Data below for Franklin Build India Fund as on 31 Jan 26
Equity Sector Allocation
Sector Value Industrials 33.81% Financial Services 16.07% Utility 14.48% Energy 13.67% Communication Services 8.08% Basic Materials 5.58% Real Estate 2.64% Consumer Cyclical 1.25% Technology 1.16% Asset Allocation
Asset Class Value Cash 3.26% Equity 96.74% Top Securities Holdings / Portfolio
Name Holding Value Quantity Larsen & Toubro Ltd (Industrials)
Equity, Since 29 Feb 20 | LT9% ₹261 Cr 665,000 Oil & Natural Gas Corp Ltd (Energy)
Equity, Since 30 Jun 19 | ONGC6% ₹184 Cr 6,825,000 Reliance Industries Ltd (Energy)
Equity, Since 31 Oct 21 | RELIANCE6% ₹176 Cr 1,260,000
↑ 60,000 InterGlobe Aviation Ltd (Industrials)
Equity, Since 29 Feb 20 | INDIGO5% ₹161 Cr 350,000
↑ 24,659 NTPC Ltd (Utilities)
Equity, Since 30 Nov 16 | NTPC5% ₹142 Cr 3,978,727
↓ -371,273 Bharti Airtel Ltd (Communication Services)
Equity, Since 30 Sep 09 | BHARTIARTL5% ₹140 Cr 710,000 HDFC Bank Ltd (Financial Services)
Equity, Since 31 Oct 25 | HDFCBANK5% ₹139 Cr 1,500,000 Axis Bank Ltd (Financial Services)
Equity, Since 31 Mar 12 | AXISBANK5% ₹137 Cr 1,000,000 State Bank of India (Financial Services)
Equity, Since 31 Jul 14 | SBIN4% ₹108 Cr 1,000,000 REC Ltd (Financial Services)
Equity, Since 30 Sep 25 | RECLTD3% ₹98 Cr 2,700,000
↑ 400,000 4. Kotak Equity Opportunities Fund
Kotak Equity Opportunities Fund
Growth Launch Date 9 Sep 04 NAV (20 Feb 26) ₹356.928 ↑ 1.75 (0.49 %) Net Assets (Cr) ₹29,991 on 31 Jan 26 Category Equity - Large & Mid Cap AMC Kotak Mahindra Asset Management Co Ltd Rating ☆☆☆☆☆ Risk Moderately High Expense Ratio 1.6 Sharpe Ratio 0.44 Information Ratio 0.08 Alpha Ratio 2.61 Min Investment 5,000 Min SIP Investment 1,000 Exit Load 0-1 Years (1%),1 Years and above(NIL) Growth of 10,000 investment over the years.
Date Value 31 Jan 21 ₹10,000 31 Jan 22 ₹13,212 31 Jan 23 ₹13,754 31 Jan 24 ₹18,432 31 Jan 25 ₹21,134 31 Jan 26 ₹23,581 Returns for Kotak Equity Opportunities Fund
absolute basis & more than 1 year are on CAGR (Compound Annual Growth Rate) basis. as on 19 Feb 26 Duration Returns 1 Month 3.6% 3 Month 0.7% 6 Month 4.4% 1 Year 17.9% 3 Year 19.9% 5 Year 17.3% 10 Year 15 Year Since launch 18.1% Historical performance (Yearly) on absolute basis
Year Returns 2024 5.6% 2023 24.2% 2022 29.3% 2021 7% 2020 30.4% 2019 16.5% 2018 13.2% 2017 -5.6% 2016 34.9% 2015 9.6% Fund Manager information for Kotak Equity Opportunities Fund
Name Since Tenure Harsha Upadhyaya 4 Aug 12 13.5 Yr. Data below for Kotak Equity Opportunities Fund as on 31 Jan 26
Equity Sector Allocation
Sector Value Financial Services 29.59% Industrials 16.54% Consumer Cyclical 12.56% Basic Materials 11.94% Technology 7.29% Health Care 7.15% Energy 5.31% Communication Services 2.92% Utility 2.4% Consumer Defensive 1.48% Real Estate 0.8% Asset Allocation
Asset Class Value Cash 0.99% Equity 99.01% Other 0% Top Securities Holdings / Portfolio
Name Holding Value Quantity HDFC Bank Ltd (Financial Services)
Equity, Since 31 Jul 23 | HDFCBANK6% ₹1,812 Cr 19,500,000 State Bank of India (Financial Services)
Equity, Since 28 Feb 21 | SBIN4% ₹1,346 Cr 12,500,000 Bharat Electronics Ltd (Industrials)
Equity, Since 31 Oct 18 | BEL4% ₹1,257 Cr 28,000,000 Eternal Ltd (Consumer Cyclical)
Equity, Since 31 Aug 23 | 5433203% ₹958 Cr 35,000,000 ICICI Bank Ltd (Financial Services)
Equity, Since 30 Sep 10 | ICICIBANK3% ₹949 Cr 7,000,000 Infosys Ltd (Technology)
Equity, Since 31 Jan 09 | INFY3% ₹875 Cr 5,330,405 Axis Bank Ltd (Financial Services)
Equity, Since 31 Oct 12 | AXISBANK3% ₹850 Cr 6,200,000 Coromandel International Ltd (Basic Materials)
Equity, Since 30 Nov 16 | COROMANDEL2% ₹742 Cr 3,250,001 Larsen & Toubro Ltd (Industrials)
Equity, Since 30 Sep 13 | LT2% ₹727 Cr 1,850,000 Bharti Airtel Ltd (Communication Services)
Equity, Since 28 Feb 21 | BHARTIARTL2% ₹719 Cr 3,650,000 5. Kotak Standard Multicap Fund
Kotak Standard Multicap Fund
Growth Launch Date 11 Sep 09 NAV (20 Feb 26) ₹87.925 ↑ 0.42 (0.48 %) Net Assets (Cr) ₹56,479 on 31 Jan 26 Category Equity - Multi Cap AMC Kotak Mahindra Asset Management Co Ltd Rating ☆☆☆☆☆ Risk Moderately High Expense Ratio 1.47 Sharpe Ratio 0.46 Information Ratio 0.19 Alpha Ratio 3.74 Min Investment 5,000 Min SIP Investment 500 Exit Load 0-1 Years (1%),1 Years and above(NIL) Growth of 10,000 investment over the years.
Date Value 31 Jan 21 ₹10,000 31 Jan 22 ₹12,702 31 Jan 23 ₹12,928 31 Jan 24 ₹16,503 31 Jan 25 ₹18,677 31 Jan 26 ₹20,915 Returns for Kotak Standard Multicap Fund
absolute basis & more than 1 year are on CAGR (Compound Annual Growth Rate) basis. as on 19 Feb 26 Duration Returns 1 Month 3% 3 Month 0% 6 Month 3.5% 1 Year 17.6% 3 Year 17.6% 5 Year 14.2% 10 Year 15 Year Since launch 14.1% Historical performance (Yearly) on absolute basis
Year Returns 2024 9.5% 2023 16.5% 2022 24.2% 2021 5% 2020 25.4% 2019 11.8% 2018 12.3% 2017 -0.9% 2016 34.3% 2015 9.4% Fund Manager information for Kotak Standard Multicap Fund
Name Since Tenure Harsha Upadhyaya 4 Aug 12 13.5 Yr. Data below for Kotak Standard Multicap Fund as on 31 Jan 26
Equity Sector Allocation
Sector Value Financial Services 29.69% Industrials 18.37% Basic Materials 14.81% Consumer Cyclical 11.1% Technology 7.13% Energy 5.9% Utility 3.15% Communication Services 3% Health Care 2.65% Consumer Defensive 2.14% Asset Allocation
Asset Class Value Cash 2.05% Equity 97.95% Other 0% Top Securities Holdings / Portfolio
Name Holding Value Quantity HDFC Bank Ltd (Financial Services)
Equity, Since 31 Dec 10 | HDFCBANK6% ₹3,671 Cr 39,500,000 Bharat Electronics Ltd (Industrials)
Equity, Since 31 Aug 14 | BEL6% ₹3,592 Cr 80,000,000 ICICI Bank Ltd (Financial Services)
Equity, Since 30 Sep 10 | ICICIBANK5% ₹2,981 Cr 22,000,000 State Bank of India (Financial Services)
Equity, Since 31 Jan 12 | SBIN5% ₹2,564 Cr 23,800,000 Axis Bank Ltd (Financial Services)
Equity, Since 31 May 12 | AXISBANK4% ₹2,193 Cr 16,000,000 Jindal Steel Ltd (Basic Materials)
Equity, Since 31 Mar 18 | JINDALSTEL4% ₹2,151 Cr 19,000,000 Larsen & Toubro Ltd (Industrials)
Equity, Since 30 Sep 13 | LT4% ₹2,084 Cr 5,300,000 SRF Ltd (Industrials)
Equity, Since 31 Dec 18 | SRF3% ₹1,760 Cr 6,250,000 Eternal Ltd (Consumer Cyclical)
Equity, Since 31 Aug 23 | 5433203% ₹1,751 Cr 64,000,000 UltraTech Cement Ltd (Basic Materials)
Equity, Since 31 Mar 14 | ULTRACEMCO3% ₹1,745 Cr 1,375,000
SIP ரிட்டர்ன் கால்குலேட்டர்
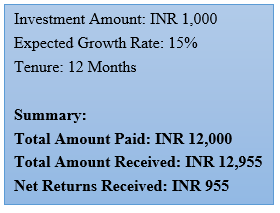
SIP இன் வருமானம் மாறுபடும். இருப்பினும், வரலாற்று வருவாய் விகிதம் 15% என்று வைத்துக் கொண்டால், 12 மாதங்களில் INR 1,000 இன் SIP முதலீடு எவ்வாறு வளர்கிறது என்பதைப் பார்ப்போம்.
FD கால்குலேட்டர்
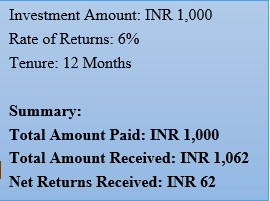
FD விகிதங்களும் வங்கிக்கு வங்கிகள் மாறுபடும். இருப்பினும், வட்டி விகிதம் 6% என்று வைத்துக் கொண்டால், முதலீட்டுத் தொகை INR 1,000 ஆக இருந்தால், 12 மாதங்களில் FD எவ்வாறு செயல்படும் என்பதைப் பார்ப்போம்.
MF SIP ஆன்லைனில் எப்படி முதலீடு செய்வது?
Fincash.com இல் வாழ்நாள் முழுவதும் இலவச முதலீட்டுக் கணக்கைத் திறக்கவும்.
உங்கள் பதிவு மற்றும் KYC செயல்முறையை முடிக்கவும்
ஆவணங்களைப் பதிவேற்றவும் (PAN, ஆதார் போன்றவை).மேலும், நீங்கள் முதலீடு செய்ய தயாராக உள்ளீர்கள்!
முடிவு: SIP அல்லது FD
முடிவுக்கு, FD உடன் ஒப்பிடும்போது SIP அதிக நன்மைகளைக் கொண்டுள்ளது என்று கூறலாம். இருப்பினும், முதலீடு செய்வதற்கு முன், திட்டத்தின் செயல்பாட்டை முழுமையாகப் புரிந்து கொள்ள வேண்டும் என்று மக்களுக்கு எப்போதும் அறிவுறுத்தப்படுகிறது. கூடுதலாக, அவர்கள் ஒரு தனிப்பட்ட ஆலோசனை கூட முடியும்நிதி ஆலோசகர் அவர்களின் முதலீடு பாதுகாப்பானது மற்றும் அவர்களின் நோக்கங்கள் பூர்த்தி செய்யப்படுவதை உறுதி செய்ய.
இங்கு வழங்கப்பட்ட தகவல்கள் துல்லியமானவை என்பதை உறுதிப்படுத்த அனைத்து முயற்சிகளும் மேற்கொள்ளப்பட்டுள்ளன. இருப்பினும், தரவின் சரியான தன்மை குறித்து எந்த உத்தரவாதமும் அளிக்கப்படவில்லை. முதலீடு செய்வதற்கு முன் திட்டத் தகவல் ஆவணத்துடன் சரிபார்க்கவும்.



Research Highlights for DSP Natural Resources and New Energy Fund