بہترین مالیاتی میوچل فنڈز 2022
ایک مالیاتیباہمی چندہ سیکٹر کا حصہ ہیں۔ایکویٹی فنڈز. ان فنڈز کو 'بینکنگ اینڈ فنانشل سروسز فنڈ' کے نام سے بھی جانا جاتا ہے۔ ان فنڈز کا مقصد پیدا کرنا ہے۔آمدنی کی طرف سےسرمایہ کاری بینکنگ سیکٹر اور مالیاتی صنعت کو پورا کرنے والی کمپنیوں کے اسٹاک/حصص میں۔ لہذا، آئیے سرمایہ کاری کے لیے بہترین مالیاتی میوچل فنڈز کے ساتھ ساتھ مالیاتی فنڈز کی مستقبل کی صلاحیت کو سمجھیں۔
Talk to our investment specialist
ہندوستان میں مالیاتی باہمی فنڈز
اگر ہم جولائی 2017 کے جاری کردہ اعداد و شمار پر نظر ڈالیں۔SEBI، بینکنگ اورسیکٹر فنڈز سب سے زیادہ پسندیدہ تھے. اعداد و شمار سے پتہ چلتا ہے کہبینک اور فنانس- دو سرکردہ شعبوں نے شیئر AUM میں زبردست اضافہ دکھایا ہے۔
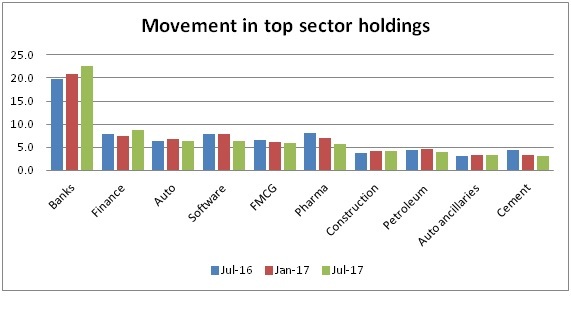
جولائی 17 کے اعدادوشمار کے مطابق، بینکنگ سیکٹر کی اے یو ایم، جو کہ سرفہرست سیکٹر ہے، صرف چھ ماہ میں 20.9 فیصد سے بڑھ کر 22.6 فیصد ہو گئی ہے۔
فنانشل میوچل فنڈز میں آن لائن سرمایہ کاری کیسے کی جائے؟
Fincash.com پر لائف ٹائم کے لیے مفت انویسٹمنٹ اکاؤنٹ کھولیں۔
اپنی رجسٹریشن اور KYC کا عمل مکمل کریں۔
دستاویزات اپ لوڈ کریں (PAN، آدھار، وغیرہ)۔اور، آپ سرمایہ کاری کے لیے تیار ہیں!
اعلی کارکردگی کا مظاہرہ کرنے والے بہترین مالیاتی میوچل فنڈز FY 22 - 23
Fund NAV Net Assets (Cr) 3 MO (%) 6 MO (%) 1 YR (%) 3 YR (%) 5 YR (%) 2024 (%) Aditya Birla Sun Life Banking And Financial Services Fund Growth ₹62.72
↓ -0.31 ₹3,676 2.3 -1.1 4.4 10.5 11.3 17.5 ICICI Prudential Banking and Financial Services Fund Growth ₹130.46
↓ -0.44 ₹11,034 1.9 -4.1 -2.3 9.3 9.7 15.9 Invesco India Financial Services Fund Growth ₹146.33
↓ -0.70 ₹1,811 3.6 -0.5 6.4 17.1 14.5 15.1 Sundaram Financial Services Opportunities Fund Growth ₹107.036
↓ -0.74 ₹1,681 2.3 -2.9 4.3 12.3 13.8 16.9 UTI Banking and Financial Services Fund Growth ₹195.286
↓ -0.36 ₹1,430 3.7 -2.5 4 12.2 12 16.3 Note: Returns up to 1 year are on absolute basis & more than 1 year are on CAGR basis. as on 30 Jul 26 Research Highlights & Commentary of 5 Funds showcased
Commentary Aditya Birla Sun Life Banking And Financial Services Fund ICICI Prudential Banking and Financial Services Fund Invesco India Financial Services Fund Sundaram Financial Services Opportunities Fund UTI Banking and Financial Services Fund Point 1 Upper mid AUM (₹3,676 Cr). Highest AUM (₹11,034 Cr). Lower mid AUM (₹1,811 Cr). Bottom quartile AUM (₹1,681 Cr). Bottom quartile AUM (₹1,430 Cr). Point 2 Established history (12+ yrs). Established history (17+ yrs). Established history (18+ yrs). Established history (18+ yrs). Oldest track record among peers (22 yrs). Point 3 Top rated. Rating: 5★ (upper mid). Rating: 4★ (lower mid). Rating: 3★ (bottom quartile). Rating: 3★ (bottom quartile). Point 4 Risk profile: High. Risk profile: High. Risk profile: High. Risk profile: High. Risk profile: High. Point 5 5Y return: 11.27% (bottom quartile). 5Y return: 9.73% (bottom quartile). 5Y return: 14.47% (top quartile). 5Y return: 13.82% (upper mid). 5Y return: 12.04% (lower mid). Point 6 3Y return: 10.53% (bottom quartile). 3Y return: 9.30% (bottom quartile). 3Y return: 17.13% (top quartile). 3Y return: 12.25% (upper mid). 3Y return: 12.15% (lower mid). Point 7 1Y return: 4.37% (upper mid). 1Y return: -2.31% (bottom quartile). 1Y return: 6.35% (top quartile). 1Y return: 4.33% (lower mid). 1Y return: 4.02% (bottom quartile). Point 8 Alpha: 3.47 (lower mid). Alpha: -2.76 (bottom quartile). Alpha: 4.90 (top quartile). Alpha: 3.51 (upper mid). Alpha: 1.61 (bottom quartile). Point 9 Sharpe: -0.06 (upper mid). Sharpe: -0.36 (bottom quartile). Sharpe: 0.03 (top quartile). Sharpe: -0.07 (lower mid). Sharpe: -0.14 (bottom quartile). Point 10 Information ratio: 0.24 (bottom quartile). Information ratio: -0.10 (bottom quartile). Information ratio: 0.95 (top quartile). Information ratio: 0.51 (upper mid). Information ratio: 0.35 (lower mid). Aditya Birla Sun Life Banking And Financial Services Fund
ICICI Prudential Banking and Financial Services Fund
Invesco India Financial Services Fund
Sundaram Financial Services Opportunities Fund
UTI Banking and Financial Services Fund
جب ہم ہندوستان کے بینکنگ اور فنانس سیکٹر کے بارے میں بات کرتے ہیں تو ہمارے پاس بہت سے بڑے کھلاڑی ہیں۔آئی سی آئی سی آئی بینک لمیٹڈ، ایچ ڈی ایف سی بینک لمیٹڈ، اسٹیٹ بینک آف انڈیا، یس بینک لمیٹڈ، ایکسس بینک لمیٹڈ، وغیرہ۔ ہندوستانی بینکنگ سسٹم 26 نجی شعبے کے بینکوں، 27 پبلک سیکٹر کے بینکوں، 1,574 شہری کوآپریٹو بینکوں، 56 علاقائی دیہی بینکوں، 46 غیر ملکی بینکوں پر مشتمل ہے۔ اور کوآپریٹو کریڈٹ اداروں کے علاوہ 93,913 دیہی کوآپریٹو بینک۔
وہ کمپنیاں جو بینکنگ اور مالیاتی صنعت کے اندر کام کرتی ہیں انتہائی منظم ہیں۔ بہت سی اچھی کمپنیاں سالوں میں مسلسل کارکردگی اور منافع فراہم کرنے کا مقصد رکھتی ہیں، نتیجتاً، یہ ان سرمایہ کاروں کے لیے اعتماد پیدا کرتی ہے جو سیکٹر فنڈز میں سرمایہ کاری کرنے کا منصوبہ بنا رہے ہیں۔ تاہم، ایسے فنڈز کے خطرے کے عوامل کو ہمیشہ ذہن میں رکھنا چاہیے۔ یہ فنڈز، بعض اوقات، دو انتہاؤں پر ہو سکتے ہیں، یہ اچھے منافع فراہم کر سکتے ہیں اور بعض اوقات بری کارکردگی کا مظاہرہ بھی کر سکتے ہیں۔ اس لیے یہ مشورہ دیا جاتا ہے کہ ایسے سرمایہ کار جو اس طرح کے سیکٹر فنڈز میں سرمایہ کاری کرنے کا ارادہ رکھتے ہیں، ان کے پاس اعلیخطرے کی بھوک اور طویل مدت تک سرمایہ کاری میں رہنا چاہیے۔ مثالی طور پر، تنوع کے مقصد کے لیے ایسے فنڈز میں سرمایہ کاری کرنی چاہیے۔
The primary investment objective of the Scheme is to generate long-term capital appreciation to unit holders from a portfolio that is invested predominantly in equity and equity related securities of companies engaged in banking and financial services. The Scheme does not guarantee/indicate any returns. There can be no assurance that the schemes’ objectives will be achieved. Below is the key information for Aditya Birla Sun Life Banking And Financial Services Fund Returns up to 1 year are on ICICI Prudential Banking and Financial Services Fund is an Open-ended equity scheme that seeks to generate long-term capital appreciation to unitholders from a portfolio that is invested predominantly in equity and equity related securities of companies engaged in banking and financial services. However, there can be no assurance that the investment objective of the Scheme will be realized. Research Highlights for ICICI Prudential Banking and Financial Services Fund Below is the key information for ICICI Prudential Banking and Financial Services Fund Returns up to 1 year are on (Erstwhile Invesco India Banking Fund) The investment objective of the Scheme is to generate long-term capital growth from a portfolio of equity and equity-related securities of companies engaged in the business of banking and financial services. Research Highlights for Invesco India Financial Services Fund Below is the key information for Invesco India Financial Services Fund Returns up to 1 year are on Seek capital appreciation by investing predominantly in equity and equity related securities of indian companies engaged in banking and financial Services. Research Highlights for Sundaram Financial Services Opportunities Fund Below is the key information for Sundaram Financial Services Opportunities Fund Returns up to 1 year are on (Erstwhile UTI Banking Sector Fund) Investment objective is "capital appreciation" through investments in the stocks of the companies/institutions engaged in the banking and financial services activities. Research Highlights for UTI Banking and Financial Services Fund Below is the key information for UTI Banking and Financial Services Fund Returns up to 1 year are on 1. Aditya Birla Sun Life Banking And Financial Services Fund
Aditya Birla Sun Life Banking And Financial Services Fund
Growth Launch Date 14 Dec 13 NAV (30 Jul 26) ₹62.72 ↓ -0.31 (-0.49 %) Net Assets (Cr) ₹3,676 on 30 Jun 26 Category Equity - Sectoral AMC Birla Sun Life Asset Management Co Ltd Rating ☆☆☆☆☆ Risk High Expense Ratio 1.99 Sharpe Ratio -0.06 Information Ratio 0.24 Alpha Ratio 3.47 Min Investment 1,000 Min SIP Investment 1,000 Exit Load 0-365 Days (1%),365 Days and above(NIL) Growth of 10,000 investment over the years.
Date Value 30 Jun 21 ₹10,000 30 Jun 22 ₹9,160 30 Jun 23 ₹12,518 30 Jun 24 ₹15,626 30 Jun 25 ₹17,373 30 Jun 26 ₹17,691 Returns for Aditya Birla Sun Life Banking And Financial Services Fund
absolute basis & more than 1 year are on CAGR (Compound Annual Growth Rate) basis. as on 30 Jul 26 Duration Returns 1 Month -0.8% 3 Month 2.3% 6 Month -1.1% 1 Year 4.4% 3 Year 10.5% 5 Year 11.3% 10 Year 15 Year Since launch 15.7% Historical performance (Yearly) on absolute basis
Year Returns 2024 17.5% 2023 8.7% 2022 21.7% 2021 11.5% 2020 16.8% 2019 1.1% 2018 14.9% 2017 -2.4% 2016 47.6% 2015 15.7% Fund Manager information for Aditya Birla Sun Life Banking And Financial Services Fund
Name Since Tenure Dhaval Gala 26 Aug 15 10.85 Yr. Data below for Aditya Birla Sun Life Banking And Financial Services Fund as on 30 Jun 26
Equity Sector Allocation
Sector Value Financial Services 95.86% Technology 1.2% Asset Allocation
Asset Class Value Cash 2.2% Equity 97.8% Top Securities Holdings / Portfolio
Name Holding Value Quantity ICICI Bank Ltd (Financial Services)
Equity, Since 31 Dec 13 | ICICIBANK13% ₹467 Cr 3,717,929 HDFC Bank Ltd (Financial Services)
Equity, Since 31 Dec 13 | HDFCBANK11% ₹377 Cr 5,058,496
↓ -350,000 Axis Bank Ltd (Financial Services)
Equity, Since 31 Oct 18 | AXISBANK9% ₹296 Cr 2,302,100 Bajaj Finance Ltd (Financial Services)
Equity, Since 30 Sep 16 | BAJFINANCE6% ₹194 Cr 2,137,250 State Bank of India (Financial Services)
Equity, Since 31 Oct 17 | SBIN5% ₹185 Cr 1,918,689 Shriram Finance Ltd (Financial Services)
Equity, Since 30 Jun 23 | SHRIRAMFIN5% ₹179 Cr 1,886,669 Kotak Mahindra Bank Ltd (Financial Services)
Equity, Since 31 Jan 19 | KOTAKBANK4% ₹129 Cr 3,346,665
↓ -200,000 AU Small Finance Bank Ltd (Financial Services)
Equity, Since 30 Nov 23 | AUBANK3% ₹103 Cr 1,046,861
↓ -300,000 Bank of Maharashtra (Financial Services)
Equity, Since 31 Dec 25 | MAHABANK3% ₹99 Cr 12,546,499 SBI Life Insurance Co Ltd (Financial Services)
Equity, Since 31 Mar 21 | SBILIFE3% ₹98 Cr 533,402 2. ICICI Prudential Banking and Financial Services Fund
ICICI Prudential Banking and Financial Services Fund
Growth Launch Date 22 Aug 08 NAV (30 Jul 26) ₹130.46 ↓ -0.44 (-0.34 %) Net Assets (Cr) ₹11,034 on 30 Jun 26 Category Equity - Sectoral AMC ICICI Prudential Asset Management Company Limited Rating ☆☆☆☆☆ Risk High Expense Ratio 1.83 Sharpe Ratio -0.36 Information Ratio -0.1 Alpha Ratio -2.76 Min Investment 5,000 Min SIP Investment 100 Exit Load 0-1 Years (1%),1 Years and above(NIL) Growth of 10,000 investment over the years.
Date Value 30 Jun 21 ₹10,000 30 Jun 22 ₹9,325 30 Jun 23 ₹12,216 30 Jun 24 ₹14,832 30 Jun 25 ₹17,040 30 Jun 26 ₹16,453 Returns for ICICI Prudential Banking and Financial Services Fund
absolute basis & more than 1 year are on CAGR (Compound Annual Growth Rate) basis. as on 30 Jul 26 Duration Returns 1 Month -1% 3 Month 1.9% 6 Month -4.1% 1 Year -2.3% 3 Year 9.3% 5 Year 9.7% 10 Year 15 Year Since launch 15.4% Historical performance (Yearly) on absolute basis
Year Returns 2024 15.9% 2023 11.6% 2022 17.9% 2021 11.9% 2020 23.5% 2019 -5.5% 2018 14.5% 2017 -0.4% 2016 45.1% 2015 21.1% Fund Manager information for ICICI Prudential Banking and Financial Services Fund
Name Since Tenure Sharmila D'Silva 30 Jun 22 4 Yr. Antariksha Banerjee 2 Mar 26 0.33 Yr. Data below for ICICI Prudential Banking and Financial Services Fund as on 30 Jun 26
Equity Sector Allocation
Sector Value Financial Services 93.69% Health Care 1% Industrials 0.29% Asset Allocation
Asset Class Value Cash 5.03% Equity 94.97% Top Securities Holdings / Portfolio
Name Holding Value Quantity HDFC Bank Ltd (Financial Services)
Equity, Since 31 Oct 08 | HDFCBANK13% ₹1,418 Cr 19,039,031 ICICI Bank Ltd (Financial Services)
Equity, Since 31 Oct 08 | ICICIBANK13% ₹1,379 Cr 10,972,843
↓ -121,800 Axis Bank Ltd (Financial Services)
Equity, Since 28 Feb 19 | AXISBANK9% ₹932 Cr 7,244,304
↓ -724,375 Kotak Mahindra Bank Ltd (Financial Services)
Equity, Since 31 Jan 23 | KOTAKBANK7% ₹768 Cr 20,001,898
↑ 3,244,512 State Bank of India (Financial Services)
Equity, Since 31 Oct 08 | SBIN6% ₹626 Cr 6,489,068
↑ 2,023,723 SBI Life Insurance Co Ltd (Financial Services)
Equity, Since 30 Sep 17 | SBILIFE4% ₹402 Cr 2,198,381
↓ -86,625 LIC Housing Finance Ltd (Financial Services)
Equity, Since 30 Nov 24 | LICHSGFIN3% ₹363 Cr 6,799,870 SBI Cards and Payment Services Ltd Ordinary Shares (Financial Services)
Equity, Since 30 Nov 25 | SBICARD3% ₹359 Cr 5,751,671
↑ 526,400 ICICI Lombard General Insurance Co Ltd (Financial Services)
Equity, Since 30 Sep 19 | ICICIGI3% ₹319 Cr 1,782,062 HDB Financial Services Ltd (Financial Services)
Equity, Since 30 Nov 25 | HDBFS2% ₹250 Cr 3,761,615
↓ -75,438 3. Invesco India Financial Services Fund
Invesco India Financial Services Fund
Growth Launch Date 14 Jul 08 NAV (30 Jul 26) ₹146.33 ↓ -0.70 (-0.48 %) Net Assets (Cr) ₹1,811 on 30 Jun 26 Category Equity - Sectoral AMC Invesco Asset Management (India) Private Ltd Rating ☆☆☆☆ Risk High Expense Ratio 2.23 Sharpe Ratio 0.03 Information Ratio 0.95 Alpha Ratio 4.9 Min Investment 5,000 Min SIP Investment 100 Exit Load 0-1 Years (1%),1 Years and above(NIL) Growth of 10,000 investment over the years.
Date Value 30 Jun 21 ₹10,000 30 Jun 22 ₹9,102 30 Jun 23 ₹12,326 30 Jun 24 ₹16,683 30 Jun 25 ₹19,433 30 Jun 26 ₹20,269 Returns for Invesco India Financial Services Fund
absolute basis & more than 1 year are on CAGR (Compound Annual Growth Rate) basis. as on 30 Jul 26 Duration Returns 1 Month -0.3% 3 Month 3.6% 6 Month -0.5% 1 Year 6.4% 3 Year 17.1% 5 Year 14.5% 10 Year 15 Year Since launch 16.1% Historical performance (Yearly) on absolute basis
Year Returns 2024 15.1% 2023 19.8% 2022 26% 2021 12.8% 2020 14% 2019 2.4% 2018 21.2% 2017 -0.3% 2016 45.2% 2015 10.4% Fund Manager information for Invesco India Financial Services Fund
Name Since Tenure Hiten Jain 19 May 20 6.12 Yr. Haresh Kapoor 1 Jan 26 0.49 Yr. Data below for Invesco India Financial Services Fund as on 30 Jun 26
Equity Sector Allocation
Sector Value Financial Services 95.68% Technology 3.18% Asset Allocation
Asset Class Value Cash 1.14% Equity 98.86% Top Securities Holdings / Portfolio
Name Holding Value Quantity ICICI Bank Ltd (Financial Services)
Equity, Since 31 Oct 09 | ICICIBANK13% ₹218 Cr 1,738,628
↑ 60,107 HDFC Bank Ltd (Financial Services)
Equity, Since 31 Jul 08 | HDFCBANK13% ₹216 Cr 2,900,056 Axis Bank Ltd (Financial Services)
Equity, Since 31 May 18 | AXISBANK8% ₹129 Cr 1,005,744 ICICI Prudential Asset Management Co Ltd (Financial Services)
Equity, Since 31 Dec 25 | ICICIAMC5% ₹85 Cr 240,125 BSE Ltd (Financial Services)
Equity, Since 30 Sep 23 | BSE5% ₹82 Cr 197,854 Karur Vysya Bank Ltd (Financial Services)
Equity, Since 30 Sep 22 | KARURVYSYA5% ₹77 Cr 2,663,923 Multi Commodity Exchange of India Ltd (Financial Services)
Equity, Since 28 Feb 22 | MCX4% ₹74 Cr 251,091 Shriram Finance Ltd (Financial Services)
Equity, Since 28 Feb 25 | SHRIRAMFIN4% ₹69 Cr 731,682 Nuvama Wealth Management Ltd (Financial Services)
Equity, Since 30 Sep 25 | 5439883% ₹58 Cr 373,787 Cholamandalam Investment and Finance Co Ltd (Financial Services)
Equity, Since 31 Jul 17 | CHOLAFIN3% ₹53 Cr 347,691 4. Sundaram Financial Services Opportunities Fund
Sundaram Financial Services Opportunities Fund
Growth Launch Date 10 Jun 08 NAV (30 Jul 26) ₹107.036 ↓ -0.74 (-0.69 %) Net Assets (Cr) ₹1,681 on 30 Jun 26 Category Equity - Sectoral AMC Sundaram Asset Management Company Ltd Rating ☆☆☆ Risk High Expense Ratio 2.12 Sharpe Ratio -0.07 Information Ratio 0.51 Alpha Ratio 3.51 Min Investment 100,000 Min SIP Investment 100 Exit Load 0-12 Months (1%),12 Months and above(NIL) Growth of 10,000 investment over the years.
Date Value 30 Jun 21 ₹10,000 30 Jun 22 ₹9,429 30 Jun 23 ₹13,139 30 Jun 24 ₹17,744 30 Jun 25 ₹19,203 30 Jun 26 ₹19,462 Returns for Sundaram Financial Services Opportunities Fund
absolute basis & more than 1 year are on CAGR (Compound Annual Growth Rate) basis. as on 30 Jul 26 Duration Returns 1 Month -0.4% 3 Month 2.3% 6 Month -2.9% 1 Year 4.3% 3 Year 12.3% 5 Year 13.8% 10 Year 15 Year Since launch 14% Historical performance (Yearly) on absolute basis
Year Returns 2024 16.9% 2023 7.1% 2022 31.1% 2021 16.8% 2020 15.3% 2019 2.7% 2018 26.4% 2017 -3.7% 2016 33.3% 2015 12.8% Fund Manager information for Sundaram Financial Services Opportunities Fund
Name Since Tenure Rohit Seksaria 30 Dec 17 8.5 Yr. Shalav Saket 28 Feb 26 0.33 Yr. Data below for Sundaram Financial Services Opportunities Fund as on 30 Jun 26
Equity Sector Allocation
Sector Value Financial Services 95.47% Technology 1.8% Asset Allocation
Asset Class Value Cash 1.6% Equity 97.27% Debt 1.13% Other 0% Top Securities Holdings / Portfolio
Name Holding Value Quantity HDFC Bank Ltd (Financial Services)
Equity, Since 31 Dec 08 | HDFCBANK15% ₹232 Cr 3,114,256 ICICI Bank Ltd (Financial Services)
Equity, Since 30 Jun 10 | ICICIBANK11% ₹178 Cr 1,416,021 Axis Bank Ltd (Financial Services)
Equity, Since 28 Feb 10 | AXISBANK10% ₹157 Cr 1,217,541 State Bank of India (Financial Services)
Equity, Since 31 Dec 08 | SBIN6% ₹97 Cr 1,003,469 Bajaj Finserv Ltd (Financial Services)
Equity, Since 31 Mar 25 | BAJAJFINSV5% ₹76 Cr 424,621 DCB Bank Ltd (Financial Services)
Equity, Since 30 Sep 24 | DCBBANK4% ₹66 Cr 3,778,314 PNB Housing Finance Ltd (Financial Services)
Equity, Since 31 Jul 24 | PNBHOUSING4% ₹65 Cr 631,329 Shriram Finance Ltd (Financial Services)
Equity, Since 30 Sep 23 | SHRIRAMFIN4% ₹64 Cr 672,583 Bank of Baroda (Financial Services)
Equity, Since 29 Feb 24 | BANKBARODA4% ₹59 Cr 2,208,626 Cholamandalam Financial Holdings Ltd (Financial Services)
Equity, Since 31 Aug 22 | CHOLAHLDNG3% ₹53 Cr 334,660 5. UTI Banking and Financial Services Fund
UTI Banking and Financial Services Fund
Growth Launch Date 7 Apr 04 NAV (30 Jul 26) ₹195.286 ↓ -0.36 (-0.18 %) Net Assets (Cr) ₹1,430 on 30 Jun 26 Category Equity - Sectoral AMC UTI Asset Management Company Ltd Rating ☆☆☆ Risk High Expense Ratio 2.2 Sharpe Ratio -0.14 Information Ratio 0.35 Alpha Ratio 1.61 Min Investment 5,000 Min SIP Investment 500 Exit Load 0-1 Years (1%),1 Years and above(NIL) Growth of 10,000 investment over the years.
Date Value 30 Jun 21 ₹10,000 30 Jun 22 ₹9,250 30 Jun 23 ₹12,451 30 Jun 24 ₹15,480 30 Jun 25 ₹17,779 30 Jun 26 ₹17,849 Returns for UTI Banking and Financial Services Fund
absolute basis & more than 1 year are on CAGR (Compound Annual Growth Rate) basis. as on 30 Jul 26 Duration Returns 1 Month -0.2% 3 Month 3.7% 6 Month -2.5% 1 Year 4% 3 Year 12.2% 5 Year 12% 10 Year 15 Year Since launch 14.3% Historical performance (Yearly) on absolute basis
Year Returns 2024 16.3% 2023 11.1% 2022 19.5% 2021 15.1% 2020 14.3% 2019 -5.3% 2018 11.6% 2017 -6.8% 2016 43.5% 2015 13% Fund Manager information for UTI Banking and Financial Services Fund
Name Since Tenure Amit Premchandani 16 Jun 25 1.04 Yr. Bhavesh Kanani 12 Jan 26 0.47 Yr. Data below for UTI Banking and Financial Services Fund as on 30 Jun 26
Equity Sector Allocation
Sector Value Financial Services 96.26% Technology 1.58% Asset Allocation
Asset Class Value Cash 2.16% Equity 97.84% Top Securities Holdings / Portfolio
Name Holding Value Quantity HDFC Bank Ltd (Financial Services)
Equity, Since 31 Mar 09 | HDFCBANK17% ₹229 Cr 3,075,000
↑ 200,000 ICICI Bank Ltd (Financial Services)
Equity, Since 30 Apr 04 | ICICIBANK13% ₹175 Cr 1,395,000 State Bank of India (Financial Services)
Equity, Since 28 Feb 18 | SBIN9% ₹120 Cr 1,248,490
↑ 648,490 Axis Bank Ltd (Financial Services)
Equity, Since 30 Jun 18 | AXISBANK8% ₹106 Cr 820,000 Bajaj Finance Ltd (Financial Services)
Equity, Since 30 Nov 19 | BAJFINANCE8% ₹103 Cr 1,135,000 Kotak Mahindra Bank Ltd (Financial Services)
Equity, Since 30 Sep 18 | KOTAKBANK7% ₹98 Cr 2,550,000
↓ -700,000 Shriram Finance Ltd (Financial Services)
Equity, Since 31 Jan 24 | SHRIRAMFIN5% ₹73 Cr 767,975
↑ 55,000 SBI Life Insurance Co Ltd (Financial Services)
Equity, Since 28 Feb 25 | SBILIFE4% ₹51 Cr 277,000 Bajaj Finserv Ltd (Financial Services)
Equity, Since 31 Aug 24 | BAJAJFINSV3% ₹44 Cr 246,000 Ujjivan Small Finance Bank Ltd Ordinary Shares (Financial Services)
Equity, Since 30 Apr 25 | 5429043% ₹37 Cr 6,884,317
↑ 350,000
یہاں فراہم کردہ معلومات کے درست ہونے کو یقینی بنانے کے لیے تمام کوششیں کی گئی ہیں۔ تاہم، ڈیٹا کی درستگی کے حوالے سے کوئی ضمانت نہیں دی جاتی ہے۔ براہ کرم کوئی بھی سرمایہ کاری کرنے سے پہلے اسکیم کی معلومات کے دستاویز کے ساتھ تصدیق کریں۔
You Might Also Like


AMFI Registration No. 112358 | CIN: U74999MH2016PTC282153
Shepard Technologies Pvt. Ltd. (with ARN code 112358) makes no warranties or representations, express or implied, on products offered through the platform. It accepts no liability for any damages or losses, however caused, in connection with the use of, or on the reliance of its product or related services. Terms and conditions of the website are applicable.
©2026 Shepard Technologies Private Limited. All Rights Reserved
Research Highlights for Aditya Birla Sun Life Banking And Financial Services Fund