ایجوکیشن پلاننگ کیلکولیٹر
بچپن کی تعلیم کی منصوبہ بندی کیلکولیٹر کیا ہے؟
چائلڈ ہڈ ایجوکیشن پلاننگ کیلکولیٹر ایک اہم ٹول ہے جو آپ کو مستقبل میں اپنے بچوں کی تعلیمی ضروریات کو پورا کرنے کے لیے اپنی سرمایہ کاری کی منصوبہ بندی کرنے کی اجازت دیتا ہے۔ بچوں کے لیے صحیح تعلیم حاصل کرنا ناگزیر ہے اور جب تعلیم سے متعلق اخراجات صرف مہنگے ہوتے جارہے ہیں تو داؤ پر لگا ہوا ہے۔ ایجوکیشن پلاننگ کیلکولیٹر کے ساتھ، آپ یہ اندازہ لگا سکیں گے کہ آپ کو اپنے بچے کی تعلیم کے لیے کتنی رقم درکار ہوگی اور آپ کو کتنی بچت کرنی چاہیے اور باقاعدگی سے سرمایہ کاری کرنی چاہیے۔بنیاد
کیلکولیٹر کیسے کام کرتا ہے؟
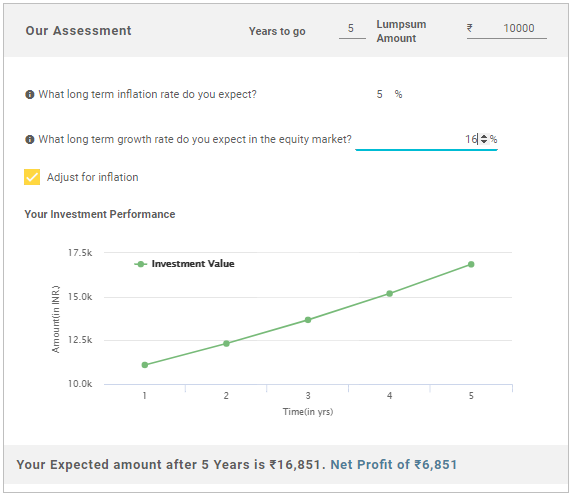
کیلکولیٹر کا کام بہت آسان ہے۔ آپ کو صرف یہ کرنا ہے کہ کھیتوں کے خلاف متعلقہ تفصیلات درج کریں اور تعلیم کی مستقبل کی لاگت کا تخمینہ حاصل کریں اور ساتھ ہی اپنے ہدف تک پہنچنے کے لیے آپ کو ماہانہ کتنی بچت کرنی چاہیے۔ سادہ تفصیلات جیسے سرمایہ کاری کی رقم، آپ کے بچے کی عمر، آپ کی عمر، اور سالانہآمدنی آپ کو یہ تعین کرنے میں مدد مل سکتی ہے کہ اگر آپ شروع کرتے ہیں تو آپ کتنی بچت کر سکتے ہیں۔سرمایہ کاری آج
نوٹ/ ڈس کلیمر: حسابات فرض کر کے بنائے جاتے ہیں۔مہنگائی 6% کی شرح اور اقدار مثالی ہیں۔ اصل لاگت کا انحصار آپ کی سرمایہ کاری کی مستقبل کی کارکردگی پر ہوگا اور اس سے مشروط ہے۔مارکیٹ حالات
Know Your Monthly SIP Amount
Talk to our investment specialist
چائلڈ ایجوکیشن کیلکولیٹر کے فوائد
تعلیمی منصوبہ بندی ایک طویل مدتی منصوبہ ہے اور یہ مشکل ہو سکتا ہے۔ ایسے غیر متوقع حالات ہوسکتے ہیں جو آپ کو اپنے سے دور پھینک سکتے ہیں۔مالی اہداف. چائلڈ ایجوکیشن کیلکولیٹر کام آتا ہے اور مہنگائی کی شرح کو مدنظر رکھتے ہوئے ایک مقررہ تعداد میں تعلیمی اخراجات کا تخمینہ لگاتا ہے۔ اس سے نہ صرف آپ کو ایک منصفانہ تخمینہ لگانے میں مدد مل سکتی ہے بلکہ آپ کو اپنے مالیات کی بہتر منصوبہ بندی کرنے میں بھی مدد مل سکتی ہے۔
آپ کو اپنے بچے کی اعلیٰ تعلیم کی منصوبہ بندی کیوں کرنی چاہیے؟
مہنگائی کی بڑھتی ہوئی شرح کے ساتھ اور آپ کے لیے اپنے بچے کے تعلیمی اخراجات کی منصوبہ بندی کرنے میں کبھی جلدی نہیں ہو سکتی۔ اس بات کو ذہن میں رکھتے ہوئے ایک منصوبہ بنانا ضروری ہے کیونکہ سرمایہ کاری کی صحیح حکمت عملی کی تشکیل میں کوئی تاخیر آپ کے بچے کے مستقبل کے لیے نقصان دہ ثابت ہو سکتی ہے۔ اگرچہ معاشی اتار چڑھاؤ غیر متوقع ہیں، لیکن جلد منصوبہ بندی اس کے خلاف ایک خاص مقدار میں استثنیٰ دے سکتی ہے۔ اگر آپ اپنے بچے کو پوسٹ گریجویٹ کی تعلیم کے لیے بھیجنے کا ارادہ رکھتے ہیں تو منصوبہ بندی زیادہ اہم ہو جاتی ہے، کیونکہ یہ ایسے اہم وقتوں میں مالی مدد کا کام کرے گا۔ چونکہ یہ بہت طویل ہے۔مدتی منصوبہ، ایک دانشمندانہ حکمت عملی یہ ہوگی کہ آج ہی چھوٹی رقم کو ایک طرف رکھنا شروع کر دیا جائے، بجائے اس کے کہ اپنے آپ کو بڑی ادائیگیوں اور بعد میں بچت کی کمی سے مغلوب ہونے دیں۔
دیگر طویل مدتی سرمایہ کاری جو آپ کو اپنے بچے کی مستقبل کی تعلیم میں مدد کے لیے کرنی چاہیے۔
ایکویٹی فنڈز آپ کے لیے سرمایہ کاری کا ایک اچھا آپشن ہو سکتا ہے اگر آپ کا ایک چھوٹا بچہ ہے جس کی عمر انڈرگریجویٹ تعلیم تک 15-18 سال ہے۔ اس کی سفارش کی جاتی ہے کیونکہ اتنے لمبے عرصے کے دوران واپسیوں میں اتار چڑھاؤ توازن برقرار رہتا ہے۔ ایکویٹی کی اعلی سطح بھی افراط زر کی شرح کا مقابلہ کرنے میں مدد کر سکتی ہے۔ آپ a میں سرمایہ کاری کر سکتے ہیں۔گھونٹ اس سے آپ کو مستقل طور پر ایک کارپس بنانے میں مدد ملے گی، یا یہاں تک کہ اگر آپ کے پاس سرمایہ کاری کے لیے کافی رقم موجود ہے تو ایک یکمشت ڈپازٹ کا انتخاب کریں۔ پورٹ فولیو کا بقیہ 30-35% محفوظ اختیارات کی طرف موڑ دیا جا سکتا ہے جیسےپی پی ایف,ٹیکس بچانے والے فکسڈ ڈپازٹس اور ٹیکس فریبانڈز. تقریباً 5 سال کی قلیل مدتی توجہ کے لیے، سرمایہ کاری کرنامقررہ آمدنی فکسڈ ڈپازٹ اور پی پی ایف جیسے آپشنز ایک دانشمندانہ انتخاب ہوں گے۔ اگرچہ واپسی کم ہے، ان کی ضمانت ہے اور اس میں ملوث خطرہ بھی کم ہے۔
2022 کے لیے سرفہرست فنڈز
*3 سال کی کارکردگی کی بنیاد پر بہترین فنڈز۔
"The primary investment objective of the Scheme is to seek capital appreciation by investing predominantly in units of MLIIF - WGF. The Scheme may, at the discretion of the Investment Manager, also invest in the units of other similar overseas mutual fund schemes, which may constitute a significant part of its corpus. The Scheme may also invest a certain portion of its corpus in money market securities and/or units of money market/liquid schemes of DSP Merrill Lynch Mutual Fund, in order to meet liquidity requirements from time to time. However, there is no assurance that the investment objective of the Scheme will be realized." Below is the key information for DSP World Gold Fund Returns up to 1 year are on To generate capital appreciation by investing in Equity and Equity Related Instruments of companies where the Central / State Government(s) has majority shareholding or management control or has powers to appoint majority of directors. However, there is no assurance or guarantee that the investment objective of the Scheme will be achieved. The Scheme does not assure or guarantee any returns. Research Highlights for Invesco India PSU Equity Fund Below is the key information for Invesco India PSU Equity Fund Returns up to 1 year are on 1. DSP World Gold Fund
DSP World Gold Fund
Growth Launch Date 14 Sep 07 NAV (28 Jan 26) ₹69.1145 ↑ 2.99 (4.52 %) Net Assets (Cr) ₹1,756 on 31 Dec 25 Category Equity - Global AMC DSP BlackRock Invmt Managers Pvt. Ltd. Rating ☆☆☆ Risk High Expense Ratio 1.41 Sharpe Ratio 3.42 Information Ratio -0.67 Alpha Ratio 1.32 Min Investment 1,000 Min SIP Investment 500 Exit Load 0-12 Months (1%),12 Months and above(NIL) Growth of 10,000 investment over the years.
Date Value 31 Dec 20 ₹10,000 31 Dec 21 ₹9,101 31 Dec 22 ₹8,405 31 Dec 23 ₹8,991 31 Dec 24 ₹10,424 31 Dec 25 ₹27,842 Returns for DSP World Gold Fund
absolute basis & more than 1 year are on CAGR (Compound Annual Growth Rate) basis. as on 28 Jan 26 Duration Returns 1 Month 26.3% 3 Month 67.6% 6 Month 125.4% 1 Year 214.5% 3 Year 57.3% 5 Year 30.6% 10 Year 15 Year Since launch 11.1% Historical performance (Yearly) on absolute basis
Year Returns 2024 167.1% 2023 15.9% 2022 7% 2021 -7.7% 2020 -9% 2019 31.4% 2018 35.1% 2017 -10.7% 2016 -4% 2015 52.7% Fund Manager information for DSP World Gold Fund
Name Since Tenure Jay Kothari 1 Mar 13 12.85 Yr. Data below for DSP World Gold Fund as on 31 Dec 25
Equity Sector Allocation
Sector Value Basic Materials 94.95% Asset Allocation
Asset Class Value Cash 2.43% Equity 94.95% Debt 0.01% Other 2.6% Top Securities Holdings / Portfolio
Name Holding Value Quantity BGF World Gold I2
Investment Fund | -74% ₹1,294 Cr 1,219,254
↓ -59,731 VanEck Gold Miners ETF
- | GDX25% ₹442 Cr 573,719 Treps / Reverse Repo Investments
CBLO/Reverse Repo | -2% ₹28 Cr Net Receivables/Payables
Net Current Assets | -0% -₹8 Cr 2. Invesco India PSU Equity Fund
Invesco India PSU Equity Fund
Growth Launch Date 18 Nov 09 NAV (29 Jan 26) ₹69.03 ↑ 0.47 (0.69 %) Net Assets (Cr) ₹1,449 on 31 Dec 25 Category Equity - Sectoral AMC Invesco Asset Management (India) Private Ltd Rating ☆☆☆ Risk High Expense Ratio 2.14 Sharpe Ratio 0.27 Information Ratio -0.37 Alpha Ratio -1.9 Min Investment 5,000 Min SIP Investment 500 Exit Load 0-1 Years (1%),1 Years and above(NIL) Growth of 10,000 investment over the years.
Date Value 31 Dec 20 ₹10,000 31 Dec 21 ₹13,105 31 Dec 22 ₹15,797 31 Dec 23 ₹24,402 31 Dec 24 ₹30,659 31 Dec 25 ₹33,810 Returns for Invesco India PSU Equity Fund
absolute basis & more than 1 year are on CAGR (Compound Annual Growth Rate) basis. as on 28 Jan 26 Duration Returns 1 Month 5.1% 3 Month 4.7% 6 Month 9.7% 1 Year 25.5% 3 Year 32.3% 5 Year 28.5% 10 Year 15 Year Since launch 12.6% Historical performance (Yearly) on absolute basis
Year Returns 2024 10.3% 2023 25.6% 2022 54.5% 2021 20.5% 2020 31.1% 2019 6.1% 2018 10.1% 2017 -16.9% 2016 24.3% 2015 17.9% Fund Manager information for Invesco India PSU Equity Fund
Name Since Tenure Hiten Jain 1 Jul 25 0.5 Yr. Sagar Gandhi 1 Jul 25 0.5 Yr. Data below for Invesco India PSU Equity Fund as on 31 Dec 25
Equity Sector Allocation
Sector Value Industrials 31.01% Financial Services 29.88% Utility 19.12% Energy 13.49% Basic Materials 3.52% Consumer Cyclical 1.22% Asset Allocation
Asset Class Value Cash 1.76% Equity 98.24% Top Securities Holdings / Portfolio
Name Holding Value Quantity State Bank of India (Financial Services)
Equity, Since 28 Feb 21 | SBIN9% ₹136 Cr 1,387,617
↓ -38,697 Bharat Electronics Ltd (Industrials)
Equity, Since 31 Mar 17 | BEL8% ₹120 Cr 2,997,692 Bharat Petroleum Corp Ltd (Energy)
Equity, Since 30 Sep 18 | 5005477% ₹104 Cr 2,717,009
↓ -184,556 Indian Bank (Financial Services)
Equity, Since 30 Jun 21 | 5328147% ₹97 Cr 1,157,444
↑ 76,826 NTPC Green Energy Ltd (Utilities)
Equity, Since 30 Nov 24 | NTPCGREEN6% ₹86 Cr 9,129,820
↑ 339,034 Hindustan Aeronautics Ltd Ordinary Shares (Industrials)
Equity, Since 31 May 22 | HAL6% ₹86 Cr 196,158 Bank of Baroda (Financial Services)
Equity, Since 30 Jun 21 | 5321345% ₹66 Cr 2,244,222
↑ 127,830 Bharat Dynamics Ltd Ordinary Shares (Industrials)
Equity, Since 31 May 22 | BDL5% ₹65 Cr 445,685
↑ 21,640 Dredging Corp of India Ltd (Industrials)
Equity, Since 31 Jul 25 | DREDGECORP4% ₹64 Cr 646,300 NTPC Ltd (Utilities)
Equity, Since 31 May 19 | 5325554% ₹59 Cr 1,801,543
↓ -223,420
یہاں فراہم کردہ معلومات کے درست ہونے کو یقینی بنانے کے لیے تمام کوششیں کی گئی ہیں۔ تاہم، ڈیٹا کی درستگی کے حوالے سے کوئی ضمانت نہیں دی جاتی ہے۔ براہ کرم کوئی بھی سرمایہ کاری کرنے سے پہلے اسکیم کی معلومات کے دستاویز کے ساتھ تصدیق کریں۔


Research Highlights for DSP World Gold Fund