منی مارکیٹ میوچل فنڈز
منی مارکیٹ فنڈز کیا ہیں؟
ایک پیسہمارکیٹ فنڈ (MMF) فکسڈ کی ایک قسم ہے۔آمدنی میوچل فنڈ جو قرض کی ضمانتوں میں سرمایہ کاری کرتا ہے۔ لیکن، اس سے پہلے کہ ہم منی مارکیٹ فنڈز کے ساتھ شروع کریں، یہ سمجھنا ضروری ہے کہ ایک مقررہ آمدنی کا آلہ کیا ہے؟ ٹھیک ہے، جیسا کہ نام سے ظاہر ہوتا ہے، ایک مقررہ آمدنی کا آلہ ایک ایسی چیز ہے جو ایک مخصوص مدت کے دوران ایک مخصوص رقم پیدا کرتی ہے۔ دیسرمایہ کار جاری کنندہ کے پاس موجود اثاثوں پر ایک مقررہ دعویٰ دیا جاتا ہے، مقررہ آمدنی کے آلات کو کم خطرہ اور کم پیداوار والی سرمایہ کاری سمجھا جاتا ہے۔
بنیادی طور پر، فکسڈ انکم انسٹرومنٹ کچھ بھی نہیں ہیں، بلکہ فنڈز ادھار لینے کا ایک طریقہ ہے (جہاں قرضہ جاری کنندہ کے ذریعے لیا جاتا ہے)۔
فکسڈ انکم بمقابلہ اسٹاک
ٹھیک ہے شروع کرنے والوں کے لیے مقررہ آمدنی ہولڈر کو معاشی حقوق دیتی ہے، جس میں سود کی ادائیگی وصول کرنے کا حق اور تمام یا کچھ حصہ کی واپسی شامل ہوتی ہے۔سرمایہ ایک مقررہ تاریخ پر سرمایہ کاری کی۔ اس کے برعکس،شیئر ہولڈر (اسٹاک اونر) جاری کنندہ سے ڈیویڈنڈ وصول کرتا ہے، لیکن کمپنی ڈیویڈنڈ ادا کرنے کے لیے کسی قانون کی پابند نہیں ہے۔ اس کے علاوہ، ایک اور اہم فرق یہ ہے کہ فکسڈ انکم ہولڈر کمپنی کا قرض دہندہ ہوتا ہے جو سیکیورٹی جاری کرتا ہے، جب کہ شیئر ہولڈر ایک پارٹنر ہوتا ہے، جو کیپیٹل اسٹاک کے ایک حصے کا مالک ہوتا ہے۔ یہاں یہ سمجھنا ضروری ہے کہ اگر کمپنی ٹوٹ جاتی ہے تو قرض دہندگان (بانڈ ہولڈرز) کو شیئر ہولڈرز (ایکویٹی ہولڈرز) پر ترجیح حاصل ہوتی ہے۔
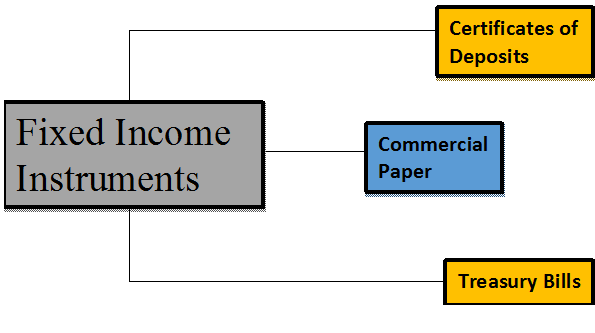
مقررہ آمدنی کے آلات کی اقسام
مختلف مقررہ آمدنی کے آلات ہیں جو منی مارکیٹ کے آلات کے تحت آتے ہیں، ان میں سے کچھ کے نام:
ڈپازٹس کے سرٹیفکیٹ (سی ڈیز)
وقتی ڈپازٹس جیسے ٹرم ڈپازٹس عام طور پر صارفین کو بینکوں (شیڈولڈ کمرشل بینک) اور تمام ہندوستانی مالیاتی اداروں کے ذریعے پیش کیے جاتے ہیں۔ اس میں اور ایک ٹرم ڈپازٹ کے درمیان فرق aبینک یہ ہے کہ سی ڈیز کو واپس نہیں لیا جا سکتا۔
کمرشل پیپر (CPs)
تجارتی کاغذات کو عام طور پر پرومیسری نوٹ کے نام سے جانا جاتا ہے جو غیر محفوظ ہوتے ہیں اور عام طور پر کمپنیاں اور مالیاتی اداروں کی طرف سے ان کی طرف سے رعایتی شرح پر جاری کیے جاتے ہیں۔Face Value. تجارتی کاغذات کے لیے مقررہ میچورٹی 1 سے 270 دن ہے۔ جن مقاصد کے لیے وہ جاری کیے جاتے ہیں وہ ہیں - انوینٹری فنانسنگ، اکاؤنٹس کے لیےقابل وصول، اور قلیل مدتی واجبات یا قرضوں کا تصفیہ کرنا۔
Talk to our investment specialist
ٹریژری بلز (T-Bills)
ٹریژری بل سب سے پہلے ہندوستانی حکومت نے 1917 میں جاری کیے تھے۔ ٹریژری بل قلیل مدتی مالیاتی آلات ہیں جو ملک کے مرکزی بینک کے ذریعہ جاری کیے جاتے ہیں۔ یہ منی مارکیٹ کے محفوظ ترین آلات میں سے ایک ہے کیونکہ یہ مارکیٹ کے خطرات سے خالی ہے (چونکہ خطرہ خود مختار ہے یا اس معاملے میں حکومت ہند)، حالانکہ سرمایہ کاری پر منافع اتنا بڑا نہیں ہے۔ ٹریژری بل پرائمری کے ساتھ ساتھ سیکنڈری مارکیٹس کے ذریعے گردش کر رہے ہیں۔ ٹریژری بلز کی میچورٹی کی مدت بالترتیب 3 ماہ، 6 ماہ اور 1 سال ہے۔
بہت سے دوسرے فکسڈ انکم انسٹرومنٹس ہیں جیسے ری پرچیز ایگریمنٹس (ریپوز)، اثاثہ کی حمایت یافتہ سیکیورٹیز وغیرہ، جو ہندوستانی فکسڈ انکم مارکیٹ میں بھی موجود ہیں، لیکن اوپر والے زیادہ عام ہیں۔
منی مارکیٹ میوچل فنڈز میں سرمایہ کاری کیوں کی جائے؟
- کرنسی مارکیٹ میں سیکیورٹیز نسبتاً کم خطرہ ہیں۔
- منی مارکیٹ فنڈز کو میوچل فنڈ کی تمام سرمایہ کاری میں محفوظ اور محفوظ سمجھا جاتا ہے۔
- منی مارکیٹ فنڈز پر غور کرتے ہوئے، منی مارکیٹ اکاؤنٹ میں سرمایہ کاری کرنا آسان ہے۔سرمایہ کاری کے ذریعےباہمی چندہ سرمایہ کار اپنی سہولت کے مطابق ایک اکاؤنٹ کھول سکتے ہیں، جمع کر سکتے ہیں اور نکال سکتے ہیں۔
- منی مارکیٹ فنڈز کو تمام میوچل فنڈ سرمایہ کاری کی سب سے کم اتار چڑھاؤ والی اقسام میں سے ایک سمجھا جاتا ہے۔
- منی مارکیٹ فنڈز کی کارکردگی ریزرو بینک آف انڈیا کی طرف سے مقرر کردہ شرح سود سے قریبی تعلق رکھتی ہے۔سنٹرل بینک آف انڈیا. لہذا، جب RBI مارکیٹ میں شرحیں بڑھاتا ہے، پیداوار میں اضافہ ہوتا ہے، اور منی مارکیٹ فنڈز اچھا منافع دینے کے قابل ہوتے ہیں۔
منی مارکیٹ کے آلات اور بانڈز: فرق
بانڈز میچورٹی کی مدت ایک سال سے زیادہ ہے جو اسے دیگر قرض کی ضمانتوں جیسے تجارتی کاغذات، ٹریژری بلز اور منی مارکیٹ کے دیگر آلات سے مختلف کرتی ہے جن کی میچورٹی مدت عام طور پر ایک سال سے کم ہوتی ہے۔
منی مارکیٹ کیا ہے؟
منی مارکیٹ عام طور پر مالیاتی منڈی کے ایک حصے سے مراد ہے جہاں چھوٹے میچورٹیز (ایک سال سے کم) اور زیادہ کے ساتھ مالیاتی آلاتلیکویڈیٹی تجارت کر رہے ہیں. ہندوستان میں ایک بہت ہی فعال کرنسی مارکیٹ ہے، جہاں بہت سے آلات کی تجارت ہوتی ہے۔ یہاں آپ کے پاس میوچل فنڈ کمپنیاں، سرکاری بینک اور دیگر بڑے گھریلو ادارے حصہ لے رہے ہیں۔ کرنسی مارکیٹ قلیل مدتی سیکیورٹیز جیسے تجارتی کاغذات اور ٹریژری بلز کی خرید و فروخت کے لیے مالیاتی منڈی کا ایک جزو بن گیا ہے۔
منی مارکیٹ کے نرخ
منی مارکیٹ ریٹ وہ شرح سود ہیں جو قلیل مدتی منی مارکیٹ کے آلات کے ذریعہ پیش کی جاتی ہیں۔ ان آلات کی میچورٹی 1 دن سے ایک سال تک ہوتی ہے۔ منی مارکیٹ کی شرحیں بہت سے پیچیدہ آلات جیسے ٹریژری بلز پر مختلف ہوتی ہیں،کال کریں۔ پیسہکاروباری صفحہ (CP)، ڈپازٹس کے سرٹیفکیٹ (CDs)، ریپوز، وغیرہ۔ ریزرو بینک آف انڈیا (RBI) بڑی حد تک کرنسی مارکیٹس پر گورننگ اتھارٹی ہے۔
28 فروری 2017 کو آر بی آئی کی سائٹ پر دیئے گئے مختلف آلات کے منی مارکیٹ ریٹ کی ایک مثال حوالہ کے لیے ذیل میں ہے۔
| حجم (ایک ٹانگ) | وزنی اوسط شرح | رینج | |
|---|---|---|---|
| A. اوور نائٹ سیگمنٹ (I+II+III+IV) | 4,00,659.36 | 3.25 | 0.01-5.30 |
| I. کال منی | 12,671.70 | 3.23 | 1.90-3.50 |
| II سہ فریقی ریپو | 2,79,349.70 | 3.26 | 2.00-3.45 |
| III مارکیٹ ریپو | 1,07,582.96 | 3.25 | 0.01-3.50 |
| چہارم کارپوریٹ بانڈ میں ریپو | 1,055.00 | 3.56 | 3.40-5.30 |
| B. اصطلاحی طبقہ | |||
| I. نوٹس منی** | 45.00 | 2.97 | 2.65-3.50 |
| II ٹرم منی @@ | 311.00 | - | 3.15-3.45 |
| III سہ فریقی ریپو | 1,493.00 | 3.30 | 3.30-3.35 |
| چہارم مارکیٹ ریپو | 5,969.10 | 3.37 | 0.01-3.60 |
| کارپوریٹ بانڈ میں V. ریپو | 0.00 | - | - |
ماخذ: منی مارکیٹ آپریشنز، آر بی آئی تاریخ- تاریخ: 30 مارچ 2021
میوچل فنڈ کمپنیاں جو منی مارکیٹ فنڈز پیش کرتی ہیں۔
جیسا کہ ہم نے اوپر مختلف قسم کے آلات کے بارے میں سیکھا ہے، یہ جاننا بھی اتنا ہی اہم ہے کہ ایک سرمایہ کار منی مارکیٹ فنڈز میں کیسے سرمایہ کاری کر سکتا ہے۔ 44 ہیں۔AMCs (اثاثہ انتظامی کمپنیاں) ہندوستان میں، ان میں سے زیادہ ترپیشکش منی مارکیٹ فنڈز (بنیادی طور پرمائع فنڈز اور سرمایہ کاروں کے لیے الٹرا شارٹ فنڈز)۔ سرمایہ کار تقسیم کاروں جیسے بینکوں اور بروکرز کے ذریعے بھی سرمایہ کاری کر سکتے ہیں۔ منی مارکیٹ فنڈز میں سرمایہ کاری کے لیے ضروری ہے کہ وہ متعلقہ طریقہ کار اور متعلقہ درخواستوں پر عمل کرے۔ ڈیٹ میوچل فنڈز کی شرائط و ضوابط مختلف ہو سکتے ہیں، اس لیے یہ ضروری ہے کہ مجموعی معلومات حاصل کریں اور پھر آپ کی ضروریات کو پورا کرنے والے کو منتخب کریں۔ مزید یہ کہ، کسی بھی منی مارکیٹ میوچل فنڈز میں سرمایہ کاری کرنے سے پہلے اس کے سرمایہ کاری کے مقاصد، خطرات، منافع اور اخراجات پر غور کریں۔
غور کرنے کے عوامل
یہاں کچھ اہم پہلو ہیں جن پر آپ کو ہندوستان میں منی مارکیٹ فنڈز میں سرمایہ کاری کرنے سے پہلے غور کرنا چاہیے:
a خطرات اور واپسی۔
منی مارکیٹ فنڈز ہیں۔قرض فنڈ اور اس لیے قرض فنڈز پر لاگو ہونے والے تمام خطرات جیسے سود کی شرح کے خطرے اور کریڈٹ رسک کو برداشت کریں۔ مزید برآں، فنڈ مینیجر ان آلات میں سرمایہ کاری کر سکتا ہے جس میں ریٹرن کو بڑھانے کے لیے قدرے زیادہ خطرہ والے حصے ہوں۔ عام طور پر، منی مارکیٹ فنڈز معمول کے مقابلے بہتر منافع پیش کرتے ہیں۔بچت اکاونٹ. خالص اثاثہ کی قیمت یانہیں ہیں سود کی شرح کے نظام میں تبدیلی کے ساتھ ان فنڈز میں تبدیلی آتی ہے۔
ب اخراجات کا تناسب
چونکہ واپسی بہت زیادہ نہیں ہے، اس لیے اخراجات کا تناسب آپ کے تعین میں اہم کردار ادا کرتا ہے۔کمائی منی مارکیٹ فنڈ سے۔ اخراجات کا تناسب فنڈ کے کل اثاثوں کا ایک چھوٹا فیصد ہے جو فنڈ ہاؤس کی طرف سے فنڈ مینجمنٹ سروسز کے لیے چارج کیا جاتا ہے۔
مثالی طور پر، آپ کو اپنے منافع کو زیادہ سے زیادہ کرنے کے لیے کم اخراجات کے تناسب کے ساتھ فنڈز تلاش کرنا چاہیے۔
c اپنے انویسٹمنٹ پلان کے مطابق سرمایہ کاری کریں۔
عام طور پر، سرمایہ کاروں کو منی مارکیٹ فنڈز کی سفارش کی جاتی ہے جس کا سرمایہ کاری افق 90-365 دن ہوتا ہے۔ یہ اسکیمیں آپ کو اپنے پورٹ فولیو کو متنوع بنانے میں مدد کر سکتی ہیں اور لیکویڈیٹی کو برقرار رکھتے ہوئے اضافی نقد رقم کی سرمایہ کاری میں مدد کر سکتی ہیں۔ اس بات کو یقینی بنائیں کہ آپ اپنے حساب سے سرمایہ کاری کریں۔سرمایہ کاری کا منصوبہ.
d ٹیکس لگانا
منی مارکیٹ فنڈز کے معاملے میں، ٹیکس کے قوانین درج ذیل ہیں:
کیپٹل گین ٹیکس
اگر آپ اسکیم کے یونٹس کو تین سال تک کی مدت کے لیے رکھتے ہیں، تو پھرکیپٹل گینز آپ کی کمائی کو شارٹ ٹرم کیپیٹل گینز یا STCG کہا جاتا ہے۔ STCG آپ کے میں شامل کیا گیا ہے۔قابل ٹیکس آمدنی اور قابل اطلاق کے مطابق ٹیکس لگایا گیا ہے۔انکم ٹیکس سلیب
اگر آپ اسکیم کی اکائیوں کو تین سال سے زیادہ عرصے تک رکھتے ہیں، تو آپ کے ذریعہ حاصل ہونے والے کیپٹل گین کو طویل مدتی کیپٹل گینز یا LTCG کہا جاتا ہے۔ انڈیکسیشن فوائد کے ساتھ اس پر 20% ٹیکس لگایا جاتا ہے۔
مالی سال 22 - 23 میں سرمایہ کاری کے لیے بہترین منی مارکیٹ فنڈز
ہندوستان میں منی مارکیٹ کے چند بہترین فنڈز درج ذیل ہیں۔Fund NAV Net Assets (Cr) 3 MO (%) 6 MO (%) 1 YR (%) 3 YR (%) 2024 (%) Debt Yield (YTM) Mod. Duration Eff. Maturity UTI Money Market Fund Growth ₹3,301.25
↑ 0.76 ₹17,557 1.7 3.4 6.2 7.3 7.5 7.58% 6M 20D 6M 20D Tata Money Market Fund Growth ₹5,053.22
↑ 1.21 ₹32,150 1.7 3.4 6.2 7.3 7.4 7.79% 7M 1D 7M 1D Aditya Birla Sun Life Money Manager Fund Growth ₹395.945
↑ 0.09 ₹27,383 1.7 3.4 6.2 7.3 7.4 6.95% 6M 25D 6M 29D Kotak Money Market Scheme Growth ₹4,805.2
↑ 1.02 ₹28,762 1.7 3.4 6.2 7.2 7.4 7.71% 7M 6D 7M 6D Bandhan Money Manager Fund Growth ₹43.1182
↑ 0.01 ₹14,466 1.7 3.3 6.2 6.9 7.3 7.75% 7M 21D 7M 21D Note: Returns up to 1 year are on absolute basis & more than 1 year are on CAGR basis. as on 28 Jul 26 Research Highlights & Commentary of 5 Funds showcased
Commentary UTI Money Market Fund Tata Money Market Fund Aditya Birla Sun Life Money Manager Fund Kotak Money Market Scheme Bandhan Money Manager Fund Point 1 Bottom quartile AUM (₹17,557 Cr). Highest AUM (₹32,150 Cr). Lower mid AUM (₹27,383 Cr). Upper mid AUM (₹28,762 Cr). Bottom quartile AUM (₹14,466 Cr). Point 2 Established history (17+ yrs). Oldest track record among peers (23 yrs). Established history (20+ yrs). Established history (23+ yrs). Established history (23+ yrs). Point 3 Rating: 4★ (upper mid). Rating: 3★ (bottom quartile). Top rated. Rating: 4★ (lower mid). Rating: 3★ (bottom quartile). Point 4 Risk profile: Low. Risk profile: Low. Risk profile: Low. Risk profile: Low. Risk profile: Moderately Low. Point 5 1Y return: 6.23% (top quartile). 1Y return: 6.20% (upper mid). 1Y return: 6.20% (lower mid). 1Y return: 6.19% (bottom quartile). 1Y return: 6.17% (bottom quartile). Point 6 1M return: 0.62% (upper mid). 1M return: 0.62% (bottom quartile). 1M return: 0.63% (top quartile). 1M return: 0.62% (lower mid). 1M return: 0.60% (bottom quartile). Point 7 Sharpe: 0.81 (lower mid). Sharpe: 0.82 (top quartile). Sharpe: 0.69 (bottom quartile). Sharpe: 0.75 (bottom quartile). Sharpe: 0.81 (upper mid). Point 8 Information ratio: 0.00 (top quartile). Information ratio: 0.00 (upper mid). Information ratio: 0.00 (lower mid). Information ratio: 0.00 (bottom quartile). Information ratio: 0.00 (bottom quartile). Point 9 Yield to maturity (debt): 7.58% (bottom quartile). Yield to maturity (debt): 7.79% (top quartile). Yield to maturity (debt): 6.95% (bottom quartile). Yield to maturity (debt): 7.71% (lower mid). Yield to maturity (debt): 7.75% (upper mid). Point 10 Modified duration: 0.56 yrs (top quartile). Modified duration: 0.59 yrs (lower mid). Modified duration: 0.57 yrs (upper mid). Modified duration: 0.60 yrs (bottom quartile). Modified duration: 0.64 yrs (bottom quartile). UTI Money Market Fund
Tata Money Market Fund
Aditya Birla Sun Life Money Manager Fund
Kotak Money Market Scheme
Bandhan Money Manager Fund
To provide highest possible current income consistent with preservation of capital and providing liquidity from investing in a diversified portfolio of short term money market securities. Below is the key information for UTI Money Market Fund Returns up to 1 year are on (Erstwhile Tata Liquid Fund) To create a highly liquid portfolio of good quality debt as well as money market instruments so as to provide reasonable returns and high liquidity to the unitholders. Research Highlights for Tata Money Market Fund Below is the key information for Tata Money Market Fund Returns up to 1 year are on (Erstwhile Aditya Birla Sun Life Floating Rate Fund - Short Term) The primary objective of the schemes is to generate regular income through investment in a portfolio comprising substantially of floating rate debt / money market instruments. The schemes may invest a portion of its net assets in fixed rate debt securities and money market instruments. Research Highlights for Aditya Birla Sun Life Money Manager Fund Below is the key information for Aditya Birla Sun Life Money Manager Fund Returns up to 1 year are on (Erstwhile Kotak Floater Short Term Fund) To reduce the interest rate risk associated with investments in fixed rate instruments by investing predominantly in floating rate securities, money market instruments and using appropriate derivatives. Research Highlights for Kotak Money Market Scheme Below is the key information for Kotak Money Market Scheme Returns up to 1 year are on (Erstwhile IDFC Money Manager Fund - Treasury Plan) Seek to generate stable returns with a low risk strategy by creating a portfolio that is substantially invested in good quality floating rate debt or money market
instruments, fixed rate debt or money market instruments swapped for floating
returns and fixed rate debt and money market instruments. However, there can
be no assurance that the investment objectives of the scheme will be realized. Research Highlights for Bandhan Money Manager Fund Below is the key information for Bandhan Money Manager Fund Returns up to 1 year are on 1. UTI Money Market Fund
UTI Money Market Fund
Growth Launch Date 13 Jul 09 NAV (28 Jul 26) ₹3,301.25 ↑ 0.76 (0.02 %) Net Assets (Cr) ₹17,557 on 30 Jun 26 Category Debt - Money Market AMC UTI Asset Management Company Ltd Rating ☆☆☆☆ Risk Low Expense Ratio 0.25 Sharpe Ratio 0.81 Information Ratio 0 Alpha Ratio 0 Min Investment 10,000 Min SIP Investment 500 Exit Load NIL Yield to Maturity 7.58% Effective Maturity 6 Months 20 Days Modified Duration 6 Months 20 Days Growth of 10,000 investment over the years.
Date Value 30 Jun 21 ₹10,000 30 Jun 22 ₹10,381 30 Jun 23 ₹11,091 30 Jun 24 ₹11,922 30 Jun 25 ₹12,901 30 Jun 26 ₹13,717 Returns for UTI Money Market Fund
absolute basis & more than 1 year are on CAGR (Compound Annual Growth Rate) basis. as on 28 Jul 26 Duration Returns 1 Month 0.6% 3 Month 1.7% 6 Month 3.4% 1 Year 6.2% 3 Year 7.3% 5 Year 6.5% 10 Year 15 Year Since launch 7.3% Historical performance (Yearly) on absolute basis
Year Returns 2024 7.5% 2023 7.7% 2022 7.4% 2021 4.9% 2020 3.7% 2019 6% 2018 8% 2017 7.8% 2016 6.7% 2015 7.7% Fund Manager information for UTI Money Market Fund
Name Since Tenure Anurag Mittal 1 Dec 21 4.58 Yr. Amit Sharma 7 Jul 17 8.99 Yr. Data below for UTI Money Market Fund as on 30 Jun 26
Asset Allocation
Asset Class Value Cash 86.17% Debt 13.52% Other 0.31% Debt Sector Allocation
Sector Value Corporate 46.48% Cash Equivalent 35.25% Government 17.97% Credit Quality
Rating Value AAA 100% Top Securities Holdings / Portfolio
Name Holding Value Quantity India (Republic of)
- | -4% ₹654 Cr 6,629,850,000 Indusind Bank Ltd.
Debentures | -2% ₹338 Cr 3,500,000,000
↑ 3,500,000,000 Tbill
Sovereign Bonds | -2% ₹297 Cr 3,000,000,000 Tbill
Sovereign Bonds | -2% ₹296 Cr 3,000,000,000 5.74% Govt Stock 2026
Sovereign Bonds | -2% ₹280 Cr 2,800,000,000 Tbill
Sovereign Bonds | -1% ₹248 Cr 2,500,000,000 Tbill
Sovereign Bonds | -1% ₹198 Cr 2,000,000,000 Indian Bank
Domestic Bonds | -1% ₹195 Cr 2,000,000,000 Axis Bank Ltd.
Debentures | -1% ₹191 Cr 2,000,000,000
↑ 2,000,000,000 Indian Overseas Bank
Debentures | -1% ₹190 Cr 2,000,000,000 2. Tata Money Market Fund
Tata Money Market Fund
Growth Launch Date 22 May 03 NAV (28 Jul 26) ₹5,053.22 ↑ 1.21 (0.02 %) Net Assets (Cr) ₹32,150 on 30 Jun 26 Category Debt - Money Market AMC Tata Asset Management Limited Rating ☆☆☆ Risk Low Expense Ratio 0.44 Sharpe Ratio 0.82 Information Ratio 0 Alpha Ratio 0 Min Investment 5,000 Min SIP Investment 500 Exit Load NIL Yield to Maturity 7.79% Effective Maturity 7 Months 1 Day Modified Duration 7 Months 1 Day Growth of 10,000 investment over the years.
Date Value 30 Jun 21 ₹10,000 30 Jun 22 ₹10,373 30 Jun 23 ₹11,077 30 Jun 24 ₹11,911 30 Jun 25 ₹12,877 30 Jun 26 ₹13,686 Returns for Tata Money Market Fund
absolute basis & more than 1 year are on CAGR (Compound Annual Growth Rate) basis. as on 28 Jul 26 Duration Returns 1 Month 0.6% 3 Month 1.7% 6 Month 3.4% 1 Year 6.2% 3 Year 7.3% 5 Year 6.5% 10 Year 15 Year Since launch 6.8% Historical performance (Yearly) on absolute basis
Year Returns 2024 7.4% 2023 7.7% 2022 7.4% 2021 4.8% 2020 3.9% 2019 6.4% 2018 8.1% 2017 -0.1% 2016 6.7% 2015 7.6% Fund Manager information for Tata Money Market Fund
Name Since Tenure Amit Somani 16 Oct 13 12.71 Yr. Harsh Dave 1 Jun 26 0.08 Yr. Data below for Tata Money Market Fund as on 30 Jun 26
Asset Allocation
Asset Class Value Cash 87.56% Debt 12.11% Other 0.32% Debt Sector Allocation
Sector Value Corporate 46.25% Cash Equivalent 37.93% Government 15.5% Credit Quality
Rating Value AAA 100% Top Securities Holdings / Portfolio
Name Holding Value Quantity India (Republic of)
- | -3% ₹1,000 Cr 100,000,000
↑ 100,000,000 Indian Bank
Domestic Bonds | -3% ₹958 Cr 19,500 Indian Overseas Bank
Debentures | -2% ₹666 Cr 14,000 Equitas Small Finance Bank Ltd.
Debentures | -2% ₹567 Cr 12,000 India (Republic of)
- | -2% ₹527 Cr 53,000,000 7.86% Karnataka Sdl 2027
Sovereign Bonds | -2% ₹491 Cr 48,500,000
↑ 48,500,000 Karur Vysya Bank Ltd.
Debentures | -2% ₹491 Cr 10,000 Tbill
Sovereign Bonds | -1% ₹445 Cr 45,000,000 India (Republic of)
- | -1% ₹400 Cr 40,500,000 India (Republic of)
- | -1% ₹302 Cr 30,500,000
↓ -25,000,000 3. Aditya Birla Sun Life Money Manager Fund
Aditya Birla Sun Life Money Manager Fund
Growth Launch Date 13 Oct 05 NAV (28 Jul 26) ₹395.945 ↑ 0.09 (0.02 %) Net Assets (Cr) ₹27,383 on 30 Jun 26 Category Debt - Money Market AMC Birla Sun Life Asset Management Co Ltd Rating ☆☆☆☆☆ Risk Low Expense Ratio 0.35 Sharpe Ratio 0.69 Information Ratio 0 Alpha Ratio 0 Min Investment 1,000 Min SIP Investment 1,000 Exit Load NIL Yield to Maturity 6.95% Effective Maturity 6 Months 29 Days Modified Duration 6 Months 25 Days Growth of 10,000 investment over the years.
Date Value 30 Jun 21 ₹10,000 30 Jun 22 ₹10,373 30 Jun 23 ₹11,087 30 Jun 24 ₹11,925 30 Jun 25 ₹12,891 30 Jun 26 ₹13,700 Returns for Aditya Birla Sun Life Money Manager Fund
absolute basis & more than 1 year are on CAGR (Compound Annual Growth Rate) basis. as on 28 Jul 26 Duration Returns 1 Month 0.6% 3 Month 1.7% 6 Month 3.4% 1 Year 6.2% 3 Year 7.3% 5 Year 6.5% 10 Year 15 Year Since launch 6.8% Historical performance (Yearly) on absolute basis
Year Returns 2024 7.4% 2023 7.8% 2022 7.4% 2021 4.8% 2020 3.8% 2019 6.6% 2018 8% 2017 7.9% 2016 6.8% 2015 7.7% Fund Manager information for Aditya Birla Sun Life Money Manager Fund
Name Since Tenure Kaustubh Gupta 15 Jul 11 14.97 Yr. Anuj Jain 22 Mar 21 5.28 Yr. Mohit Sharma 1 Apr 17 9.25 Yr. Data below for Aditya Birla Sun Life Money Manager Fund as on 30 Jun 26
Asset Allocation
Asset Class Value Cash 69.19% Debt 30.52% Other 0.29% Debt Sector Allocation
Sector Value Corporate 51.26% Cash Equivalent 33.61% Government 14.84% Credit Quality
Rating Value AAA 100% Top Securities Holdings / Portfolio
Name Holding Value Quantity Indusind Bank Ltd.
Debentures | -5% ₹1,383 Cr 29,000 Axis Bank Ltd.
Debentures | -3% ₹917 Cr 19,000 Federal Bank Ltd.
Debentures | -3% ₹905 Cr 19,000 Gujarat State Development Loans
Sovereign Bonds | -3% ₹797 Cr 79,327,600 Karur Vysya Bank Ltd.
Debentures | -2% ₹475 Cr 10,000 Tbill
Sovereign Bonds | -1% ₹394 Cr 40,000,000 7.49% Gujarat Sgs 2026
Sovereign Bonds | -1% ₹327 Cr 32,500,000 7.43% Gujarat Sgs 2027
Sovereign Bonds | -1% ₹247 Cr 24,500,000 Tbill
Sovereign Bonds | -1% ₹245 Cr 25,000,000 Karur Vysya Bank Ltd.
Debentures | -1% ₹242 Cr 5,000 4. Kotak Money Market Scheme
Kotak Money Market Scheme
Growth Launch Date 14 Jul 03 NAV (28 Jul 26) ₹4,805.2 ↑ 1.02 (0.02 %) Net Assets (Cr) ₹28,762 on 30 Jun 26 Category Debt - Money Market AMC Kotak Mahindra Asset Management Co Ltd Rating ☆☆☆☆ Risk Low Expense Ratio 0.36 Sharpe Ratio 0.75 Information Ratio 0 Alpha Ratio 0 Min Investment 5,000 Min SIP Investment 1,000 Exit Load NIL Yield to Maturity 7.71% Effective Maturity 7 Months 6 Days Modified Duration 7 Months 6 Days Growth of 10,000 investment over the years.
Date Value 30 Jun 21 ₹10,000 30 Jun 22 ₹10,382 30 Jun 23 ₹11,079 30 Jun 24 ₹11,905 30 Jun 25 ₹12,872 30 Jun 26 ₹13,680 Returns for Kotak Money Market Scheme
absolute basis & more than 1 year are on CAGR (Compound Annual Growth Rate) basis. as on 28 Jul 26 Duration Returns 1 Month 0.6% 3 Month 1.7% 6 Month 3.4% 1 Year 6.2% 3 Year 7.2% 5 Year 6.5% 10 Year 15 Year Since launch 7.1% Historical performance (Yearly) on absolute basis
Year Returns 2024 7.4% 2023 7.7% 2022 7.3% 2021 4.9% 2020 3.7% 2019 5.7% 2018 8% 2017 7.7% 2016 6.7% 2015 7.7% Fund Manager information for Kotak Money Market Scheme
Name Since Tenure Deepak Agrawal 1 Nov 06 19.67 Yr. Manu Sharma 1 Nov 22 3.66 Yr. Data below for Kotak Money Market Scheme as on 30 Jun 26
Asset Allocation
Asset Class Value Cash 87.94% Debt 11.75% Other 0.31% Debt Sector Allocation
Sector Value Corporate 46.99% Cash Equivalent 33.44% Government 19.26% Credit Quality
Rating Value AAA 100% Top Securities Holdings / Portfolio
Name Holding Value Quantity India (Republic of)
- | -4% ₹1,332 Cr 135,000,000 Tbill
Sovereign Bonds | -3% ₹988 Cr 100,000,000 Tbill
Sovereign Bonds | -2% ₹742 Cr 75,000,000 Indusind Bank Ltd.
Debentures | -2% ₹715 Cr 75,000 Punjab National Bank
Debentures | -2% ₹478 Cr 50,000 06/08/2026 Maturing 182 DTB
Sovereign Bonds | -1% ₹397 Cr 40,000,000
↓ -25,000,000 Tbill
Sovereign Bonds | -1% ₹371 Cr 37,500,000 Federal Bank Ltd.
Debentures | -1% ₹359 Cr 37,500 India (Republic of)
- | -1% ₹248 Cr 25,000,000
↓ -15,000,000 Karur Vysya Bank Ltd.
Debentures | -1% ₹238 Cr 25,000 5. Bandhan Money Manager Fund
Bandhan Money Manager Fund
Growth Launch Date 18 Feb 03 NAV (28 Jul 26) ₹43.1182 ↑ 0.01 (0.02 %) Net Assets (Cr) ₹14,466 on 30 Jun 26 Category Debt - Money Market AMC IDFC Asset Management Company Limited Rating ☆☆☆ Risk Moderately Low Expense Ratio 0.58 Sharpe Ratio 0.81 Information Ratio 0 Alpha Ratio 0 Min Investment 100 Min SIP Investment 1,000 Exit Load NIL Yield to Maturity 7.75% Effective Maturity 7 Months 21 Days Modified Duration 7 Months 21 Days Growth of 10,000 investment over the years.
Date Value 30 Jun 21 ₹10,000 30 Jun 22 ₹10,296 30 Jun 23 ₹10,917 30 Jun 24 ₹11,653 30 Jun 25 ₹12,576 30 Jun 26 ₹13,365 Returns for Bandhan Money Manager Fund
absolute basis & more than 1 year are on CAGR (Compound Annual Growth Rate) basis. as on 28 Jul 26 Duration Returns 1 Month 0.6% 3 Month 1.7% 6 Month 3.3% 1 Year 6.2% 3 Year 6.9% 5 Year 6% 10 Year 15 Year Since launch 6.4% Historical performance (Yearly) on absolute basis
Year Returns 2024 7.3% 2023 7.2% 2022 6.7% 2021 4% 2020 2.9% 2019 5% 2018 6.7% 2017 6.2% 2016 6% 2015 8.1% Fund Manager information for Bandhan Money Manager Fund
Name Since Tenure Gautam Kaul 1 Dec 21 4.58 Yr. Brijesh Shah 12 Jul 21 4.97 Yr. Data below for Bandhan Money Manager Fund as on 30 Jun 26
Asset Allocation
Asset Class Value Cash 92.62% Debt 7.14% Other 0.24% Debt Sector Allocation
Sector Value Corporate 48.39% Cash Equivalent 36.25% Government 15.12% Credit Quality
Rating Value AAA 100% Top Securities Holdings / Portfolio
Name Holding Value Quantity Tbill
Sovereign Bonds | -7% ₹990 Cr 100,000,000 National Bank for Agriculture and Rural Development
Domestic Bonds | -2% ₹331 Cr 35,000,000 Tbill
Sovereign Bonds | -2% ₹248 Cr 25,000,000 ICICI Bank Ltd.
Debentures | -1% ₹189 Cr 20,000,000 7.08% Karnataka Sdl 2026
Sovereign Bonds | -1% ₹106 Cr 10,500,000 Tbill
Sovereign Bonds | -1% ₹99 Cr 10,000,000 HDFC Bank Ltd.
Debentures | -1% ₹95 Cr 10,000,000 Tbill
Sovereign Bonds | -1% ₹79 Cr 8,000,000
↓ -2,000,000 National Bank for Agriculture and Rural Development
Domestic Bonds | -0% ₹71 Cr 7,500,000 7.39% Tamilnadu SDL 2026
Sovereign Bonds | -0% ₹60 Cr 5,928,300
نتیجہ
جب کہ ہم نے منی مارکیٹ کے آلات کے بارے میں جان لیا ہے، یہ ڈیٹ میوچل فنڈز، ان کی اقسام اور درجہ بندی کے بارے میں جاننا بھی ضروری ہے۔ ٹھیک ہے، قرض میوچل فنڈز کو عام وسیع زمروں میں درجہ بندی کیا جاتا ہے جیسے مائع فنڈز، الٹرامختصر مدت کے فنڈز، شارٹ ٹرم فنڈز، لانگ ٹرم انکم فنڈز اورگلٹ فنڈز.
تاہم، منی مارکیٹ فنڈز میں سرمایہ کاری کرنے کے لیے، کی صورت حال کو سمجھنا بہت ضروری ہے۔معیشت، شرح سود کی سمت، اور سرمایہ کاری کرتے وقت کارپوریٹ قرض کے ساتھ ساتھ حکومتی قرض میں پیداوار کی نقل و حرکت کی متوقع سمت۔
یہاں فراہم کردہ معلومات کے درست ہونے کو یقینی بنانے کے لیے تمام کوششیں کی گئی ہیں۔ تاہم، ڈیٹا کی درستگی کے حوالے سے کوئی ضمانت نہیں دی جاتی ہے۔ براہ کرم کوئی بھی سرمایہ کاری کرنے سے پہلے اسکیم کی معلومات کے دستاویز کے ساتھ تصدیق کریں۔


?")


AMFI Registration No. 112358 | CIN: U74999MH2016PTC282153
Shepard Technologies Pvt. Ltd. (with ARN code 112358) makes no warranties or representations, express or implied, on products offered through the platform. It accepts no liability for any damages or losses, however caused, in connection with the use of, or on the reliance of its product or related services. Terms and conditions of the website are applicable.
©2026 Shepard Technologies Private Limited. All Rights Reserved
Research Highlights for UTI Money Market Fund