Best Gold ETFs to Invest in 2026
In recent years, the popularity of Gold ETFs (Exchange Traded Fund) amongst investors has surged high. Investors are more inclined towards Investing in Gold ETFs as they

track gold prices and eliminate the need of storage. But, when it comes to Investing, often investors are confused over choosing the best Gold ETFs.
The ideal way to go for Gold ETFs is to focus on the fund with the lowest tracking error. It is advisable to go for a Gold ETF that has the largest margin and highest volume. To make it convenient for investors, we have listed down the best Gold ETFs to invest in India.
How to Invest in Gold ETFs?
To invest in gold ETF, you need to have a Demat account and an online Trading Account. To open an account, you would require a PAN Card, an address proof and an identity proof. After the account is ready, you can choose a Gold ETF and place an order. Once the trade is executed a confirmation is sent to you in your account. A small fee from the fund house and the broker is charged when one buys or sells these Gold ETFs.
How to Invest in Gold Mutual Funds Online?
Open Free Investment Account for Lifetime at Fincash.com.
Complete your Registration and KYC Process
Upload Documents (PAN, Aadhaar, etc.). And, You are Ready to Invest!
Talk to our investment specialist
Fund Selection Methodology used to find 5 funds
Best Gold ETFs to Invest 2026
Some of the best performing underlying gold ETFs having AUM/Net Assets > 25 Crore are:
Fund NAV Net Assets (Cr) 3 MO (%) 6 MO (%) 1 YR (%) 3 YR (%) 5 YR (%) 2025 (%) Aditya Birla Sun Life Gold Fund Growth ₹41.5961
↑ 0.50 ₹1,648 -4.7 -5 43.1 32.5 23.2 72 Invesco India Gold Fund Growth ₹40.2768
↑ 0.50 ₹456 -4.2 -3.7 42.7 32.2 23.1 69.6 SBI Gold Fund Growth ₹42.011
↑ 0.54 ₹15,294 -4.6 -4.4 43.9 32.8 23.4 71.5 Nippon India Gold Savings Fund Growth ₹54.7994
↑ 0.65 ₹6,854 -4.7 -4.3 43.4 32.5 23.1 71.2 Kotak Gold Fund Growth ₹55.1189
↑ 0.72 ₹6,422 -4.5 -4.5 43.6 32.6 22.9 70.4 Note: Returns up to 1 year are on absolute basis & more than 1 year are on CAGR basis. as on 22 Jul 26 Research Highlights & Commentary of 5 Funds showcased
Commentary Aditya Birla Sun Life Gold Fund Invesco India Gold Fund SBI Gold Fund Nippon India Gold Savings Fund Kotak Gold Fund Point 1 Bottom quartile AUM (₹1,648 Cr). Bottom quartile AUM (₹456 Cr). Highest AUM (₹15,294 Cr). Upper mid AUM (₹6,854 Cr). Lower mid AUM (₹6,422 Cr). Point 2 Established history (14+ yrs). Established history (14+ yrs). Established history (14+ yrs). Oldest track record among peers (15 yrs). Established history (15+ yrs). Point 3 Top rated. Rating: 3★ (upper mid). Rating: 2★ (lower mid). Rating: 2★ (bottom quartile). Rating: 1★ (bottom quartile). Point 4 Risk profile: Moderately High. Risk profile: Moderately High. Risk profile: Moderately High. Risk profile: Moderately High. Risk profile: Moderately High. Point 5 5Y return: 23.18% (upper mid). 5Y return: 23.07% (bottom quartile). 5Y return: 23.43% (top quartile). 5Y return: 23.14% (lower mid). 5Y return: 22.88% (bottom quartile). Point 6 3Y return: 32.52% (lower mid). 3Y return: 32.25% (bottom quartile). 3Y return: 32.82% (top quartile). 3Y return: 32.51% (bottom quartile). 3Y return: 32.60% (upper mid). Point 7 1Y return: 43.14% (bottom quartile). 1Y return: 42.73% (bottom quartile). 1Y return: 43.88% (top quartile). 1Y return: 43.39% (lower mid). 1Y return: 43.57% (upper mid). Point 8 1M return: -1.80% (bottom quartile). 1M return: -1.63% (lower mid). 1M return: -1.60% (upper mid). 1M return: -1.65% (bottom quartile). 1M return: -1.46% (top quartile). Point 9 Alpha: 0.00 (top quartile). Alpha: 0.00 (upper mid). Alpha: 0.00 (lower mid). Alpha: 0.00 (bottom quartile). Alpha: 0.00 (bottom quartile). Point 10 Sharpe: 1.20 (bottom quartile). Sharpe: 1.26 (lower mid). Sharpe: 1.29 (upper mid). Sharpe: 1.19 (bottom quartile). Sharpe: 1.38 (top quartile). Aditya Birla Sun Life Gold Fund
Invesco India Gold Fund
SBI Gold Fund
Nippon India Gold Savings Fund
Kotak Gold Fund
An Open ended Fund of Funds Scheme with the investment objective to provide returns that tracks returns provided by Birla Sun Life Gold ETF (BSL Gold ETF). Below is the key information for Aditya Birla Sun Life Gold Fund Returns up to 1 year are on To provide returns that closely corresponds to returns provided by Invesco India Gold Exchange Traded Fund. Research Highlights for Invesco India Gold Fund Below is the key information for Invesco India Gold Fund Returns up to 1 year are on The scheme seeks to provide returns that closely correspond to returns provided by SBI - ETF Gold (Previously known as SBI GETS). Research Highlights for SBI Gold Fund Below is the key information for SBI Gold Fund Returns up to 1 year are on The investment objective of the Scheme is to seek to provide returns that closely correspond to returns provided by Reliance ETF Gold BeES. Research Highlights for Nippon India Gold Savings Fund Below is the key information for Nippon India Gold Savings Fund Returns up to 1 year are on The investment objective of the scheme is to generate returns by investing in units of Kotak Gold Exchange Traded Fund. Research Highlights for Kotak Gold Fund Below is the key information for Kotak Gold Fund Returns up to 1 year are on 1. Aditya Birla Sun Life Gold Fund
Aditya Birla Sun Life Gold Fund
Growth Launch Date 20 Mar 12 NAV (22 Jul 26) ₹41.5961 ↑ 0.50 (1.21 %) Net Assets (Cr) ₹1,648 on 30 Jun 26 Category Gold - Gold AMC Birla Sun Life Asset Management Co Ltd Rating ☆☆☆ Risk Moderately High Expense Ratio 0.51 Sharpe Ratio 1.2 Information Ratio 0 Alpha Ratio 0 Min Investment 100 Min SIP Investment 100 Exit Load 0-365 Days (1%),365 Days and above(NIL) Growth of 10,000 investment over the years.
Date Value Returns for Aditya Birla Sun Life Gold Fund
absolute basis & more than 1 year are on CAGR (Compound Annual Growth Rate) basis. as on 22 Jul 26 Duration Returns 1 Month -1.8% 3 Month -4.7% 6 Month -5% 1 Year 43.1% 3 Year 32.5% 5 Year 23.2% 10 Year 15 Year Since launch 10.5% Historical performance (Yearly) on absolute basis
Year Returns 2025 72% 2024 18.7% 2023 14.5% 2022 12.3% 2021 -5% 2020 26% 2019 21.3% 2018 6.8% 2017 1.6% 2016 11.5% Fund Manager information for Aditya Birla Sun Life Gold Fund
Name Since Tenure Data below for Aditya Birla Sun Life Gold Fund as on 30 Jun 26
Asset Allocation
Asset Class Value Top Securities Holdings / Portfolio
Name Holding Value Quantity 2. Invesco India Gold Fund
Invesco India Gold Fund
Growth Launch Date 5 Dec 11 NAV (22 Jul 26) ₹40.2768 ↑ 0.50 (1.26 %) Net Assets (Cr) ₹456 on 30 Jun 26 Category Gold - Gold AMC Invesco Asset Management (India) Private Ltd Rating ☆☆☆ Risk Moderately High Expense Ratio 0.37 Sharpe Ratio 1.26 Information Ratio 0 Alpha Ratio 0 Min Investment 5,000 Min SIP Investment 500 Exit Load 0-6 Months (2%),6-12 Months (1%),12 Months and above(NIL) Growth of 10,000 investment over the years.
Date Value Returns for Invesco India Gold Fund
absolute basis & more than 1 year are on CAGR (Compound Annual Growth Rate) basis. as on 22 Jul 26 Duration Returns 1 Month -1.6% 3 Month -4.2% 6 Month -3.7% 1 Year 42.7% 3 Year 32.2% 5 Year 23.1% 10 Year 15 Year Since launch 10% Historical performance (Yearly) on absolute basis
Year Returns 2025 69.6% 2024 18.8% 2023 14.5% 2022 12.8% 2021 -5.5% 2020 27.2% 2019 21.4% 2018 6.6% 2017 1.3% 2016 21.6% Fund Manager information for Invesco India Gold Fund
Name Since Tenure Data below for Invesco India Gold Fund as on 30 Jun 26
Asset Allocation
Asset Class Value Top Securities Holdings / Portfolio
Name Holding Value Quantity 3. SBI Gold Fund
SBI Gold Fund
Growth Launch Date 12 Sep 11 NAV (22 Jul 26) ₹42.011 ↑ 0.54 (1.31 %) Net Assets (Cr) ₹15,294 on 30 Jun 26 Category Gold - Gold AMC SBI Funds Management Private Limited Rating ☆☆ Risk Moderately High Expense Ratio 0.3 Sharpe Ratio 1.29 Information Ratio 0 Alpha Ratio 0 Min Investment 5,000 Min SIP Investment 500 Exit Load 0-1 Years (1%),1 Years and above(NIL) Growth of 10,000 investment over the years.
Date Value Returns for SBI Gold Fund
absolute basis & more than 1 year are on CAGR (Compound Annual Growth Rate) basis. as on 22 Jul 26 Duration Returns 1 Month -1.6% 3 Month -4.6% 6 Month -4.4% 1 Year 43.9% 3 Year 32.8% 5 Year 23.4% 10 Year 15 Year Since launch 10.1% Historical performance (Yearly) on absolute basis
Year Returns 2025 71.5% 2024 19.6% 2023 14.1% 2022 12.6% 2021 -5.7% 2020 27.4% 2019 22.8% 2018 6.4% 2017 3.5% 2016 10% Fund Manager information for SBI Gold Fund
Name Since Tenure Data below for SBI Gold Fund as on 30 Jun 26
Asset Allocation
Asset Class Value Top Securities Holdings / Portfolio
Name Holding Value Quantity 4. Nippon India Gold Savings Fund
Nippon India Gold Savings Fund
Growth Launch Date 7 Mar 11 NAV (22 Jul 26) ₹54.7994 ↑ 0.65 (1.20 %) Net Assets (Cr) ₹6,854 on 30 Jun 26 Category Gold - Gold AMC Nippon Life Asset Management Ltd. Rating ☆☆ Risk Moderately High Expense Ratio 0.35 Sharpe Ratio 1.19 Information Ratio 0 Alpha Ratio 0 Min Investment 5,000 Min SIP Investment 100 Exit Load 0-1 Years (2%),1 Years and above(NIL) Growth of 10,000 investment over the years.
Date Value Returns for Nippon India Gold Savings Fund
absolute basis & more than 1 year are on CAGR (Compound Annual Growth Rate) basis. as on 22 Jul 26 Duration Returns 1 Month -1.7% 3 Month -4.7% 6 Month -4.3% 1 Year 43.4% 3 Year 32.5% 5 Year 23.1% 10 Year 15 Year Since launch 11.7% Historical performance (Yearly) on absolute basis
Year Returns 2025 71.2% 2024 19% 2023 14.3% 2022 12.3% 2021 -5.5% 2020 26.6% 2019 22.5% 2018 6% 2017 1.7% 2016 11.6% Fund Manager information for Nippon India Gold Savings Fund
Name Since Tenure Data below for Nippon India Gold Savings Fund as on 30 Jun 26
Asset Allocation
Asset Class Value Top Securities Holdings / Portfolio
Name Holding Value Quantity 5. Kotak Gold Fund
Kotak Gold Fund
Growth Launch Date 25 Mar 11 NAV (22 Jul 26) ₹55.1189 ↑ 0.72 (1.33 %) Net Assets (Cr) ₹6,422 on 30 Jun 26 Category Gold - Gold AMC Kotak Mahindra Asset Management Co Ltd Rating ☆ Risk Moderately High Expense Ratio 0.5 Sharpe Ratio 1.38 Information Ratio 0 Alpha Ratio 0 Min Investment 5,000 Min SIP Investment 1,000 Exit Load 0-6 Months (2%),6-12 Months (1%),12 Months and above(NIL) Growth of 10,000 investment over the years.
Date Value Returns for Kotak Gold Fund
absolute basis & more than 1 year are on CAGR (Compound Annual Growth Rate) basis. as on 22 Jul 26 Duration Returns 1 Month -1.5% 3 Month -4.5% 6 Month -4.5% 1 Year 43.6% 3 Year 32.6% 5 Year 22.9% 10 Year 15 Year Since launch 11.8% Historical performance (Yearly) on absolute basis
Year Returns 2025 70.4% 2024 18.9% 2023 13.9% 2022 11.7% 2021 -4.7% 2020 26.6% 2019 24.1% 2018 7.3% 2017 2.5% 2016 10.2% Fund Manager information for Kotak Gold Fund
Name Since Tenure Data below for Kotak Gold Fund as on 30 Jun 26
Asset Allocation
Asset Class Value Top Securities Holdings / Portfolio
Name Holding Value Quantity
How To Choose Best Gold ETFs?
The parameters to choose the best Gold ETFs in India are as follows-
Fund Track Record
It is important to know the past performance of the fund house in Exchange Traded Funds. Investors looking for the best Gold ETFs, it is advisable to choose a fund which has a track record of at least three years.
Liquidity
Exchange Traded Funds need to be checked based on the trading activity. Most of the ETFs trade heavily based on the changes in the benchmark, but some ETFs trade barely. The trading activity actually confirms the liquidity of an ETF. The higher the trading activity, the higher is the liquidity.
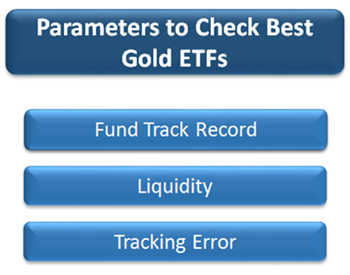
Tracking Error
The ETFs are expected to track the underlying index closely, but some ETF do not track it closely. An investor should prefer an ETF with minimum tracking error.
FAQs
1. How is the value of gold ETFs evaluated?
A: The value of gold ETFs is tracked based on the market value of physical gold. It represent the price of gold bars that have a purity of 99.5%. You can track the price of gold by logging into the NSE website or the BSE, and it will be reflected in the ongoing price of gold ETFs.
2. Who sells gold ETFs?
A: Mutual Fund companies and financial institutes sell gold ETFs. Some of the well-performing gold ETFs are mentioned above.
3. Can I purchase physical gold with the gold ETFs?
A: No, once the investment period is completed, you can close the account and withdraw the money. You cannot en-cash the gold ETFs for physical gold.
4. What do the gold ETFs invest in?
A: Gold ETFs have diversified investments in gold mining, manufacturing, transportation, and other similar sectors. Usually, the assets are made in industries known to produce good returns, ensuring that the investments are safe and secure.
5. Why should I invest in gold ETFs?
A: Gold ETFs are suitable investments, especially if you are looking to diversify your investment Portfolio. Gold, as experts mention, is one of the safest investments as its value does not go down extensively. The same is applicable for gold ETFs.
6. Is there any exit load in this investment?
A: Given the nature of the investment, most companies do not levy an exit load in gold ETFs. Hence, if you want to withdraw from the investment before its maturity, you do not have to pay any exit load. However, most financial institutes levy a brokerage charge you will have to discuss with your fund manager.
7. Are there any tax benefits on the investments?
A: You would not have to pay any VAT in the case of gold ETFs, which would be the case if you had purchased physical gold of similar value. Moreover, depending on the income tax slab that you fall under, you can enjoy tax benefits from the investment you make. With gold ETFs, you will not have to pay any wealth tax, long-term Capital Gains tax, or Sales Tax.
8. Can I use gold ETFs as collateral for loans?
A: Yes, gold ETFs are similar to gold, and hence, you can use them as Collateral for loans. You can it to secure the loan that you require from a Bank or a financial institute.
All efforts have been made to ensure the information provided here is accurate. However, no guarantees are made regarding correctness of data. Please verify with scheme information document before making any investment.


AMFI Registration No. 112358 | CIN: U74999MH2016PTC282153
Shepard Technologies Pvt. Ltd. (with ARN code 112358) makes no warranties or representations, express or implied, on products offered through the platform. It accepts no liability for any damages or losses, however caused, in connection with the use of, or on the reliance of its product or related services. Terms and conditions of the website are applicable.
©2026 Shepard Technologies Private Limited. All Rights Reserved
Research Highlights for Aditya Birla Sun Life Gold Fund