6 Best Monthly Income Plan (MIP) 2026
The Monthly Income Plan is an open-ended mutual fund that predominantly invests its assets in fixed income instruments.

Typically, monthly income plan is a combination of debt and equity assets, in which more 65% of the assets are invested in fixed income yielding instruments. However, the remaining assets of the monthly income scheme are invested in equity-linked instruments, like shares and stocks, that provide market-linked returns.
The basic objective of the monthly income plan is to provide regular income to people. Also, a MIP Mutual fund offers an option of monthly as well as quarterly income, that people can choose according to their convenience.
Investing in MIPs is easy and hassle-free. Investors can buy and sell MIP units like any other mutual fund scheme. You can invest either through a lump sum or through a systematic Investment plan (SIP), where a fixed amount is invested at regular intervals. If you want to invest in monthly income plan, it is advised to consider a list of best monthly income plan offered by various mutual fund companies.
MIP Returns
The returns from MIPs are primarily in the form of dividends, which are declared by the mutual fund company at regular intervals, typically on a monthly or quarterly basis. The dividends received from MIPs are tax-free in the hands of the investors. In addition to providing regular income, MIPs also offer the benefit of capital appreciation. The equity portion of the fund allows investors to participate in the growth potential of the stock market, while the debt component ensures that the downside risk is limited.
MIPs are managed by professional fund managers who make investment decisions on behalf of the investors. The fund managers have a wealth of experience and expertise in managing investments and are responsible for allocating the assets of the fund in a manner that generates the best possible returns.
MIPs come in different variants, such as conservative, moderate, and aggressive. Conservative MIPs invest a larger portion of their assets in debt instruments, while aggressive MIPs have a higher allocation to equities. The investment objective of each variant is different, and investors can choose the one that best suits their risk appetite.
Who Should Invest in Monthly Income Plan (MIP)?
Any moderate risk-averse investor who is looking for some exposure to equity markets along with a fixed income can invest in a monthly income plan. Apart from providing fixed income, monthly income scheme offers market linked returns. Moreover, a monthly income plan is suitable for senior citizens as well, those who are nearing retirement.
Fund Selection Methodology used to find 6 funds
6 Best Performing Monthly Income Mutual Funds in India FY 26 - 27
Fund NAV Net Assets (Cr) 3 MO (%) 6 MO (%) 1 YR (%) 3 YR (%) 5 YR (%) 2025 (%) Since launch (%) Baroda Pioneer Conservative Hybrid Fund Growth ₹30.2092
↑ 0.02 ₹33 -1.7 -1.2 3.3 9.1 7.8 6.5 ICICI Prudential MIP 25 Growth ₹79.2082
↑ 0.01 ₹3,348 1.5 2.6 4 8.8 8.6 7.9 9.7 DSP Regular Savings Fund Growth ₹60.9872
↑ 0.01 ₹179 1.4 2.3 3.3 8.4 7.3 7.2 8.5 Aditya Birla Sun Life Regular Savings Fund Growth ₹70.2693
↑ 0.04 ₹1,490 1.9 3.1 4.3 8.2 7.9 7.1 9.2 Note: Returns up to 1 year are on absolute basis & more than 1 year are on CAGR basis. as on 11 Mar 22 Research Highlights & Commentary of 4 Funds showcased
Commentary Baroda Pioneer Conservative Hybrid Fund ICICI Prudential MIP 25 DSP Regular Savings Fund Aditya Birla Sun Life Regular Savings Fund Point 1 Bottom quartile AUM (₹33 Cr). Highest AUM (₹3,348 Cr). Lower mid AUM (₹179 Cr). Upper mid AUM (₹1,490 Cr). Point 2 Established history (21+ yrs). Oldest track record among peers (22 yrs). Established history (22+ yrs). Established history (22+ yrs). Point 3 Rating: 2★ (bottom quartile). Top rated. Rating: 3★ (lower mid). Rating: 5★ (upper mid). Point 4 Risk profile: Moderate. Risk profile: Moderately High. Risk profile: Moderately High. Risk profile: Moderately High. Point 5 5Y return: 7.83% (lower mid). 5Y return: 8.61% (top quartile). 5Y return: 7.26% (bottom quartile). 5Y return: 7.94% (upper mid). Point 6 3Y return: 9.05% (top quartile). 3Y return: 8.79% (upper mid). 3Y return: 8.45% (lower mid). 3Y return: 8.19% (bottom quartile). Point 7 1Y return: 3.31% (lower mid). 1Y return: 4.03% (upper mid). 1Y return: 3.26% (bottom quartile). 1Y return: 4.34% (top quartile). Point 8 1M return: -1.08% (bottom quartile). 1M return: 0.68% (lower mid). 1M return: 0.74% (upper mid). 1M return: 0.96% (top quartile). Point 9 Alpha: 0.25 (upper mid). Alpha: 0.00 (lower mid). Alpha: -0.64 (bottom quartile). Alpha: 0.26 (top quartile). Point 10 Sharpe: 0.85 (top quartile). Sharpe: -0.33 (lower mid). Sharpe: -0.45 (bottom quartile). Sharpe: -0.26 (upper mid). Baroda Pioneer Conservative Hybrid Fund
ICICI Prudential MIP 25
DSP Regular Savings Fund
Aditya Birla Sun Life Regular Savings Fund
*Above is the list of best performing monthy income providing Mutual Funds managing assets over 3 years.
(Erstwhile Baroda Pioneer MIP Fund) To generate regular income through investment in debt and money market instruments and also to generate long term capital appreciation by investing a portion in equity and equity related instruments. Research Highlights for Baroda Pioneer Conservative Hybrid Fund Below is the key information for Baroda Pioneer Conservative Hybrid Fund Returns up to 1 year are on The Scheme seeks to generate regular income through investments primarily in debt and money market instruments. As a secondary objective, the Scheme also seeks to generate long term capital appreciation from the portion of equity investments under the Scheme. However, there can be no assurance that the investment objectives of the Scheme will be realized. Research Highlights for ICICI Prudential MIP 25 Below is the key information for ICICI Prudential MIP 25 Returns up to 1 year are on (Erstwhile DSP BlackRock MIP Fund) The scheme is seeking to generate an attractive return, consistent with prudent risk, from a portfolio which is substantially constituted of quality debt securities. The scheme will also seek to generate capital appreciation by investing a smaller portion of its corpus in equity and equity related securities of the 100 largest corporates by market capitalisation, listed in India. Research Highlights for DSP Regular Savings Fund Below is the key information for DSP Regular Savings Fund Returns up to 1 year are on (Erstwhile Aditya Birla Sun Life MIP II - Wealth 25 Plan) An Open-ended income scheme with the objective to generate regular income so as to make monthly payment or distribution to unit holders with the secondary objective being growth of capital. Monthly Income is not assured and is subject to availability of distributable surplus. Research Highlights for Aditya Birla Sun Life Regular Savings Fund Below is the key information for Aditya Birla Sun Life Regular Savings Fund Returns up to 1 year are on 1. Baroda Pioneer Conservative Hybrid Fund
Baroda Pioneer Conservative Hybrid Fund
Growth Launch Date 8 Sep 04 NAV (11 Mar 22) ₹30.2092 ↑ 0.02 (0.06 %) Net Assets (Cr) ₹33 on 31 Jan 22 Category Hybrid - Hybrid Debt AMC Baroda Pioneer Asset Management Co. Ltd. Rating ☆☆ Risk Moderate Expense Ratio 2.08 Sharpe Ratio 0.85 Information Ratio -0.38 Alpha Ratio 0.25 Min Investment 5,000 Min SIP Investment 500 Exit Load NIL Growth of 10,000 investment over the years.
Date Value 30 Jun 21 ₹10,000 Returns for Baroda Pioneer Conservative Hybrid Fund
absolute basis & more than 1 year are on CAGR (Compound Annual Growth Rate) basis. as on 11 Mar 22 Duration Returns 1 Month -1.1% 3 Month -1.7% 6 Month -1.2% 1 Year 3.3% 3 Year 9.1% 5 Year 7.8% 10 Year 15 Year Since launch 6.5% Historical performance (Yearly) on absolute basis
Year Returns 2025 2024 2023 2022 2021 2020 2019 2018 2017 2016 Fund Manager information for Baroda Pioneer Conservative Hybrid Fund
Name Since Tenure Data below for Baroda Pioneer Conservative Hybrid Fund as on 31 Jan 22
Asset Allocation
Asset Class Value Equity Sector Allocation
Sector Value Debt Sector Allocation
Sector Value Credit Quality
Rating Value Top Securities Holdings / Portfolio
Name Holding Value Quantity 2. ICICI Prudential MIP 25
ICICI Prudential MIP 25
Growth Launch Date 30 Mar 04 NAV (21 Jul 26) ₹79.2082 ↑ 0.01 (0.01 %) Net Assets (Cr) ₹3,348 on 30 Jun 26 Category Hybrid - Hybrid Debt AMC ICICI Prudential Asset Management Company Limited Rating ☆☆☆☆☆ Risk Moderately High Expense Ratio 1.67 Sharpe Ratio -0.33 Information Ratio 0 Alpha Ratio 0 Min Investment 5,000 Min SIP Investment 100 Exit Load 0-1 Years (1%),1 Years and above(NIL) Growth of 10,000 investment over the years.
Date Value 30 Jun 21 ₹10,000 30 Jun 22 ₹10,516 30 Jun 23 ₹11,629 30 Jun 24 ₹13,240 30 Jun 25 ₹14,452 30 Jun 26 ₹15,057 Returns for ICICI Prudential MIP 25
absolute basis & more than 1 year are on CAGR (Compound Annual Growth Rate) basis. as on 11 Mar 22 Duration Returns 1 Month 0.7% 3 Month 1.5% 6 Month 2.6% 1 Year 4% 3 Year 8.8% 5 Year 8.6% 10 Year 15 Year Since launch 9.7% Historical performance (Yearly) on absolute basis
Year Returns 2025 7.9% 2024 11.4% 2023 11.4% 2022 5.1% 2021 9.9% 2020 10.9% 2019 9.6% 2018 5.1% 2017 12.9% 2016 10.9% Fund Manager information for ICICI Prudential MIP 25
Name Since Tenure Manish Banthia 19 Sep 13 12.79 Yr. Akhil Kakkar 22 Jan 24 2.44 Yr. Roshan Chutkey 2 May 22 4.17 Yr. Sharmila D’mello 31 Jul 22 3.92 Yr. Data below for ICICI Prudential MIP 25 as on 30 Jun 26
Asset Allocation
Asset Class Value Cash 6.36% Equity 24.28% Debt 69.07% Other 0.3% Equity Sector Allocation
Sector Value Financial Services 7.67% Consumer Cyclical 3.8% Communication Services 2.22% Consumer Defensive 2.2% Health Care 1.54% Real Estate 1.39% Technology 1.37% Basic Materials 1.36% Industrials 0.99% Utility 0.97% Energy 0.76% Debt Sector Allocation
Sector Value Corporate 48.21% Government 23.73% Cash Equivalent 3.48% Credit Quality
Rating Value A 8.37% AA 50.95% AAA 40.68% Top Securities Holdings / Portfolio
Name Holding Value Quantity 6.9% Govt Stock 2065
Sovereign Bonds | -4% ₹137 Cr 15,000,000 National Bank For Agriculture And Rural Development
Debentures | -3% ₹100 Cr 10,000 Adani Enterprises Limited
Debentures | -3% ₹100 Cr 10,000 Manappuram Finance Limited
Debentures | -3% ₹99 Cr 10,000 6.48% Govt Stock 2035
Sovereign Bonds | -3% ₹87 Cr 8,964,700
↓ -2,500,000 Godrej Properties Limited
Debentures | -2% ₹76 Cr 7,500 Yes Bank Limited
Debentures | -2% ₹65 Cr 650 6.45% Govt Stock 2034
Sovereign Bonds | -2% ₹55 Cr 5,369,910 Vedanta Limited
Debentures | -2% ₹50 Cr 5,000 Indostar Capital Finance Limited
Debentures | -2% ₹50 Cr 5,000 3. DSP Regular Savings Fund
DSP Regular Savings Fund
Growth Launch Date 11 Jun 04 NAV (21 Jul 26) ₹60.9872 ↑ 0.01 (0.02 %) Net Assets (Cr) ₹179 on 30 Jun 26 Category Hybrid - Hybrid Debt AMC DSP BlackRock Invmt Managers Pvt. Ltd. Rating ☆☆☆ Risk Moderately High Expense Ratio 1.12 Sharpe Ratio -0.45 Information Ratio 0.44 Alpha Ratio -0.64 Min Investment 1,000 Min SIP Investment 500 Exit Load 0-12 Months (1%),12 Months and above(NIL) Growth of 10,000 investment over the years.
Date Value 30 Jun 21 ₹10,000 30 Jun 22 ₹10,024 30 Jun 23 ₹11,075 30 Jun 24 ₹12,558 30 Jun 25 ₹13,763 30 Jun 26 ₹14,227 Returns for DSP Regular Savings Fund
absolute basis & more than 1 year are on CAGR (Compound Annual Growth Rate) basis. as on 11 Mar 22 Duration Returns 1 Month 0.7% 3 Month 1.4% 6 Month 2.3% 1 Year 3.3% 3 Year 8.4% 5 Year 7.3% 10 Year 15 Year Since launch 8.5% Historical performance (Yearly) on absolute basis
Year Returns 2025 7.2% 2024 11% 2023 12% 2022 3.5% 2021 7.8% 2020 9.3% 2019 6.9% 2018 -5.3% 2017 11% 2016 10.7% Fund Manager information for DSP Regular Savings Fund
Name Since Tenure Abhishek Singh 31 May 21 5.09 Yr. Shantanu Godambe 1 Aug 24 1.91 Yr. Data below for DSP Regular Savings Fund as on 30 Jun 26
Asset Allocation
Asset Class Value Cash 18.84% Equity 19.51% Debt 61.3% Other 0.35% Equity Sector Allocation
Sector Value Financial Services 9.07% Health Care 2.69% Consumer Cyclical 2.16% Basic Materials 1.36% Consumer Defensive 1.19% Energy 0.93% Utility 0.7% Communication Services 0.66% Technology 0.5% Industrials 0.25% Debt Sector Allocation
Sector Value Government 54.13% Corporate 20.46% Cash Equivalent 5.56% Credit Quality
Rating Value AA 9.6% AAA 90.4% Top Securities Holdings / Portfolio
Name Holding Value Quantity 7.32% Govt Stock 2030
Sovereign Bonds | -12% ₹21 Cr 2,000,000 6.75% Govt Stock 2033
Sovereign Bonds | -9% ₹16 Cr 1,500,000 7.03% Maharashtra Sgs 2038
Sovereign Bonds | -8% ₹15 Cr 1,500,000 7.06% Govt Stock 2028
Sovereign Bonds | -6% ₹10 Cr 1,000,000 6.48% Govt Stock 2035
Sovereign Bonds | -5% ₹10 Cr 1,000,000 Muthoot Finance Limited
Debentures | -4% ₹8 Cr 750 Cholamandalam Investment And Finance Company Limited
Debentures | -3% ₹5 Cr 500 7.02% Govt Stock 2031
Sovereign Bonds | -3% ₹5 Cr 500,000 HDFC Bank Ltd (Financial Services)
Equity, Since 15 Jul 23 | HDFCBANK3% ₹5 Cr 66,974 7.1% Govt Stock 2029
Sovereign Bonds | -3% ₹5 Cr 500,000 4. Aditya Birla Sun Life Regular Savings Fund
Aditya Birla Sun Life Regular Savings Fund
Growth Launch Date 22 May 04 NAV (21 Jul 26) ₹70.2693 ↑ 0.04 (0.06 %) Net Assets (Cr) ₹1,490 on 30 Jun 26 Category Hybrid - Hybrid Debt AMC Birla Sun Life Asset Management Co Ltd Rating ☆☆☆☆☆ Risk Moderately High Expense Ratio 1.91 Sharpe Ratio -0.26 Information Ratio 0.24 Alpha Ratio 0.26 Min Investment 1,000 Min SIP Investment 500 Exit Load 0-365 Days (1%),365 Days and above(NIL) Growth of 10,000 investment over the years.
Date Value 30 Jun 21 ₹10,000 30 Jun 22 ₹10,440 30 Jun 23 ₹11,545 30 Jun 24 ₹12,865 30 Jun 25 ₹14,078 30 Jun 26 ₹14,683 Returns for Aditya Birla Sun Life Regular Savings Fund
absolute basis & more than 1 year are on CAGR (Compound Annual Growth Rate) basis. as on 11 Mar 22 Duration Returns 1 Month 1% 3 Month 1.9% 6 Month 3.1% 1 Year 4.3% 3 Year 8.2% 5 Year 7.9% 10 Year 15 Year Since launch 9.2% Historical performance (Yearly) on absolute basis
Year Returns 2025 7.1% 2024 10.5% 2023 9.6% 2022 5.3% 2021 13.4% 2020 9.2% 2019 5.8% 2018 -2.2% 2017 15.5% 2016 13.1% Fund Manager information for Aditya Birla Sun Life Regular Savings Fund
Name Since Tenure Mohit Sharma 31 Oct 24 1.67 Yr. Harshil Suvarnkar 22 Mar 21 5.28 Yr. Data below for Aditya Birla Sun Life Regular Savings Fund as on 30 Jun 26
Asset Allocation
Asset Class Value Cash 9.09% Equity 22.27% Debt 67.98% Other 0.66% Equity Sector Allocation
Sector Value Financial Services 7.61% Health Care 2.88% Consumer Cyclical 2.32% Basic Materials 2.06% Industrials 1.91% Communication Services 1.11% Technology 1.11% Utility 0.91% Consumer Defensive 0.9% Real Estate 0.81% Energy 0.66% Debt Sector Allocation
Sector Value Corporate 47.64% Government 23.07% Cash Equivalent 6.36% Credit Quality
Rating Value A 5.71% AA 30.85% AAA 63.45% Top Securities Holdings / Portfolio
Name Holding Value Quantity Cholamandalam Investment And Finance Company Limited
Debentures | -4% ₹56 Cr 5,500 6.68% Govt Stock 2040
Sovereign Bonds | -4% ₹55 Cr 5,750,000
↑ 5,750,000 Muthoot Finance Limited
Debentures | -3% ₹50 Cr 500
↑ 50 Jtpm Metal TRaders Limited
Debentures | -3% ₹46 Cr 4,316 Adani Power Limited
Debentures | -2% ₹35 Cr 3,500 Nuvama Wealth Finance Limited
Debentures | -2% ₹30 Cr 3,000 6.9% Govt Stock 2065
Sovereign Bonds | -2% ₹30 Cr 3,275,400
↑ 2,000,000 Bharti Telecom Limited
Debentures | -2% ₹30 Cr 3,000 Jubilant Bevco Limited
Debentures | -2% ₹28 Cr 2,500 ICICI Bank Ltd (Financial Services)
Equity, Since 31 Oct 18 | ICICIBANK2% ₹27 Cr 206,000
Risks in MIP Mutual Fund Scheme
Before investing in any of the above mentioned best monthly income plans, you must know the risks of a monthly income scheme.
No fixed assurance
It is a common belief that monthly income plan provides fixed income monthly. But, there is no guarantee of assured returns in such Mutual Funds. As this scheme also invests in equities, the returns depend on the fund performance and the market status.
Talk to our investment specialist
Dividends are declared through profits and not capital
Dividends for Monthly Income Scheme can be paid only from the additional income and not from the capital investment. For instance, if the Net Asset Value (NAV) of the fund increases from INR 10 to INR 13, the scheme can declare only out of INR 3 it has earned in capital appreciation. Therefore, if the scheme's NAV rises slowly or falls due to market moves, it may not declare dividends at all.
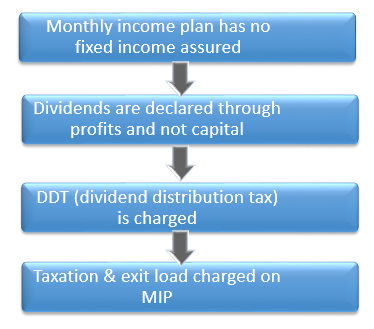
DDT is charged
If you opt for MIP with dividend option, the income that you earn periodically in the form of dividends is charged a Dividend Distribution Tax (DDT). So, the returns are not totally tax-free.
Taxation & Exit Load on MIP
The lock-in period of certain Monthly Income Schemes are as high as three years, so if the scheme is sold before the maturity period a certain exit load is applicable. Also, the MIPs invest most of their assets in debt instruments, so the taxation on them as per debt investment.
How to Invest in Monthly Income Plans Online?
Open Free Investment Account for Lifetime at Fincash.com.
Complete your Registration and KYC Process
Upload Documents (PAN, Aadhaar, etc.). And, You are Ready to Invest!
All efforts have been made to ensure the information provided here is accurate. However, no guarantees are made regarding correctness of data. Please verify with scheme information document before making any investment.
You Might Also Like
 Performance for 2025")
?")


AMFI Registration No. 112358 | CIN: U74999MH2016PTC282153
Shepard Technologies Pvt. Ltd. (with ARN code 112358) makes no warranties or representations, express or implied, on products offered through the platform. It accepts no liability for any damages or losses, however caused, in connection with the use of, or on the reliance of its product or related services. Terms and conditions of the website are applicable.
©2026 Shepard Technologies Private Limited. All Rights Reserved
You clarified nicely that MIP is not about regular monthly income as its returns works like regular mutual fund schemes. But is this MIP having risk with the capital too. Do we lose capital in case market performance is poor ie same as MFs
Best information is given for investment
Please advise for investment regards
Excellent understand ing