
In case of SIP or Systematic Investment plan, small amounts are deducted at regular intervals and being deposited in Mutual Fund schemes. Since in SIP the transaction takes investment is done at regular intervals, individuals can add billers for SIP payments after their first transaction so that the money gets deducted automatically afterwards.
Once the initial payment is done, people get a Unique Registration Number (URN) which they need to add it to their respective billers so that their SIP installment is done by itself. Only ensure that you have sufficient funds in your account.
So, let us see how to add Biller for SIP transaction in Axis Bank. There are four steps in the process of adding a biller in case of Axis Bank. These steps along with images are explained as follows.
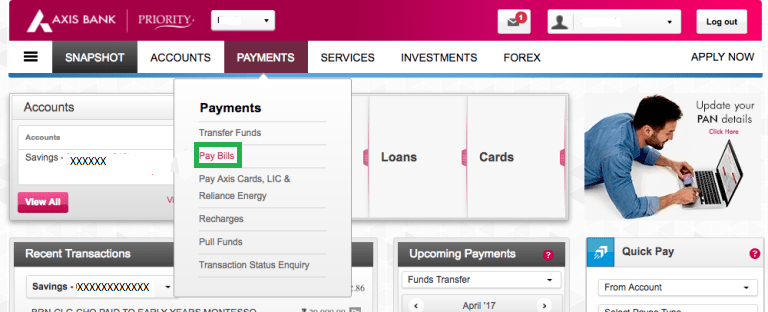
This is the first step while adding billers. Individuals first need to log in to their Axis Bank accounts. Once they log in, they need to click on Payments tab which is on the top of the screen. On Payments tab, you need to select Pay Bills option.
The image for this step is given below as follows where Pay Bills option is highlighted in Green.

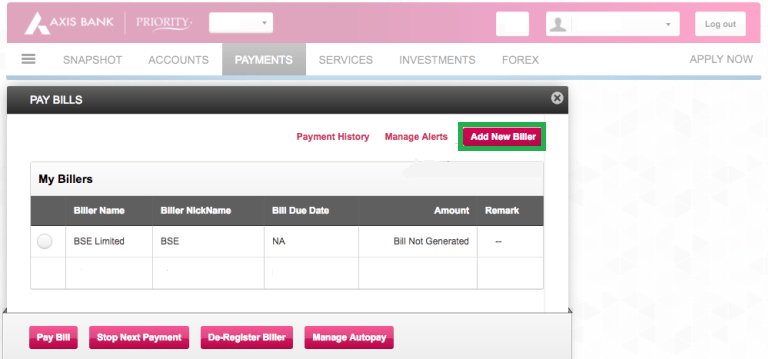
Once you click on the Pay Bills option; a new screen pops out. Here, you need to select the Add Biller Option. The image for this step is given below as follows where the Add Biller button is highlighted in Green.

Once you click on the Add Biller Section, a new window opens up wherein; you get can see various options on the left side. Here, you need to select the Mutual Funds icon. After selecting the Mutual Funds option, a drop-down stating Select Company gets enabled wherein you need to select BSE Limited. The image for this step is given below as follows where; Mutual Funds and BSE Limited are highlighted in Green.

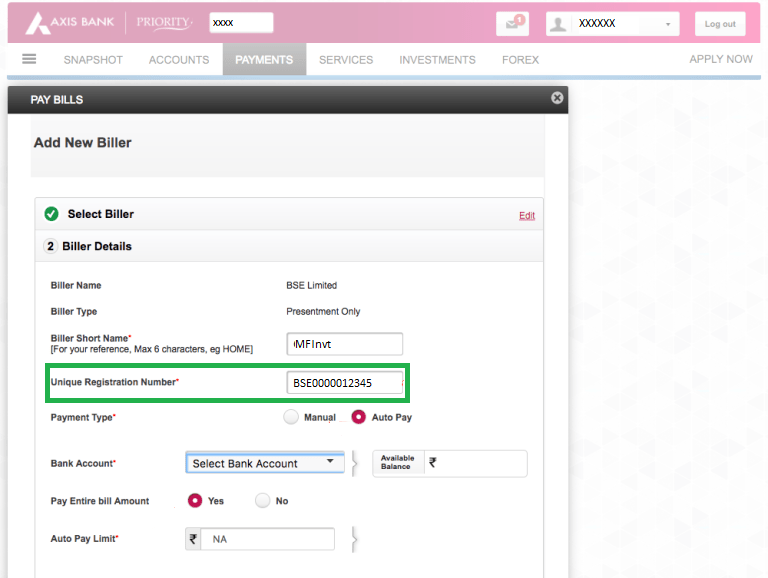
It is an important step in the process of adding biller for SIP payments in Axis Bank. Once you select BSE Limited and enter, a new screen opens where you need to enter your URN number for SIP. As mentioned earlier, customers receive their URN once they make the initial SIP payment through email from fincash.com. In case, if you do not receive the email, you can get URN by visiting the My SIPs Section on the website of Fincash.com. Along, with URN number they need to add other options such as Payment Type, Bank Account Number, Whether Pay Entire Bill Amount, and other options. After filling all the required columns and submitting the form, you will receive your biller confirmation. These image for this step is given below where the URN box is highlighted in Green.

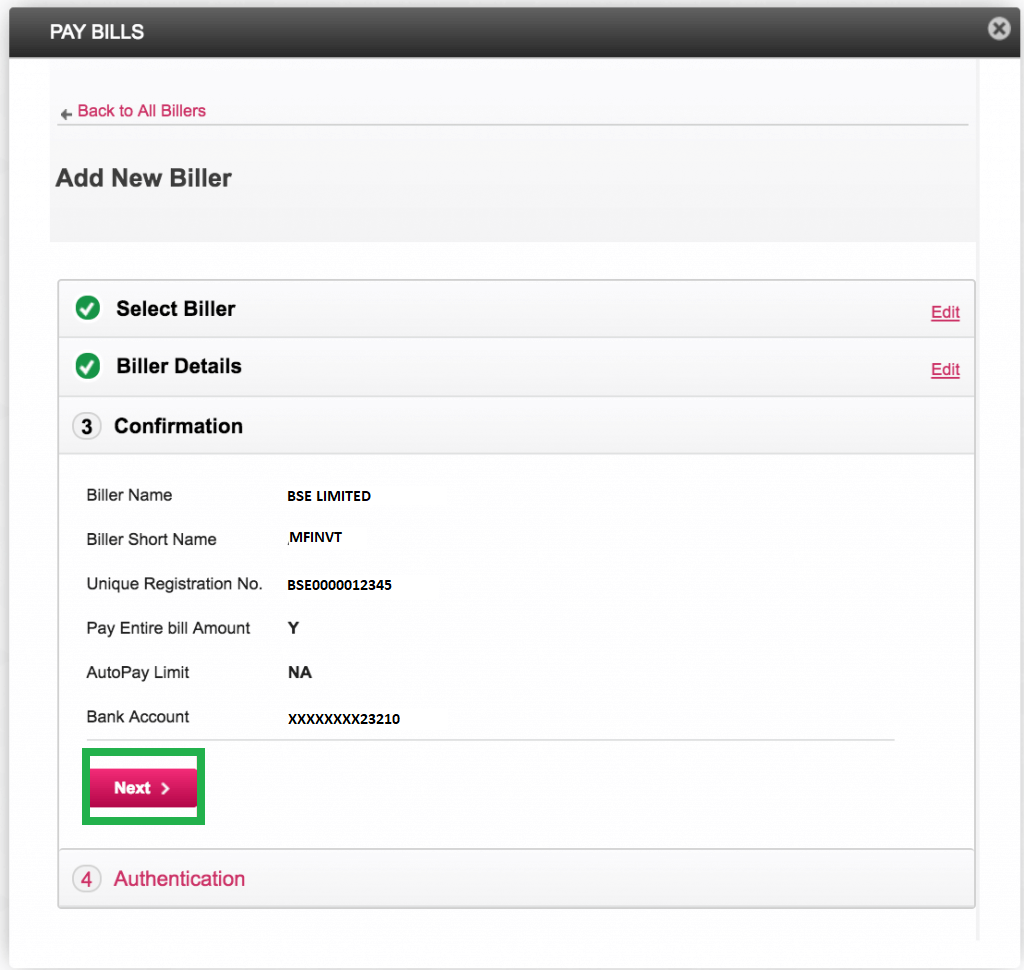
Once you click on next in the previous step, a new screen opens up in which you can verify the details entered. Once you check and verify all the details, then you need to click on Next button at the bottom of the screen. The image for this step is given below where Next button is highlighted in Green.
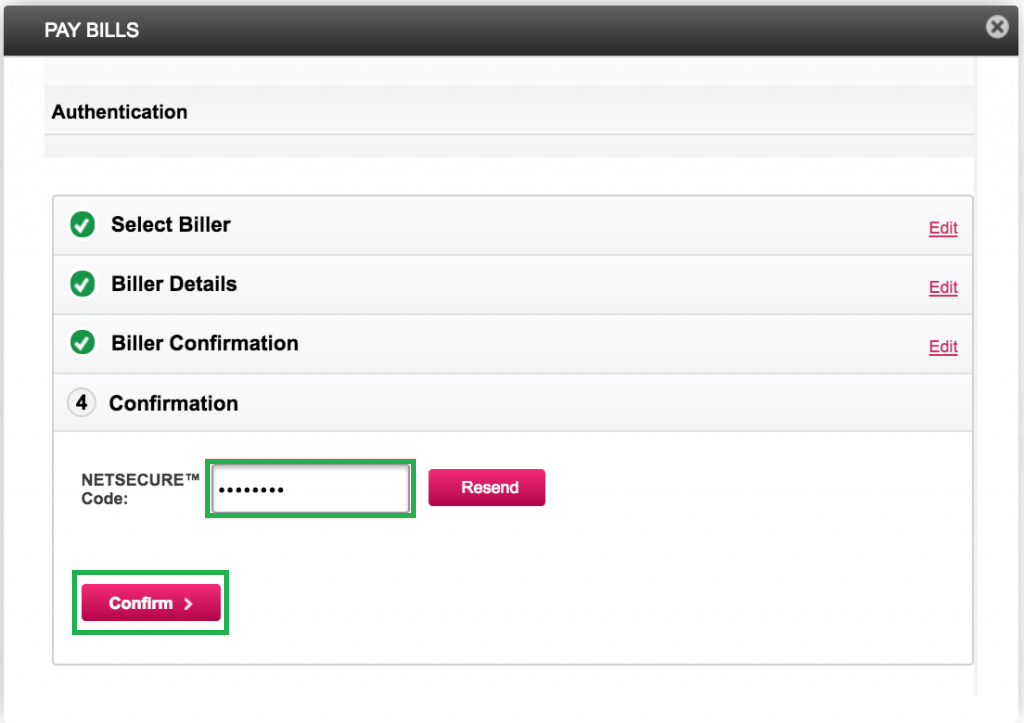
Once you click on Next button in the previous step, you are redirected to a new page in which you need to enter your OTP or NETSECURE Code. you will receive this code on your registerted mobile number or your registered email address. Once you enter this code, you need to click on Confirm button at the bottom of the screen. The image for this screen is given below where the NETSECURE Code box is and Confirm button both are highlighted in Green.
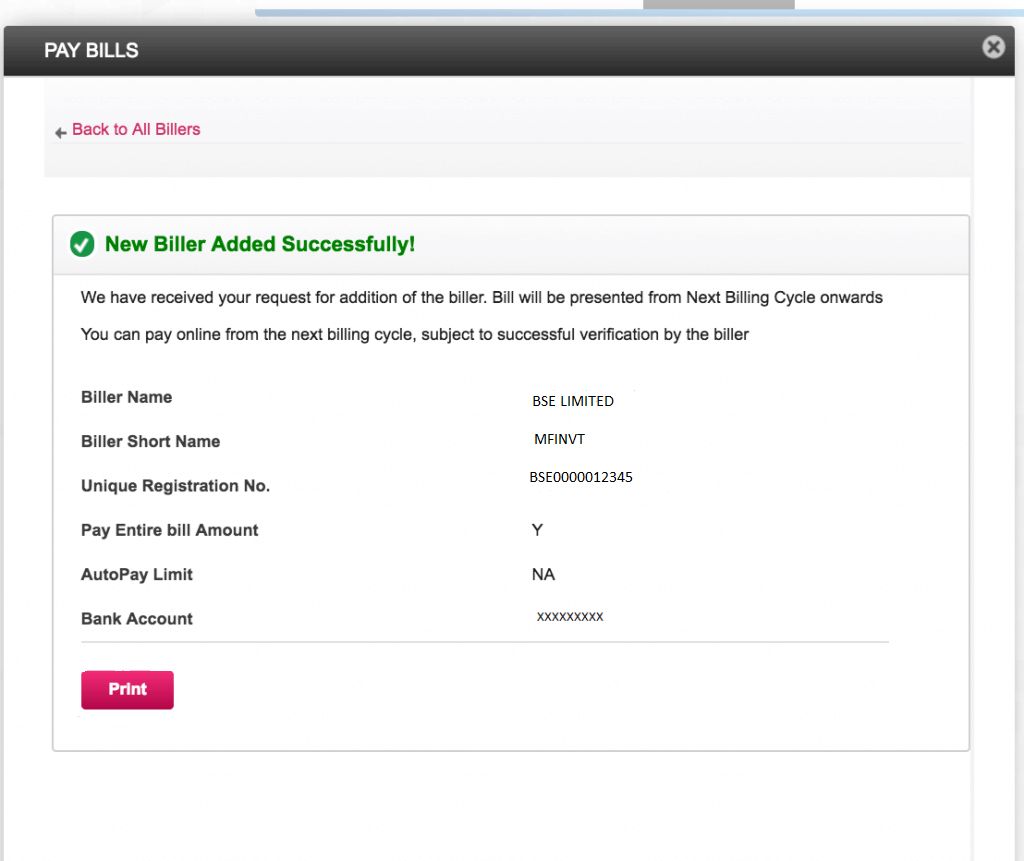
In this step you get the final confirmation stating that the biller has been added successfully. It is the final step in the biller addition process of Axis Bank. Individuals, if required, can take a print of this step and keep for their confirmation. The image for this step is given below.

Thus, from the above-mentioned steps, we can say that to add a biller in Axis Bank for SIP payments is simple.
Here are some of the recommend SIPs as per 5 year returns and AUM of more than INR 500 Cr: 
Fund NAV Net Assets (Cr) Min SIP Investment 3 MO (%) 6 MO (%) 1 YR (%) 3 YR (%) 5 YR (%) 2024 (%) ICICI Prudential Infrastructure Fund Growth  ₹201.31  
 ↑ 1.54 ₹7,645  100  3 12.1 8.1 28.2 37.4 27.4 HDFC Infrastructure Fund Growth  ₹48.514  
 ↑ 0.24 ₹2,483  300  1.9 9.8 5 28.4 34.7 23 Motilal Oswal Midcap 30 Fund  Growth  ₹105.014  
 ↑ 1.35 ₹34,780  500  3.8 12.9 1 26.4 33.4 57.1 SBI PSU Fund Growth  ₹33.3162  
 ↑ 0.26 ₹5,179  500  4.8 9 7.5 30.1 33.1 23.5 Franklin Build India Fund Growth  ₹145.991  
 ↑ 1.42 ₹2,884  500  3.5 11.1 6.4 27.5 33 27.8 Note: Returns up to 1 year are on absolute basis & more than 1 year are on CAGR basis. as on 27 Oct 25   Research Highlights & Commentary of 5 Funds showcased
Commentary ICICI Prudential Infrastructure Fund HDFC Infrastructure Fund Motilal Oswal Midcap 30 Fund  SBI PSU Fund Franklin Build India Fund Point 1 Upper mid AUM (₹7,645 Cr). Bottom quartile AUM (₹2,483 Cr). Highest AUM (₹34,780 Cr). Lower mid AUM (₹5,179 Cr). Bottom quartile AUM (₹2,884 Cr). Point 2 Oldest track record among peers (20 yrs). Established history (17+ yrs). Established history (11+ yrs). Established history (15+ yrs). Established history (16+ yrs). Point 3 Rating: 3★ (upper mid). Rating: 3★ (lower mid). Rating: 3★ (bottom quartile). Rating: 2★ (bottom quartile). Top rated. Point 4 Risk profile: High. Risk profile: High. Risk profile: Moderately High. Risk profile: High. Risk profile: High. Point 5 5Y return: 37.45% (top quartile). 5Y return: 34.65% (upper mid). 5Y return: 33.36% (lower mid). 5Y return: 33.13% (bottom quartile). 5Y return: 33.01% (bottom quartile). Point 6 3Y return: 28.19% (lower mid). 3Y return: 28.40% (upper mid). 3Y return: 26.44% (bottom quartile). 3Y return: 30.12% (top quartile). 3Y return: 27.48% (bottom quartile). Point 7 1Y return: 8.10% (top quartile). 1Y return: 4.97% (bottom quartile). 1Y return: 1.03% (bottom quartile). 1Y return: 7.50% (upper mid). 1Y return: 6.41% (lower mid). Point 8 Alpha: 0.00 (upper mid). Alpha: 0.00 (lower mid). Alpha: 4.99 (top quartile). Alpha: -0.35 (bottom quartile). Alpha: 0.00 (bottom quartile). Point 9 Sharpe: -0.48 (upper mid). Sharpe: -0.64 (lower mid). Sharpe: -0.18 (top quartile). Sharpe: -0.81 (bottom quartile). Sharpe: -0.64 (bottom quartile). Point 10 Information ratio: 0.00 (upper mid). Information ratio: 0.00 (lower mid). Information ratio: 0.57 (top quartile). Information ratio: -0.37 (bottom quartile). Information ratio: 0.00 (bottom quartile). ICICI Prudential Infrastructure Fund
HDFC Infrastructure Fund
Motilal Oswal Midcap 30 Fund 
SBI PSU Fund
Franklin Build India Fund
 To generate capital appreciation and income distribution to unit holders by investing predominantly in equity/equity related securities of the companies belonging to the infrastructure development and balance in debt securities and money market instruments.   Below is the key information for ICICI Prudential Infrastructure Fund   Returns up to 1 year are on   To seek long-term capital appreciation by investing predominantly in equity and equity related securities of companies engaged in or expected to benefit from growth and development of infrastructure.   Research Highlights for HDFC Infrastructure Fund   Below is the key information for HDFC Infrastructure Fund   Returns up to 1 year are on   (Erstwhile Motilal Oswal MOSt Focused Midcap 30 Fund)   The investment objective of the Scheme is to achieve long term capital appreciation by investing in a maximum of 30 quality mid-cap companies having long-term competitive advantages and potential for growth. However, there can be no assurance or guarantee that the investment objective of the Scheme would be achieved.   Research Highlights for Motilal Oswal Midcap 30 Fund    Below is the key information for Motilal Oswal Midcap 30 Fund    Returns up to 1 year are on   The objective of the scheme would be to provide investors with opportunities for long-term growth in capital along with the liquidity of an open-ended scheme through an active management of investments in a diversified basket of equity stocks of domestic Public Sector Undertakings and in debt and money market instruments issued by PSUs AND others.   Research Highlights for SBI PSU Fund   Below is the key information for SBI PSU Fund   Returns up to 1 year are on   The Scheme seeks to achieve capital appreciation by investing in companies engaged directly or indirectly in infrastructure related activities.   Research Highlights for Franklin Build India Fund   Below is the key information for Franklin Build India Fund   Returns up to 1 year are on 1. ICICI Prudential Infrastructure Fund
ICICI Prudential Infrastructure Fund 
 Growth Launch Date   31 Aug 05  NAV (27 Oct 25)   ₹201.31  ↑ 1.54   (0.77 %)  Net Assets (Cr)   ₹7,645 on 31 Aug 25  Category  Equity - Sectoral AMC   ICICI Prudential Asset Management Company Limited  Rating  ☆☆☆ Risk  High Expense Ratio  1.89 Sharpe Ratio  -0.48 Information Ratio  0 Alpha Ratio  0 Min Investment   5,000  Min SIP Investment   100  Exit Load   0-1 Years (1%),1 Years and above(NIL)   Growth of 10,000 investment over the years. 
Date Value 30 Sep 20 ₹10,000 30 Sep 21 ₹20,062 30 Sep 22 ₹22,524 30 Sep 23 ₹31,255 30 Sep 24 ₹50,301 30 Sep 25 ₹48,047  Returns for ICICI Prudential Infrastructure Fund
absolute basis & more than 1 year are on CAGR (Compound Annual Growth Rate) basis. as on 27 Oct 25 Duration Returns 1 Month  4.3%  3 Month  3%  6 Month  12.1%  1 Year  8.1%  3 Year  28.2%  5 Year  37.4%  10 Year    15 Year    Since launch  16.1%   Historical performance (Yearly) on absolute basis 
Year Returns 2024  27.4%  2023  44.6%  2022  28.8%  2021  50.1%  2020  3.6%  2019  2.6%  2018  -14%  2017  40.8%  2016  2%  2015  -3.4%   Fund Manager information for ICICI Prudential Infrastructure Fund 
Name Since Tenure Ihab Dalwai 3 Jun 17 8.33 Yr. Sharmila D’mello 30 Jun 22 3.26 Yr. Data below for ICICI Prudential Infrastructure Fund as on 31 Aug 25 
 Equity Sector Allocation 
Sector Value Industrials 36.47% Basic Materials 15.25% Financial Services 14.68% Utility 10.24% Energy 9.47% Real Estate 2.93% Consumer Cyclical 1.84% Communication Services 1.67%  Asset Allocation 
Asset Class Value Cash 7.43% Equity 92.57%  Top Securities Holdings / Portfolio 
Name Holding Value Quantity  Larsen & Toubro Ltd (Industrials) 
Equity, Since 30 Nov 09 | LT9% ₹674 Cr 1,843,204 
 ↓ -155,750  NTPC Ltd (Utilities) 
Equity, Since 29 Feb 16 | 5325554% ₹352 Cr 10,329,473 
 ↓ -750,000  Vedanta Ltd (Basic Materials) 
Equity, Since 31 Jul 24 | 5002954% ₹293 Cr 6,279,591  Reliance Industries Ltd (Energy) 
Equity, Since 31 Jul 23 | RELIANCE4% ₹277 Cr 2,029,725  NCC Ltd (Industrials) 
Equity, Since 31 Aug 21 | NCC3% ₹271 Cr 13,053,905  Adani Ports & Special Economic Zone Ltd (Industrials) 
Equity, Since 31 May 24 | ADANIPORTS3% ₹260 Cr 1,854,934 
 ↓ -413,725  Kalpataru Projects International Ltd (Industrials) 
Equity, Since 30 Sep 06 | KPIL3% ₹226 Cr 1,803,566  Axis Bank Ltd (Financial Services) 
Equity, Since 31 Dec 20 | 5322153% ₹226 Cr 1,996,057  AIA Engineering Ltd (Industrials) 
Equity, Since 28 Feb 21 | AIAENG3% ₹202 Cr 660,770  CESC Ltd (Utilities) 
Equity, Since 30 Jun 23 | CESC2% ₹189 Cr 11,700,502 2. HDFC Infrastructure Fund
HDFC Infrastructure Fund 
 Growth Launch Date   10 Mar 08  NAV (27 Oct 25)   ₹48.514  ↑ 0.24   (0.51 %)  Net Assets (Cr)   ₹2,483 on 31 Aug 25  Category  Equity - Sectoral AMC   HDFC Asset Management Company Limited  Rating  ☆☆☆ Risk  High Expense Ratio  2.06 Sharpe Ratio  -0.64 Information Ratio  0 Alpha Ratio  0 Min Investment   5,000  Min SIP Investment   300  Exit Load   0-1 Years (1%),1 Years and above(NIL)   Growth of 10,000 investment over the years. 
Date Value 30 Sep 20 ₹10,000 30 Sep 21 ₹18,908 30 Sep 22 ₹20,652 30 Sep 23 ₹29,739 30 Sep 24 ₹46,335 30 Sep 25 ₹43,823  Returns for HDFC Infrastructure Fund
absolute basis & more than 1 year are on CAGR (Compound Annual Growth Rate) basis. as on 27 Oct 25 Duration Returns 1 Month  3.1%  3 Month  1.9%  6 Month  9.8%  1 Year  5%  3 Year  28.4%  5 Year  34.7%  10 Year    15 Year    Since launch     Historical performance (Yearly) on absolute basis 
Year Returns 2024  23%  2023  55.4%  2022  19.3%  2021  43.2%  2020  -7.5%  2019  -3.4%  2018  -29%  2017  43.3%  2016  -1.9%  2015  -2.5%   Fund Manager information for HDFC Infrastructure Fund 
Name Since Tenure Srinivasan Ramamurthy 12 Jan 24 1.72 Yr. Dhruv Muchhal 22 Jun 23 2.28 Yr. Data below for HDFC Infrastructure Fund as on 31 Aug 25 
 Equity Sector Allocation 
Sector Value Industrials 38.53% Financial Services 19.18% Basic Materials 10.34% Utility 7.05% Energy 6.49% Communication Services 3.63% Real Estate 2.48% Health Care 1.76% Technology 1.57% Consumer Cyclical 0.49%  Asset Allocation 
Asset Class Value Cash 8.47% Equity 91.53%  Top Securities Holdings / Portfolio 
Name Holding Value Quantity  ICICI Bank Ltd (Financial Services) 
Equity, Since 31 Oct 09 | 5321746% ₹148 Cr 1,100,000 
 ↓ -200,000  Larsen & Toubro Ltd (Industrials) 
Equity, Since 30 Jun 12 | LT6% ₹139 Cr 380,000  HDFC Bank Ltd (Financial Services) 
Equity, Since 31 Aug 23 | HDFCBANK5% ₹133 Cr 1,400,000  Kalpataru Projects International Ltd (Industrials) 
Equity, Since 31 Jan 23 | 5222874% ₹95 Cr 758,557 
 ↑ 272  J Kumar Infraprojects Ltd (Industrials) 
Equity, Since 31 Oct 15 | JKIL4% ₹89 Cr 1,403,084 
 ↑ 3,084  InterGlobe Aviation Ltd (Industrials) 
Equity, Since 31 Dec 21 | INDIGO3% ₹84 Cr 150,000  NTPC Ltd (Utilities) 
Equity, Since 31 Dec 17 | 5325553% ₹75 Cr 2,200,646 
 ↑ 646  Reliance Industries Ltd (Energy) 
Equity, Since 31 May 24 | RELIANCE3% ₹68 Cr 500,000  Bharti Airtel Ltd (Communication Services) 
Equity, Since 30 Sep 20 | BHARTIARTL3% ₹66 Cr 350,000  State Bank of India (Financial Services) 
Equity, Since 31 Mar 08 | SBIN2% ₹61 Cr 704,361 3. Motilal Oswal Midcap 30 Fund 
Motilal Oswal Midcap 30 Fund  
 Growth Launch Date   24 Feb 14  NAV (27 Oct 25)   ₹105.014  ↑ 1.35   (1.30 %)  Net Assets (Cr)   ₹34,780 on 31 Aug 25  Category  Equity - Mid Cap AMC   Motilal Oswal Asset Management Co. Ltd  Rating  ☆☆☆ Risk  Moderately High Expense Ratio  1.56 Sharpe Ratio  -0.18 Information Ratio  0.57 Alpha Ratio  4.99 Min Investment   5,000  Min SIP Investment   500  Exit Load   0-1 Years (1%),1 Years and above(NIL)   Growth of 10,000 investment over the years. 
Date Value 30 Sep 20 ₹10,000 30 Sep 21 ₹16,771 30 Sep 22 ₹20,631 30 Sep 23 ₹24,973 30 Sep 24 ₹42,904 30 Sep 25 ₹39,390  Returns for Motilal Oswal Midcap 30 Fund 
absolute basis & more than 1 year are on CAGR (Compound Annual Growth Rate) basis. as on 27 Oct 25 Duration Returns 1 Month  5.5%  3 Month  3.8%  6 Month  12.9%  1 Year  1%  3 Year  26.4%  5 Year  33.4%  10 Year    15 Year    Since launch  22.3%   Historical performance (Yearly) on absolute basis 
Year Returns 2024  57.1%  2023  41.7%  2022  10.7%  2021  55.8%  2020  9.3%  2019  9.7%  2018  -12.7%  2017  30.8%  2016  5.2%  2015  16.5%   Fund Manager information for Motilal Oswal Midcap 30 Fund  
Name Since Tenure Ajay Khandelwal 1 Oct 24 1 Yr. Niket Shah 1 Jul 20 5.25 Yr. Rakesh Shetty 22 Nov 22 2.86 Yr. Sunil Sawant 1 Jul 24 1.25 Yr. Data below for Motilal Oswal Midcap 30 Fund  as on 31 Aug 25 
 Equity Sector Allocation 
Sector Value Technology 35.03% Consumer Cyclical 23.94% Industrials 21.59% Communication Services 3.22% Financial Services 3.15% Real Estate 2.39% Health Care 1.69%  Asset Allocation 
Asset Class Value Cash 8.99% Equity 91.01%  Top Securities Holdings / Portfolio 
Name Holding Value Quantity  Dixon Technologies (India) Ltd (Technology) 
Equity, Since 31 Mar 23 | DIXON10% ₹3,326 Cr 2,037,521 
 ↓ -62,478  Eternal Ltd (Consumer Cyclical) 
Equity, Since 31 Aug 25 | 5433209% ₹3,255 Cr 100,000,000  Coforge Ltd (Technology) 
Equity, Since 31 Mar 23 | COFORGE9% ₹3,142 Cr 19,750,000  Persistent Systems Ltd (Technology) 
Equity, Since 31 Jan 23 | PERSISTENT8% ₹2,894 Cr 6,000,000 
 ↑ 500,000  One97 Communications Ltd (Technology) 
Equity, Since 30 Sep 24 | 5433968% ₹2,810 Cr 25,000,000  Kalyan Jewellers India Ltd (Consumer Cyclical) 
Equity, Since 29 Feb 24 | KALYANKJIL8% ₹2,726 Cr 60,000,000  Trent Ltd (Consumer Cyclical) 
Equity, Since 30 Nov 24 | 5002517% ₹2,339 Cr 4,999,694 
 ↓ -1,000,306  Polycab India Ltd (Industrials) 
Equity, Since 30 Sep 23 | POLYCAB7% ₹2,295 Cr 3,150,000 
 ↑ 100,000  Kaynes Technology India Ltd (Industrials) 
Equity, Since 30 Jun 25 | KAYNES5% ₹1,657 Cr 2,350,000 
 ↑ 250,000  KEI Industries Ltd (Industrials) 
Equity, Since 30 Nov 24 | KEI5% ₹1,625 Cr 4,000,000 
 ↑ 250,000 4. SBI PSU Fund
SBI PSU Fund 
 Growth Launch Date   7 Jul 10  NAV (27 Oct 25)   ₹33.3162  ↑ 0.26   (0.79 %)  Net Assets (Cr)   ₹5,179 on 31 Aug 25  Category  Equity - Sectoral AMC   SBI Funds Management Private Limited  Rating  ☆☆ Risk  High Expense Ratio  1.89 Sharpe Ratio  -0.81 Information Ratio  -0.37 Alpha Ratio  -0.35 Min Investment   5,000  Min SIP Investment   500  Exit Load   0-1 Years (1%),1 Years and above(NIL)   Growth of 10,000 investment over the years. 
Date Value 30 Sep 20 ₹10,000 30 Sep 21 ₹16,196 30 Sep 22 ₹17,561 30 Sep 23 ₹25,841 30 Sep 24 ₹42,766 30 Sep 25 ₹40,703  Returns for SBI PSU Fund
absolute basis & more than 1 year are on CAGR (Compound Annual Growth Rate) basis. as on 27 Oct 25 Duration Returns 1 Month  5.3%  3 Month  4.8%  6 Month  9%  1 Year  7.5%  3 Year  30.1%  5 Year  33.1%  10 Year    15 Year    Since launch  8.2%   Historical performance (Yearly) on absolute basis 
Year Returns 2024  23.5%  2023  54%  2022  29%  2021  32.4%  2020  -10%  2019  6%  2018  -23.8%  2017  21.9%  2016  16.2%  2015  -11.1%   Fund Manager information for SBI PSU Fund 
Name Since Tenure Rohit Shimpi 1 Jun 24 1.33 Yr. Data below for SBI PSU Fund as on 31 Aug 25 
 Equity Sector Allocation 
Sector Value Financial Services 36.21% Utility 29.89% Energy 13.58% Industrials 12.34% Basic Materials 5.79%  Asset Allocation 
Asset Class Value Cash 2.18% Equity 97.82%  Top Securities Holdings / Portfolio 
Name Holding Value Quantity  State Bank of India (Financial Services) 
Equity, Since 31 Jul 10 | SBIN16% ₹866 Cr 9,927,500  Bharat Electronics Ltd (Industrials) 
Equity, Since 30 Jun 24 | BEL9% ₹524 Cr 12,975,000  NTPC Ltd (Utilities) 
Equity, Since 31 Jul 10 | 5325559% ₹495 Cr 14,543,244  Power Grid Corp Of India Ltd (Utilities) 
Equity, Since 31 Jul 10 | 5328988% ₹463 Cr 16,535,554  GAIL (India) Ltd (Utilities) 
Equity, Since 31 May 24 | 5321558% ₹454 Cr 25,750,000  Bharat Petroleum Corp Ltd (Energy) 
Equity, Since 31 Aug 24 | 5005476% ₹329 Cr 9,700,000  Bank of Baroda (Financial Services) 
Equity, Since 31 Aug 24 | 5321345% ₹284 Cr 11,000,000  NMDC Ltd (Basic Materials) 
Equity, Since 31 Oct 23 | 5263714% ₹213 Cr 27,900,000  Indian Bank (Financial Services) 
Equity, Since 30 Jun 21 | 5328143% ₹182 Cr 2,427,235  Oil India Ltd (Energy) 
Equity, Since 31 Mar 24 | OIL3% ₹159 Cr 3,850,000 5. Franklin Build India Fund
Franklin Build India Fund 
 Growth Launch Date   4 Sep 09  NAV (27 Oct 25)   ₹145.991  ↑ 1.42   (0.98 %)  Net Assets (Cr)   ₹2,884 on 31 Aug 25  Category  Equity - Sectoral AMC   Franklin Templeton Asst Mgmt(IND)Pvt Ltd  Rating  ☆☆☆☆☆ Risk  High Expense Ratio  2.01 Sharpe Ratio  -0.64 Information Ratio  0 Alpha Ratio  0 Min Investment   5,000  Min SIP Investment   500  Exit Load   0-1 Years (1%),1 Years and above(NIL)   Growth of 10,000 investment over the years. 
Date Value 30 Sep 20 ₹10,000 30 Sep 21 ₹19,616 30 Sep 22 ₹20,506 30 Sep 23 ₹28,515 30 Sep 24 ₹45,123 30 Sep 25 ₹42,883  Returns for Franklin Build India Fund
absolute basis & more than 1 year are on CAGR (Compound Annual Growth Rate) basis. as on 27 Oct 25 Duration Returns 1 Month  4%  3 Month  3.5%  6 Month  11.1%  1 Year  6.4%  3 Year  27.5%  5 Year  33%  10 Year    15 Year    Since launch  18.1%   Historical performance (Yearly) on absolute basis 
Year Returns 2024  27.8%  2023  51.1%  2022  11.2%  2021  45.9%  2020  5.4%  2019  6%  2018  -10.7%  2017  43.3%  2016  8.4%  2015  2.1%   Fund Manager information for Franklin Build India Fund 
Name Since Tenure Ajay Argal 18 Oct 21 3.96 Yr. Kiran Sebastian 7 Feb 22 3.65 Yr. Sandeep Manam 18 Oct 21 3.96 Yr. Data below for Franklin Build India Fund as on 31 Aug 25 
 Equity Sector Allocation 
Sector Value Industrials 35.44% Utility 14.2% Financial Services 13.18% Energy 12.89% Communication Services 7.62% Basic Materials 5.03% Real Estate 3.16% Consumer Cyclical 2.74% Technology 2.21%  Asset Allocation 
Asset Class Value Cash 3.52% Equity 96.48%  Top Securities Holdings / Portfolio 
Name Holding Value Quantity  Larsen & Toubro Ltd (Industrials) 
Equity, Since 29 Feb 20 | LT8% ₹243 Cr 665,000  InterGlobe Aviation Ltd (Industrials) 
Equity, Since 29 Feb 20 | INDIGO6% ₹176 Cr 315,000 
 ↑ 15,000  Reliance Industries Ltd (Energy) 
Equity, Since 31 Oct 21 | RELIANCE6% ₹164 Cr 1,200,000  Oil & Natural Gas Corp Ltd (Energy) 
Equity, Since 30 Jun 19 | 5003126% ₹163 Cr 6,825,000  ICICI Bank Ltd (Financial Services) 
Equity, Since 31 Mar 12 | ICICIBANK5% ₹162 Cr 1,200,000  NTPC Ltd (Utilities) 
Equity, Since 30 Nov 16 | 5325555% ₹148 Cr 4,350,000  Bharti Airtel Ltd (Communication Services) 
Equity, Since 30 Sep 09 | BHARTIARTL5% ₹133 Cr 710,000  Axis Bank Ltd (Financial Services) 
Equity, Since 31 Mar 12 | 5322154% ₹113 Cr 1,000,000  Power Grid Corp Of India Ltd (Utilities) 
Equity, Since 28 Feb 21 | 5328983% ₹101 Cr 3,600,000  GAIL (India) Ltd (Utilities) 
Equity, Since 31 Jan 25 | 5321553% ₹92 Cr 5,200,000 
 ↑ 400,000 
In case of any further queries, you can contact us on 8451864111 on any working day between 9.30am to 6.30 pm or write a mail to us anytime at support@fincash.com or chat with us by logging onto our website www.fincash.com.
Research Highlights for ICICI Prudential Infrastructure Fund