fincash logo SOLUTIONS
EXPLORE FUNDS
CALCULATORS
LOG IN
SIGN UP

Fincash » Add Biller for SIP Transaction in Union Bank of India

How to Add Biller for SIP Transactions in Union Bank of India?

Updated on July 19, 2024 , 19202 views

People who invest in Mutual Fund can choose SIP or Systematic Investment plan as a mode of investment. In this mode, people need to pay a small amount at regular intervals in the scheme to attain their objectives. Through SIP, people can ensure that their current budget doesn’t get hampered and their objectives are also achieved. With the advancements in technology, people can do their SIP through Net Banking channel.

In case of Opting for Net Banking, individuals receive a Unique Registration Number or URN once their first payment is done. They need to add this URN to the biller through Net Banking so that their future SIP payments gets automated. Only, you need to ensure that there are adequate funds in the Bank account. The process of adding biller to net banking is different for each bank. So, let us check the process of adding biller for SIP transactions in case of Union Bank of India which can be done in six simple steps.

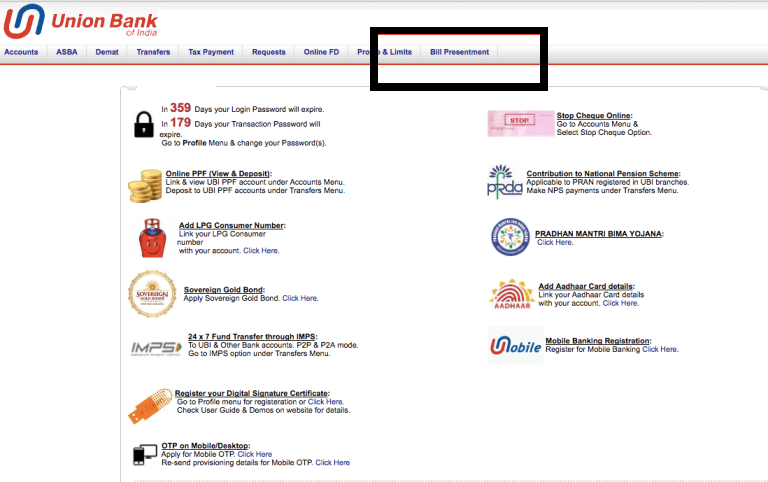
Login & Select Bill Presentment Tab

This is the primary step in case of adding a biller. First, you need to log onto your net banking by entering your credentials. Once you log in, you can see your home screen. Here, on the top of the screen, you can see various tabs such as Accounts, Demat, Transfers, and much more. Out of this, you need to select on Bill Presentment tab. The image for this step is given below where Bill Presentment tab is highlighted in Black.

Step 1

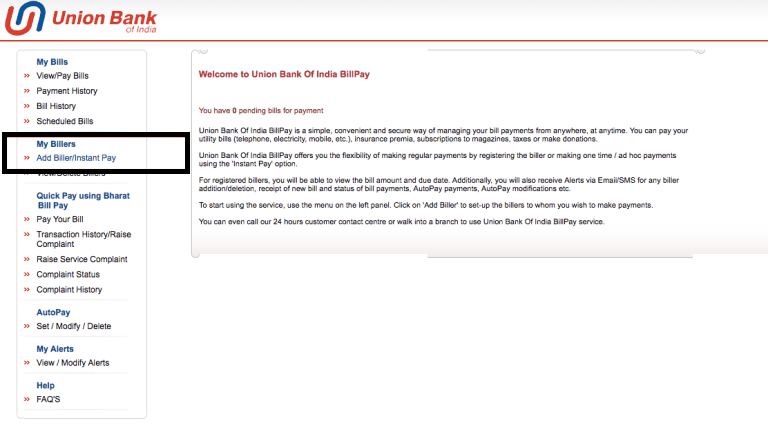
Select the Option Add Biller/Instant Pay

Once you click on Bill Presentment tab, a new screen opens up. In this screen, you can find various options on the left side of the screen. Here, you need to check for the option Add Biller/ Instant Pay under the heading My Billers. The image for this screen is given below where the Add Biller/ Instant Pay and My Billers option both are highlighted in Black.

Step 2

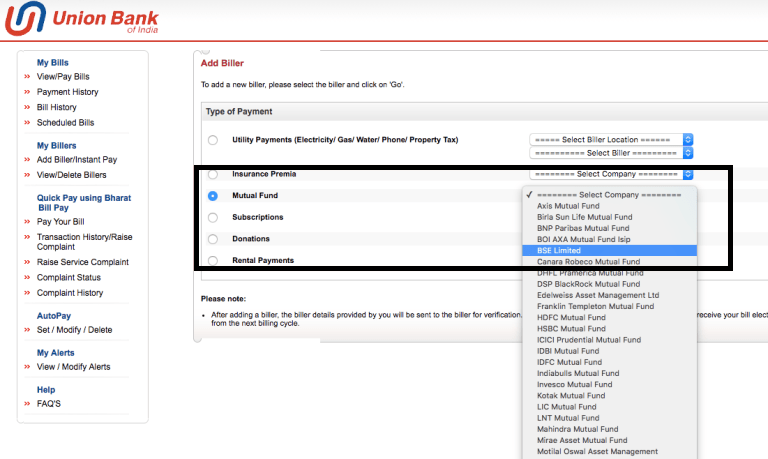
Choose BSE Limited Under Mutual Funds

This is the third step in the process of adding biller. In this step, once you click on Add Biller/ Instant Pay option; a new pop up opens up in which there are various payments options such as Utility Payments, insurance Premia, and others. Here, you need to select the Mutual Fund Option. Once you click on Mutual Fund option, a drop-down next to it gets enables where you need to select the option of BSE Limited. Once you click on BSE Limited, you need to Click on Go. The image for this step is given below where Mutual Funds and BSE Limited option are highlighted in Black.

Step 3

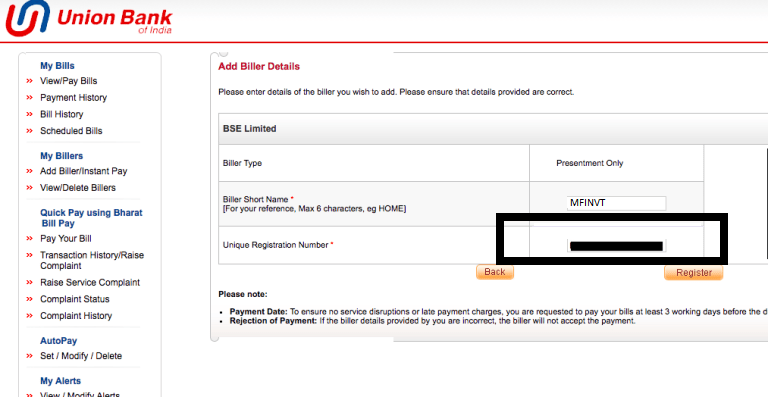
Add Unique Registration Number

After clicking on Go in the previous step, a new screen opens where you are required to enter your URN number. This URN number is the one which you receive in your emails after making payments of the first SIP. If you do not receive email for SIP registration then don't worry. You can access the same from the website of www.fincash.com by logging in and visiting the My SIPs Section. You also need to add a short name to your biller. Once you add both the data, you need to click on Register. The image for the same is given below where the URN is highlighted in Black.

Step 4

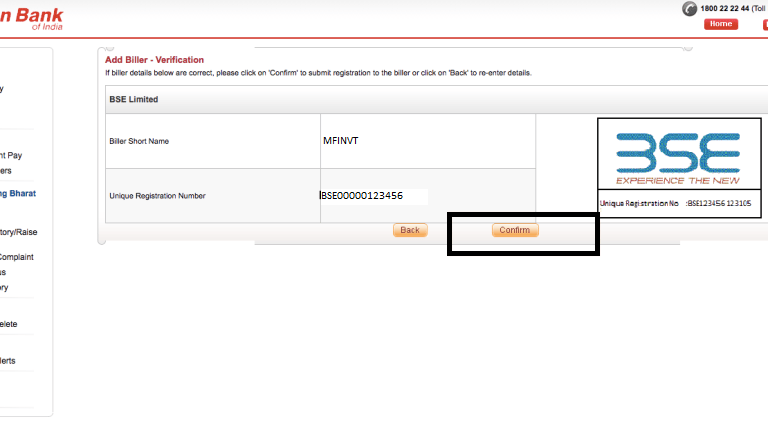
Summary of Data Filled

Once you click on Register, a new screen gets opened where you can see the relevant filled information. Once you verify and check it, you can click on Confirm. If you feel that there is some mistake in the data, then you need to click on Back. The image for this step is given below as follows where the Confirm button is highlighted in Black.

Step 5

Confirmation

This is the last step in the process of biller addition in Union Bank of India. Once you click on Confirm option a new screen pops out which shows that the biller is successfully registered. The image for this step is as follows where the Congrats message is highlighted in Green.

Step 6

Therefore, through the above-mentioned steps, we can conclude that to add a biller in case of Union Bank of India is easy.

Best SIPs to Invest to Earn Better Returns

Here are some of the recommend SIPs as per 5 year returns and AUM of more than INR 500 Cr:

FundNAVNet Assets (Cr)Min SIP Investment3 MO (%)6 MO (%)1 YR (%)3 YR (%)5 YR (%)2023 (%)
Nippon India Small Cap Fund Growth ₹171.566
↓ -3.57
₹56,469 100 17.221.951.431.135.848.9
Motilal Oswal Midcap 30 Fund  Growth ₹96.4067
↓ -1.32
₹12,628 500 19.230.56337.732.641.7
Kotak Small Cap Fund Growth ₹266.55
↓ -4.65
₹16,707 1,000 17.720.341.42231.734.8
Invesco India Infrastructure Fund Growth ₹65.59
↓ -1.86
₹1,470 500 1731.271.53231.551.1
Invesco India PSU Equity Fund Growth ₹67.52
↓ -1.89
₹1,363 500 19.136.687.13931.454.5
Note: Returns up to 1 year are on absolute basis & more than 1 year are on CAGR basis. as on 19 Jul 24

1. Nippon India Small Cap Fund

The primary investment objective of the scheme is to generate long term capital appreciation by investing predominantly in equity and equity related instruments of small cap companies and the secondary objective is to generate consistent returns by investing in debt and money market securities.

Nippon India Small Cap Fund is a Equity - Small Cap fund was launched on 16 Sep 10. It is a fund with Moderately High risk and has given a CAGR/Annualized return of 22.8% since its launch.  Ranked 6 in Small Cap category.  Return for 2023 was 48.9% , 2022 was 6.5% and 2021 was 74.3% .

Below is the key information for Nippon India Small Cap Fund

Nippon India Small Cap Fund
Growth
Launch Date 16 Sep 10
NAV (19 Jul 24) ₹171.566 ↓ -3.57   (-2.04 %)
Net Assets (Cr) ₹56,469 on 30 Jun 24
Category Equity - Small Cap
AMC Nippon Life Asset Management Ltd.
Rating
Risk Moderately High
Expense Ratio 1.82
Sharpe Ratio 2.9
Information Ratio 0.96
Alpha Ratio 7.12
Min Investment 5,000
Min SIP Investment 100
Exit Load 0-1 Years (1%),1 Years and above(NIL)

Growth of 10,000 investment over the years.

DateValue
30 Jun 19₹10,000
30 Jun 20₹8,706
30 Jun 21₹18,155
30 Jun 22₹19,715
30 Jun 23₹27,539
30 Jun 24₹42,883

Nippon India Small Cap Fund SIP Returns

   
My Monthly Investment:
Investment Tenure:
Years
Expected Annual Returns:
%
Total investment amount is ₹300,000
expected amount after 5 Years is ₹721,906.
Net Profit of ₹421,906
Invest Now

Returns for Nippon India Small Cap Fund

Returns up to 1 year are on absolute basis & more than 1 year are on CAGR (Compound Annual Growth Rate) basis. as on 19 Jul 24

DurationReturns
1 Month 1.8%
3 Month 17.2%
6 Month 21.9%
1 Year 51.4%
3 Year 31.1%
5 Year 35.8%
10 Year
15 Year
Since launch 22.8%
Historical performance (Yearly) on absolute basis
YearReturns
2023 48.9%
2022 6.5%
2021 74.3%
2020 29.2%
2019 -2.5%
2018 -16.7%
2017 63%
2016 5.6%
2015 15.1%
2014 97.6%
Fund Manager information for Nippon India Small Cap Fund
NameSinceTenure
Samir Rachh2 Jan 177.42 Yr.
Kinjal Desai25 May 186.02 Yr.

Data below for Nippon India Small Cap Fund as on 30 Jun 24

Equity Sector Allocation
SectorValue
Industrials33.67%
Financial Services12.9%
Consumer Cyclical11.13%
Basic Materials10.34%
Technology8.97%
Health Care7.25%
Consumer Defensive6.54%
Communication Services1.48%
Utility1.39%
Energy1.02%
Real Estate0.38%
Asset Allocation
Asset ClassValue
Cash4.36%
Equity95.64%
Top Securities Holdings / Portfolio
NameHoldingValueQuantity
Voltamp Transformers Ltd (Industrials)
Equity, Since 30 Sep 16 | VOLTAMP
2%₹951 Cr844,398
↓ -20,000
HDFC Bank Ltd (Financial Services)
Equity, Since 30 Apr 22 | HDFCBANK
2%₹942 Cr6,150,000
Tube Investments of India Ltd Ordinary Shares (Industrials)
Equity, Since 30 Apr 18 | TIINDIA
2%₹894 Cr2,499,222
↓ -100,000
Apar Industries Ltd (Industrials)
Equity, Since 31 Mar 17 | APARINDS
1%₹763 Cr965,116
↓ -115,000
Kirloskar Brothers Ltd (Industrials)
Equity, Since 31 Oct 12 | KIRLOSBROS
1%₹753 Cr4,384,076
Bharat Heavy Electricals Ltd (Industrials)
Equity, Since 30 Sep 22 | 500103
1%₹747 Cr25,000,000
ELANTAS Beck India Ltd (Basic Materials)
Equity, Since 28 Feb 13 | 500123
1%₹717 Cr614,625
State Bank of India (Financial Services)
Equity, Since 31 Oct 19 | SBIN
1%₹673 Cr8,100,000
Multi Commodity Exchange of India Ltd (Financial Services)
Equity, Since 28 Feb 21 | MCX
1%₹672 Cr1,851,010
Larsen & Toubro Ltd (Industrials)
Equity, Since 30 Sep 21 | LT
1%₹671 Cr1,829,381
↑ 400,000

2. Motilal Oswal Midcap 30 Fund 

(Erstwhile Motilal Oswal MOSt Focused Midcap 30 Fund)

The investment objective of the Scheme is to achieve long term capital appreciation by investing in a maximum of 30 quality mid-cap companies having long-term competitive advantages and potential for growth. However, there can be no assurance or guarantee that the investment objective of the Scheme would be achieved.

Motilal Oswal Midcap 30 Fund  is a Equity - Mid Cap fund was launched on 24 Feb 14. It is a fund with Moderately High risk and has given a CAGR/Annualized return of 24.3% since its launch.  Ranked 27 in Mid Cap category.  Return for 2023 was 41.7% , 2022 was 10.7% and 2021 was 55.8% .

Below is the key information for Motilal Oswal Midcap 30 Fund 

Motilal Oswal Midcap 30 Fund 
Growth
Launch Date 24 Feb 14
NAV (19 Jul 24) ₹96.4067 ↓ -1.32   (-1.35 %)
Net Assets (Cr) ₹12,628 on 30 Jun 24
Category Equity - Mid Cap
AMC Motilal Oswal Asset Management Co. Ltd
Rating
Risk Moderately High
Expense Ratio 1.45
Sharpe Ratio 2.97
Information Ratio 1.3
Alpha Ratio 13.91
Min Investment 5,000
Min SIP Investment 500
Exit Load 0-1 Years (1%),1 Years and above(NIL)

Growth of 10,000 investment over the years.

DateValue
30 Jun 19₹10,000
30 Jun 20₹8,692
30 Jun 21₹14,156
30 Jun 22₹16,857
30 Jun 23₹23,241
30 Jun 24₹38,133

Motilal Oswal Midcap 30 Fund  SIP Returns

   
My Monthly Investment:
Investment Tenure:
Years
Expected Annual Returns:
%
Total investment amount is ₹300,000
expected amount after 5 Years is ₹673,113.
Net Profit of ₹373,113
Invest Now

Returns for Motilal Oswal Midcap 30 Fund 

Returns up to 1 year are on absolute basis & more than 1 year are on CAGR (Compound Annual Growth Rate) basis. as on 19 Jul 24

DurationReturns
1 Month 4%
3 Month 19.2%
6 Month 30.5%
1 Year 63%
3 Year 37.7%
5 Year 32.6%
10 Year
15 Year
Since launch 24.3%
Historical performance (Yearly) on absolute basis
YearReturns
2023 41.7%
2022 10.7%
2021 55.8%
2020 9.3%
2019 9.7%
2018 -12.7%
2017 30.8%
2016 5.2%
2015 16.5%
2014
Fund Manager information for Motilal Oswal Midcap 30 Fund 
NameSinceTenure
Niket Shah1 Jul 203.92 Yr.
Ankush Sood11 Nov 221.56 Yr.
Rakesh Shetty22 Nov 221.53 Yr.

Data below for Motilal Oswal Midcap 30 Fund  as on 30 Jun 24

Equity Sector Allocation
SectorValue
Consumer Cyclical19.8%
Industrials19.68%
Technology15.6%
Financial Services11.62%
Communication Services11.3%
Health Care6.12%
Real Estate5.88%
Utility3.76%
Basic Materials3.17%
Asset Allocation
Asset ClassValue
Cash3.09%
Equity96.91%
Top Securities Holdings / Portfolio
NameHoldingValueQuantity
Jio Financial Services Ltd (Financial Services)
Equity, Since 31 Aug 23 | 543940
10%₹1,033 Cr30,000,000
Vodafone Idea Ltd (Communication Services)
Equity, Since 30 Apr 24 | 532822
10%₹999 Cr655,000,000
↑ 100,000,000
Zomato Ltd (Consumer Cyclical)
Equity, Since 30 Apr 23 | 543320
8%₹851 Cr47,500,000
↑ 27,500,000
Tube Investments of India Ltd Ordinary Shares (Industrials)
Equity, Since 31 Jul 20 | TIINDIA
8%₹805 Cr2,250,000
↑ 427,022
Kalyan Jewellers India Ltd (Consumer Cyclical)
Equity, Since 29 Feb 24 | KALYANKJIL
7%₹777 Cr20,000,000
Persistent Systems Ltd (Technology)
Equity, Since 31 Jan 23 | PERSISTENT
7%₹729 Cr2,137,892
↑ 137,892
Prestige Estates Projects Ltd (Real Estate)
Equity, Since 31 Jul 23 | PRESTIGE
4%₹439 Cr2,750,000
↓ -250,000
Polycab India Ltd (Industrials)
Equity, Since 30 Sep 23 | POLYCAB
4%₹438 Cr650,000
Balkrishna Industries Ltd (Consumer Cyclical)
Equity, Since 28 Feb 23 | BALKRISIND
4%₹427 Cr1,400,000
Coforge Ltd (Technology)
Equity, Since 31 Mar 23 | COFORGE
4%₹410 Cr825,619
↓ -74,381

3. Kotak Small Cap Fund

(Erstwhile Kotak Midcap Scheme)

The investment objective of the Scheme is to generate capital appreciation from a diversified portfolio of equity and equity related securities.

Kotak Small Cap Fund is a Equity - Small Cap fund was launched on 24 Feb 05. It is a fund with Moderately High risk and has given a CAGR/Annualized return of 18.4% since its launch.  Ranked 23 in Small Cap category.  Return for 2023 was 34.8% , 2022 was -3.1% and 2021 was 70.9% .

Below is the key information for Kotak Small Cap Fund

Kotak Small Cap Fund
Growth
Launch Date 24 Feb 05
NAV (19 Jul 24) ₹266.55 ↓ -4.65   (-1.72 %)
Net Assets (Cr) ₹16,707 on 30 Jun 24
Category Equity - Small Cap
AMC Kotak Mahindra Asset Management Co Ltd
Rating
Risk Moderately High
Expense Ratio 1.48
Sharpe Ratio 2.17
Information Ratio -0.46
Alpha Ratio 1.12
Min Investment 5,000
Min SIP Investment 1,000
Exit Load 0-1 Years (1%),1 Years and above(NIL)

Growth of 10,000 investment over the years.

DateValue
30 Jun 19₹10,000
30 Jun 20₹8,955
30 Jun 21₹19,659
30 Jun 22₹20,657
30 Jun 23₹25,804
30 Jun 24₹37,103

Kotak Small Cap Fund SIP Returns

   
My Monthly Investment:
Investment Tenure:
Years
Expected Annual Returns:
%
Total investment amount is ₹300,000
expected amount after 5 Years is ₹657,502.
Net Profit of ₹357,502
Invest Now

Returns for Kotak Small Cap Fund

Returns up to 1 year are on absolute basis & more than 1 year are on CAGR (Compound Annual Growth Rate) basis. as on 19 Jul 24

DurationReturns
1 Month 2%
3 Month 17.7%
6 Month 20.3%
1 Year 41.4%
3 Year 22%
5 Year 31.7%
10 Year
15 Year
Since launch 18.4%
Historical performance (Yearly) on absolute basis
YearReturns
2023 34.8%
2022 -3.1%
2021 70.9%
2020 34.2%
2019 5%
2018 -17.3%
2017 44%
2016 8.9%
2015 7.4%
2014 74%
Fund Manager information for Kotak Small Cap Fund
NameSinceTenure
Arjun Khanna30 Apr 222.09 Yr.
Harish Bihani20 Oct 230.62 Yr.

Data below for Kotak Small Cap Fund as on 30 Jun 24

Equity Sector Allocation
SectorValue
Industrials39.96%
Consumer Cyclical20.72%
Basic Materials14.6%
Health Care8.49%
Consumer Defensive2.84%
Financial Services2.52%
Technology2.41%
Communication Services2.23%
Real Estate1.61%
Asset Allocation
Asset ClassValue
Cash4.12%
Equity95.88%
Top Securities Holdings / Portfolio
NameHoldingValueQuantity
Cyient Ltd (Industrials)
Equity, Since 31 Dec 19 | CYIENT
4%₹551 Cr3,174,852
↑ 161,289
Carborundum Universal Ltd (Industrials)
Equity, Since 30 Jun 18 | CARBORUNIV
4%₹538 Cr3,373,532
↓ -109,697
Techno Electric & Engineering Co Ltd (Industrials)
Equity, Since 31 Dec 18 | TECHNOE
3%₹527 Cr3,718,309
Blue Star Ltd (Industrials)
Equity, Since 31 May 18 | BLUESTARCO
3%₹513 Cr3,251,576
↓ -13,262
Ratnamani Metals & Tubes Ltd (Basic Materials)
Equity, Since 31 Jan 18 | RATNAMANI
3%₹452 Cr1,328,764
Century Plyboards (India) Ltd (Basic Materials)
Equity, Since 31 Oct 18 | 532548
3%₹413 Cr6,353,571
BEML Ltd (Industrials)
Equity, Since 30 Jun 18 | 500048
2%₹321 Cr729,789
Blue Dart Express Ltd (Industrials)
Equity, Since 31 Oct 19 | BLUEDART
2%₹320 Cr444,525
Alembic Pharmaceuticals Ltd (Healthcare)
Equity, Since 31 Jan 22 | APLLTD
2%₹318 Cr3,441,355
Exide Industries Ltd (Consumer Cyclical)
Equity, Since 30 Sep 22 | 500086
2%₹315 Cr6,441,912
↓ -840,068

4. Invesco India Infrastructure Fund

The Scheme seeks to provide long term capital appreciation by investing in a portfolio that is predominantly constituted of equity and equity related instruments of infrastructure companies. However, there can be no assurance that the investment objective of the Scheme will be achieved.

Invesco India Infrastructure Fund is a Equity - Sectoral fund was launched on 21 Nov 07. It is a fund with High risk and has given a CAGR/Annualized return of 12% since its launch.  Ranked 24 in Sectoral category.  Return for 2023 was 51.1% , 2022 was 2.3% and 2021 was 55.4% .

Below is the key information for Invesco India Infrastructure Fund

Invesco India Infrastructure Fund
Growth
Launch Date 21 Nov 07
NAV (19 Jul 24) ₹65.59 ↓ -1.86   (-2.76 %)
Net Assets (Cr) ₹1,470 on 30 Jun 24
Category Equity - Sectoral
AMC Invesco Asset Management (India) Private Ltd
Rating
Risk High
Expense Ratio 2.49
Sharpe Ratio 3.99
Information Ratio 0
Alpha Ratio 0
Min Investment 5,000
Min SIP Investment 500
Exit Load 0-1 Years (1%),1 Years and above(NIL)

Growth of 10,000 investment over the years.

DateValue
30 Jun 19₹10,000
30 Jun 20₹9,452
30 Jun 21₹15,391
30 Jun 22₹16,138
30 Jun 23₹21,209
30 Jun 24₹38,363

Invesco India Infrastructure Fund SIP Returns

   
My Monthly Investment:
Investment Tenure:
Years
Expected Annual Returns:
%
Total investment amount is ₹300,000
expected amount after 5 Years is ₹657,502.
Net Profit of ₹357,502
Invest Now

Returns for Invesco India Infrastructure Fund

Returns up to 1 year are on absolute basis & more than 1 year are on CAGR (Compound Annual Growth Rate) basis. as on 19 Jul 24

DurationReturns
1 Month -2.1%
3 Month 17%
6 Month 31.2%
1 Year 71.5%
3 Year 32%
5 Year 31.5%
10 Year
15 Year
Since launch 12%
Historical performance (Yearly) on absolute basis
YearReturns
2023 51.1%
2022 2.3%
2021 55.4%
2020 16.2%
2019 6.1%
2018 -15.8%
2017 48.1%
2016 0.8%
2015 -2.6%
2014 83.6%
Fund Manager information for Invesco India Infrastructure Fund
NameSinceTenure
Amit Nigam3 Sep 203.75 Yr.

Data below for Invesco India Infrastructure Fund as on 30 Jun 24

Equity Sector Allocation
SectorValue
Industrials54.14%
Utility20.78%
Basic Materials7.94%
Health Care3.87%
Energy2.8%
Financial Services2.62%
Consumer Cyclical2.33%
Technology1.51%
Communication Services1.12%
Real Estate1.01%
Asset Allocation
Asset ClassValue
Cash1.87%
Equity98.13%
Top Securities Holdings / Portfolio
NameHoldingValueQuantity
Power Grid Corp Of India Ltd (Utilities)
Equity, Since 30 Apr 22 | 532898
7%₹88 Cr2,840,042
↑ 606,025
Larsen & Toubro Ltd (Industrials)
Equity, Since 29 Feb 12 | LT
5%₹62 Cr169,760
Bharat Electronics Ltd (Industrials)
Equity, Since 30 Nov 17 | BEL
4%₹48 Cr1,623,224
NTPC Ltd (Utilities)
Equity, Since 31 Dec 23 | 532555
4%₹47 Cr1,299,723
↑ 129,500
Tata Power Co Ltd (Utilities)
Equity, Since 31 Jan 21 | 500400
4%₹45 Cr1,019,084
Thermax Ltd (Industrials)
Equity, Since 30 Jun 21 | THERMAX
3%₹41 Cr76,244
Hindustan Aeronautics Ltd Ordinary Shares (Industrials)
Equity, Since 30 Nov 22 | HAL
3%₹38 Cr77,048
↑ 19,294
Solar Industries India Ltd (Basic Materials)
Equity, Since 31 Dec 23 | SOLARINDS
3%₹38 Cr40,188
↑ 8,938
Bharat Petroleum Corp Ltd (Energy)
Equity, Since 31 Jan 23 | 500547
3%₹35 Cr552,825
↑ 9,182
Ratnamani Metals & Tubes Ltd (Basic Materials)
Equity, Since 30 Jun 21 | RATNAMANI
3%₹34 Cr98,929
↑ 5,755

5. Invesco India PSU Equity Fund

To generate capital appreciation by investing in Equity and Equity Related Instruments of companies where the Central / State Government(s) has majority shareholding or management control or has powers to appoint majority of directors. However, there is no assurance or guarantee that the investment objective of the Scheme will be achieved. The Scheme does not assure or guarantee any returns.

Invesco India PSU Equity Fund is a Equity - Sectoral fund was launched on 18 Nov 09. It is a fund with High risk and has given a CAGR/Annualized return of 13.9% since its launch.  Ranked 33 in Sectoral category.  Return for 2023 was 54.5% , 2022 was 20.5% and 2021 was 31.1% .

Below is the key information for Invesco India PSU Equity Fund

Invesco India PSU Equity Fund
Growth
Launch Date 18 Nov 09
NAV (19 Jul 24) ₹67.52 ↓ -1.89   (-2.72 %)
Net Assets (Cr) ₹1,363 on 30 Jun 24
Category Equity - Sectoral
AMC Invesco Asset Management (India) Private Ltd
Rating
Risk High
Expense Ratio 2.46
Sharpe Ratio 3.34
Information Ratio -0.8
Alpha Ratio 6.33
Min Investment 5,000
Min SIP Investment 500
Exit Load 0-1 Years (1%),1 Years and above(NIL)

Growth of 10,000 investment over the years.

DateValue
30 Jun 19₹10,000
30 Jun 20₹9,836
30 Jun 21₹13,587
30 Jun 22₹13,209
30 Jun 23₹18,874
30 Jun 24₹36,818

Invesco India PSU Equity Fund SIP Returns

   
My Monthly Investment:
Investment Tenure:
Years
Expected Annual Returns:
%
Total investment amount is ₹300,000
expected amount after 5 Years is ₹657,502.
Net Profit of ₹357,502
Invest Now

Returns for Invesco India PSU Equity Fund

Returns up to 1 year are on absolute basis & more than 1 year are on CAGR (Compound Annual Growth Rate) basis. as on 19 Jul 24

DurationReturns
1 Month 0.5%
3 Month 19.1%
6 Month 36.6%
1 Year 87.1%
3 Year 39%
5 Year 31.4%
10 Year
15 Year
Since launch 13.9%
Historical performance (Yearly) on absolute basis
YearReturns
2023 54.5%
2022 20.5%
2021 31.1%
2020 6.1%
2019 10.1%
2018 -16.9%
2017 24.3%
2016 17.9%
2015 2.5%
2014 54.5%
Fund Manager information for Invesco India PSU Equity Fund
NameSinceTenure
Dhimant Kothari19 May 204.04 Yr.

Data below for Invesco India PSU Equity Fund as on 30 Jun 24

Equity Sector Allocation
SectorValue
Industrials39.79%
Utility22.52%
Financial Services20.1%
Energy13.61%
Asset Allocation
Asset ClassValue
Cash3.99%
Equity96.01%
Top Securities Holdings / Portfolio
NameHoldingValueQuantity
Hindustan Aeronautics Ltd Ordinary Shares (Industrials)
Equity, Since 31 May 22 | HAL
10%₹110 Cr221,859
Bharat Electronics Ltd (Industrials)
Equity, Since 31 Mar 17 | BEL
10%₹110 Cr3,715,873
↓ -85,349
NTPC Ltd (Utilities)
Equity, Since 31 May 19 | 532555
8%₹90 Cr2,517,495
↑ 263,338
State Bank of India (Financial Services)
Equity, Since 28 Feb 21 | SBIN
8%₹89 Cr1,074,148
↑ 83,204
Coal India Ltd (Energy)
Equity, Since 31 Aug 23 | COALINDIA
7%₹84 Cr1,711,852
↑ 98,966
Power Grid Corp Of India Ltd (Utilities)
Equity, Since 28 Feb 22 | 532898
7%₹82 Cr2,658,563
↑ 396,997
Bharat Dynamics Ltd Ordinary Shares (Industrials)
Equity, Since 31 May 22 | BDL
6%₹66 Cr422,237
↑ 36,345
BEML Ltd (Industrials)
Equity, Since 31 Aug 23 | 500048
5%₹55 Cr124,817
↑ 93,051
Container Corporation of India Ltd (Industrials)
Equity, Since 31 Mar 17 | CONCOR
5%₹53 Cr489,399
↑ 103,066
NHPC Ltd (Utilities)
Equity, Since 31 Oct 22 | NHPC
4%₹49 Cr4,587,137

In case of any further queries, you can contact us on 8451864111 on any working day between 9.30am to 6.30 pm or write a mail to us anytime at support@fincash.com or chat with us by logging onto our website www.fincash.com.

Disclaimer:
All efforts have been made to ensure the information provided here is accurate. However, no guarantees are made regarding correctness of data. Please verify with scheme information document before making any investment.
How helpful was this page ?
Rated 5, based on 1 reviews.
POST A COMMENT