SOLUTIONS
EXPLORE FUNDS
CALCULATORS
fincash number+91-22-48913909Dashboard

How to Add Biller for SIP Transactions in Kotak Mahindra Bank?

Updated on November 8, 2025 , 11954 views

SIP or Systematic Investment plan is a mode of investment in Mutual Funds where people invest small amounts at regular intervals. SIP is one of the beauties of Mutual Funds as people can attain their objectives by Investing in small amounts. With the advancements in technology, the process of SIP through Net Banking has become very easy. Here, people just need to add a biller to their accounts for Mutual Fund payments so that their SIP payment process gets automated.

In case of SIP payments through Net Banking Channel, people need to add a Unique Registration Number or URN to their Bank accounts. However, the process of adding biller is different for each account. So, let us see steps of adding biller in case of Kotak Mahindra Bank.

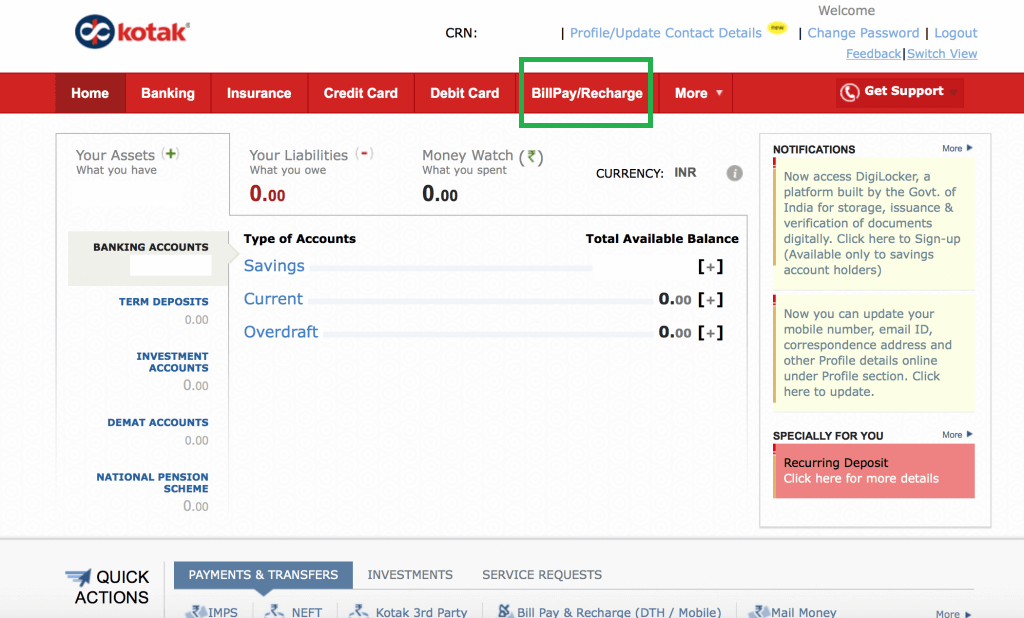
Log into Your Account & Click on BillPay/Recharge

The process of in case of Net Banking starts with logging into your account. First-of-all, you need to log into your account using your credentials. Once you log in and the home screen opens, click on the BillPay/Recharge tab which is on top of the screen. The image for this step is given below where BillPay/Recharge section is highlighted in Green.

Step 1

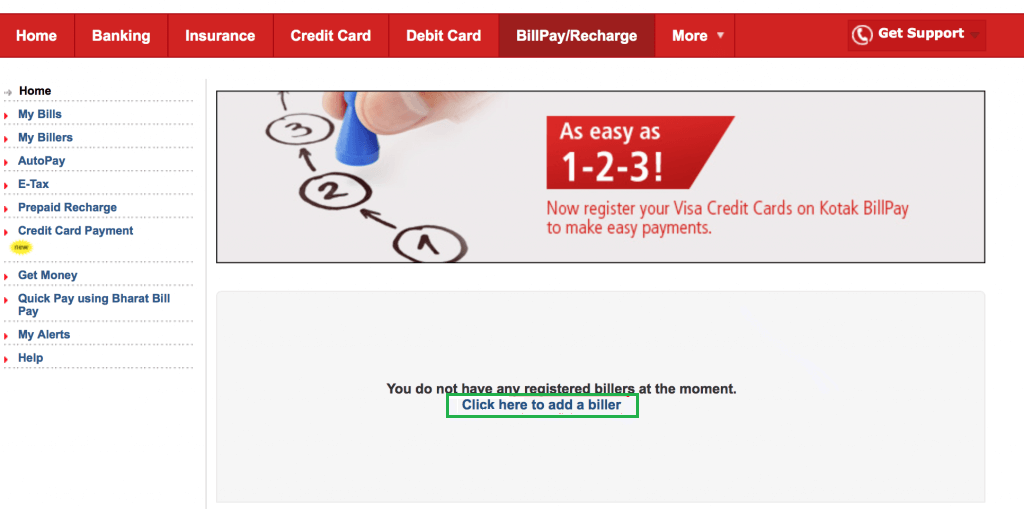
Click on Add a Biller

This is the second step. Once you click on BillPay/Recharge section, a new screen pops up wherein; you can find a sentence as Click here to add a biller. You need to click on this tab so that you can add a biller. The image for this step is given below where the Click here to add a biller is highlighted in Green.

Step 2

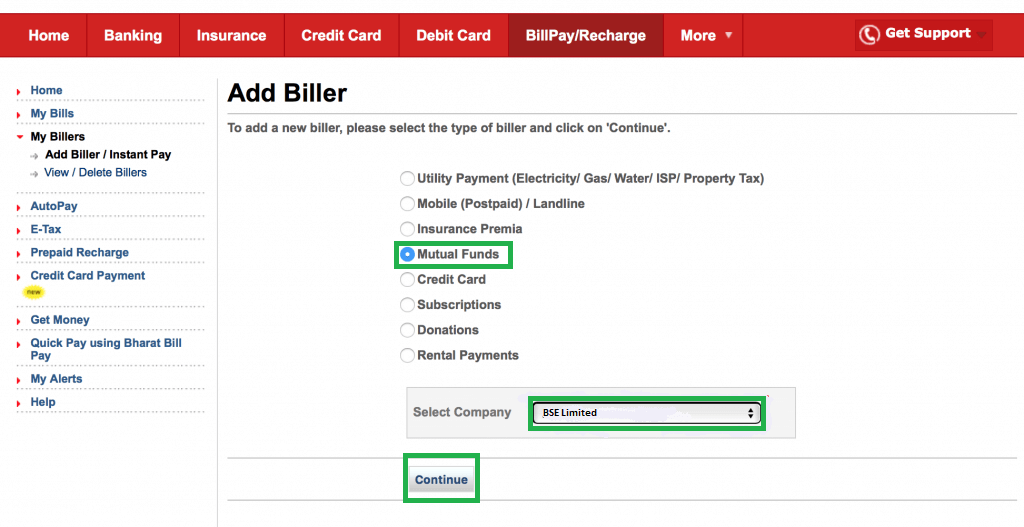
Select Mutual Funds & Click on BSE Limited

Once you click on Click here to add a biller, a new screen opens where you can find various payment options such as Utility Payments, insurance Premia, Credit Card, and much more. In this section, you need to click on Mutual Funds option. Once you click on this section, a drop-down stating Select Company below gets enabled. Here, you need to select BSE Limited option. Once you select on BSE Limited, you need to click Continue. The image for this step is given below where Mutual Funds, BSE Limited, and, Continue buttons are highlighted in Green.

Step 3

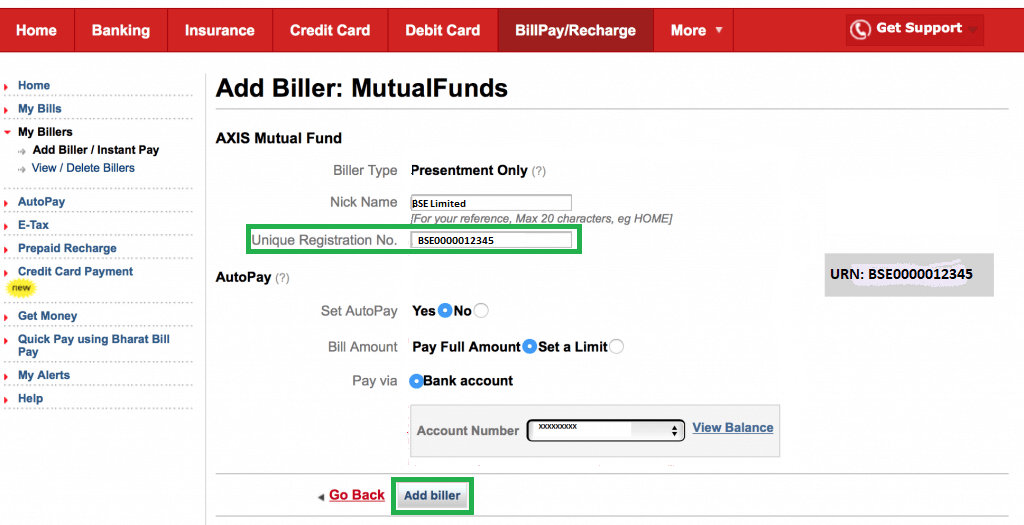
Add URN & Other Details

Once you click on Continue, a new screen opens up where you need to enter the URN. You receive this URN number from Fincash in your registered email after making the first SIP payment. However, if you do not receive it then, you can access the same data by visiting the website of www.fincash.com logging into your account and visiting your My SIPs section. In this section, you can find the details under the Mandate column. Along with the URN you also need to enter certain other details related to AutoPay option. In AutoPay option, you need to click on Yes and then select Pay Full Amount in Bill Amount. Once you add you the details, you need to click on Add Biller button. The image for this step is given below where the URN and Add Biller options are highlighted in Green.

Step 4

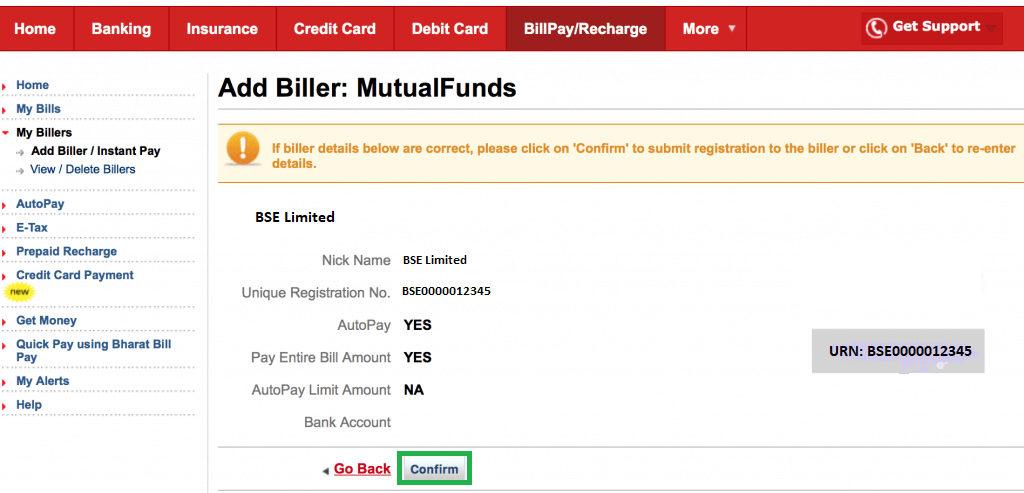
URN Summary & Confirmation

This is the second last step in the biller addition process in case of Kotak Mahindra Bank. In this step, you get to very your URN details. If you think, the details entered are correct then; you can click on Confirm. Or else, you can click on Go Back option and rectify your details. The image for this step is given below where the Confirm button is highlighted in Green.
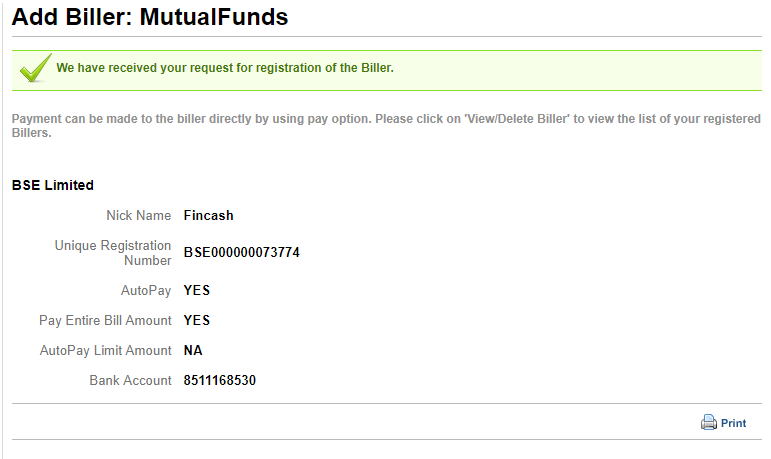
Step 5

Final Confirmation

This is the last step in the biller addition process for Kotak Mahindra Bank wherein; you get a confirmation stating that the biller has been added successfully. The image for this step is given below.

Step 5

Thus from the above-given steps, we can say that the biller addition process for SIP transactions in Kotak Mahindra Bank is simple.

Best SIPs to Invest to Earn Better Returns

Here are some of the recommend SIPs as per 5 year returns and AUM of more than INR 500 Cr:

FundNAVNet Assets (Cr)Min SIP Investment3 MO (%)6 MO (%)1 YR (%)3 YR (%)5 YR (%)2024 (%)
ICICI Prudential Infrastructure Fund Growth ₹198.13
↓ -0.28
₹7,645 100 410.93.826.935.427.4
HDFC Infrastructure Fund Growth ₹48.233
↓ 0.00
₹2,483 300 3.19.91.627.23323
Nippon India Small Cap Fund Growth ₹168.953
↑ 0.30
₹64,821 100 2.611.3-422.631.826.1
SBI PSU Fund Growth ₹33.6257
↑ 0.04
₹5,179 500 8.412.24.72931.623.5
Motilal Oswal Midcap 30 Fund  Growth ₹102.281
↓ -0.34
₹34,780 500 2.87.5-3.125.631.457.1
Note: Returns up to 1 year are on absolute basis & more than 1 year are on CAGR basis. as on 10 Nov 25

Research Highlights & Commentary of 5 Funds showcased

CommentaryICICI Prudential Infrastructure FundHDFC Infrastructure FundNippon India Small Cap FundSBI PSU FundMotilal Oswal Midcap 30 Fund 
Point 1Lower mid AUM (₹7,645 Cr).Bottom quartile AUM (₹2,483 Cr).Highest AUM (₹64,821 Cr).Bottom quartile AUM (₹5,179 Cr).Upper mid AUM (₹34,780 Cr).
Point 2Oldest track record among peers (20 yrs).Established history (17+ yrs).Established history (15+ yrs).Established history (15+ yrs).Established history (11+ yrs).
Point 3Rating: 3★ (upper mid).Rating: 3★ (lower mid).Top rated.Rating: 2★ (bottom quartile).Rating: 3★ (bottom quartile).
Point 4Risk profile: High.Risk profile: High.Risk profile: Moderately High.Risk profile: High.Risk profile: Moderately High.
Point 55Y return: 35.37% (top quartile).5Y return: 32.97% (upper mid).5Y return: 31.78% (lower mid).5Y return: 31.58% (bottom quartile).5Y return: 31.37% (bottom quartile).
Point 63Y return: 26.94% (lower mid).3Y return: 27.19% (upper mid).3Y return: 22.64% (bottom quartile).3Y return: 29.03% (top quartile).3Y return: 25.60% (bottom quartile).
Point 71Y return: 3.84% (upper mid).1Y return: 1.56% (lower mid).1Y return: -3.97% (bottom quartile).1Y return: 4.72% (top quartile).1Y return: -3.09% (bottom quartile).
Point 8Alpha: 0.00 (upper mid).Alpha: 0.00 (lower mid).Alpha: -2.55 (bottom quartile).Alpha: -0.35 (bottom quartile).Alpha: 4.99 (top quartile).
Point 9Sharpe: -0.48 (upper mid).Sharpe: -0.64 (lower mid).Sharpe: -0.65 (bottom quartile).Sharpe: -0.81 (bottom quartile).Sharpe: -0.18 (top quartile).
Point 10Information ratio: 0.00 (lower mid).Information ratio: 0.00 (bottom quartile).Information ratio: 0.10 (upper mid).Information ratio: -0.37 (bottom quartile).Information ratio: 0.57 (top quartile).

ICICI Prudential Infrastructure Fund

  • Lower mid AUM (₹7,645 Cr).
  • Oldest track record among peers (20 yrs).
  • Rating: 3★ (upper mid).
  • Risk profile: High.
  • 5Y return: 35.37% (top quartile).
  • 3Y return: 26.94% (lower mid).
  • 1Y return: 3.84% (upper mid).
  • Alpha: 0.00 (upper mid).
  • Sharpe: -0.48 (upper mid).
  • Information ratio: 0.00 (lower mid).

HDFC Infrastructure Fund

  • Bottom quartile AUM (₹2,483 Cr).
  • Established history (17+ yrs).
  • Rating: 3★ (lower mid).
  • Risk profile: High.
  • 5Y return: 32.97% (upper mid).
  • 3Y return: 27.19% (upper mid).
  • 1Y return: 1.56% (lower mid).
  • Alpha: 0.00 (lower mid).
  • Sharpe: -0.64 (lower mid).
  • Information ratio: 0.00 (bottom quartile).

Nippon India Small Cap Fund

  • Highest AUM (₹64,821 Cr).
  • Established history (15+ yrs).
  • Top rated.
  • Risk profile: Moderately High.
  • 5Y return: 31.78% (lower mid).
  • 3Y return: 22.64% (bottom quartile).
  • 1Y return: -3.97% (bottom quartile).
  • Alpha: -2.55 (bottom quartile).
  • Sharpe: -0.65 (bottom quartile).
  • Information ratio: 0.10 (upper mid).

SBI PSU Fund

  • Bottom quartile AUM (₹5,179 Cr).
  • Established history (15+ yrs).
  • Rating: 2★ (bottom quartile).
  • Risk profile: High.
  • 5Y return: 31.58% (bottom quartile).
  • 3Y return: 29.03% (top quartile).
  • 1Y return: 4.72% (top quartile).
  • Alpha: -0.35 (bottom quartile).
  • Sharpe: -0.81 (bottom quartile).
  • Information ratio: -0.37 (bottom quartile).

Motilal Oswal Midcap 30 Fund 

  • Upper mid AUM (₹34,780 Cr).
  • Established history (11+ yrs).
  • Rating: 3★ (bottom quartile).
  • Risk profile: Moderately High.
  • 5Y return: 31.37% (bottom quartile).
  • 3Y return: 25.60% (bottom quartile).
  • 1Y return: -3.09% (bottom quartile).
  • Alpha: 4.99 (top quartile).
  • Sharpe: -0.18 (top quartile).
  • Information ratio: 0.57 (top quartile).

1. ICICI Prudential Infrastructure Fund

To generate capital appreciation and income distribution to unit holders by investing predominantly in equity/equity related securities of the companies belonging to the infrastructure development and balance in debt securities and money market instruments.

Research Highlights for ICICI Prudential Infrastructure Fund

  • Lower mid AUM (₹7,645 Cr).
  • Oldest track record among peers (20 yrs).
  • Rating: 3★ (upper mid).
  • Risk profile: High.
  • 5Y return: 35.37% (top quartile).
  • 3Y return: 26.94% (lower mid).
  • 1Y return: 3.84% (upper mid).
  • Alpha: 0.00 (upper mid).
  • Sharpe: -0.48 (upper mid).
  • Information ratio: 0.00 (lower mid).

Below is the key information for ICICI Prudential Infrastructure Fund

ICICI Prudential Infrastructure Fund
Growth
Launch Date 31 Aug 05
NAV (10 Nov 25) ₹198.13 ↓ -0.28   (-0.14 %)
Net Assets (Cr) ₹7,645 on 31 Aug 25
Category Equity - Sectoral
AMC ICICI Prudential Asset Management Company Limited
Rating
Risk High
Expense Ratio 1.89
Sharpe Ratio -0.48
Information Ratio 0
Alpha Ratio 0
Min Investment 5,000
Min SIP Investment 100
Exit Load 0-1 Years (1%),1 Years and above(NIL)

Growth of 10,000 investment over the years.

DateValue
31 Oct 20₹10,000
31 Oct 21₹19,902
31 Oct 22₹23,709
31 Oct 23₹30,130
31 Oct 24₹47,075
31 Oct 25₹49,413

ICICI Prudential Infrastructure Fund SIP Returns

   
My Monthly Investment:
Investment Tenure:
Years
Expected Annual Returns:
%
Total investment amount is ₹300,000
expected amount after 5 Years is ₹721,906.
Net Profit of ₹421,906
Invest Now

Returns for ICICI Prudential Infrastructure Fund

Returns up to 1 year are on absolute basis & more than 1 year are on CAGR (Compound Annual Growth Rate) basis. as on 10 Nov 25

DurationReturns
1 Month 0.4%
3 Month 4%
6 Month 10.9%
1 Year 3.8%
3 Year 26.9%
5 Year 35.4%
10 Year
15 Year
Since launch 15.9%
Historical performance (Yearly) on absolute basis
YearReturns
2024 27.4%
2023 44.6%
2022 28.8%
2021 50.1%
2020 3.6%
2019 2.6%
2018 -14%
2017 40.8%
2016 2%
2015 -3.4%
Fund Manager information for ICICI Prudential Infrastructure Fund
NameSinceTenure
Ihab Dalwai3 Jun 178.33 Yr.
Sharmila D’mello30 Jun 223.26 Yr.

Data below for ICICI Prudential Infrastructure Fund as on 31 Aug 25

Equity Sector Allocation
SectorValue
Industrials36.47%
Basic Materials15.25%
Financial Services14.68%
Utility10.24%
Energy9.47%
Real Estate2.93%
Consumer Cyclical1.84%
Communication Services1.67%
Asset Allocation
Asset ClassValue
Cash7.43%
Equity92.57%
Top Securities Holdings / Portfolio
NameHoldingValueQuantity
Larsen & Toubro Ltd (Industrials)
Equity, Since 30 Nov 09 | LT
9%₹674 Cr1,843,204
↓ -155,750
NTPC Ltd (Utilities)
Equity, Since 29 Feb 16 | 532555
4%₹352 Cr10,329,473
↓ -750,000
Vedanta Ltd (Basic Materials)
Equity, Since 31 Jul 24 | 500295
4%₹293 Cr6,279,591
Reliance Industries Ltd (Energy)
Equity, Since 31 Jul 23 | RELIANCE
4%₹277 Cr2,029,725
NCC Ltd (Industrials)
Equity, Since 31 Aug 21 | NCC
3%₹271 Cr13,053,905
Adani Ports & Special Economic Zone Ltd (Industrials)
Equity, Since 31 May 24 | ADANIPORTS
3%₹260 Cr1,854,934
↓ -413,725
Kalpataru Projects International Ltd (Industrials)
Equity, Since 30 Sep 06 | KPIL
3%₹226 Cr1,803,566
Axis Bank Ltd (Financial Services)
Equity, Since 31 Dec 20 | 532215
3%₹226 Cr1,996,057
AIA Engineering Ltd (Industrials)
Equity, Since 28 Feb 21 | AIAENG
3%₹202 Cr660,770
CESC Ltd (Utilities)
Equity, Since 30 Jun 23 | CESC
2%₹189 Cr11,700,502

2. HDFC Infrastructure Fund

To seek long-term capital appreciation by investing predominantly in equity and equity related securities of companies engaged in or expected to benefit from growth and development of infrastructure.

Research Highlights for HDFC Infrastructure Fund

  • Bottom quartile AUM (₹2,483 Cr).
  • Established history (17+ yrs).
  • Rating: 3★ (lower mid).
  • Risk profile: High.
  • 5Y return: 32.97% (upper mid).
  • 3Y return: 27.19% (upper mid).
  • 1Y return: 1.56% (lower mid).
  • Alpha: 0.00 (lower mid).
  • Sharpe: -0.64 (lower mid).
  • Information ratio: 0.00 (bottom quartile).

Below is the key information for HDFC Infrastructure Fund

HDFC Infrastructure Fund
Growth
Launch Date 10 Mar 08
NAV (10 Nov 25) ₹48.233 ↓ 0.00   (-0.01 %)
Net Assets (Cr) ₹2,483 on 31 Aug 25
Category Equity - Sectoral
AMC HDFC Asset Management Company Limited
Rating
Risk High
Expense Ratio 2.06
Sharpe Ratio -0.64
Information Ratio 0
Alpha Ratio 0
Min Investment 5,000
Min SIP Investment 300
Exit Load 0-1 Years (1%),1 Years and above(NIL)

Growth of 10,000 investment over the years.

DateValue
31 Oct 20₹10,000
31 Oct 21₹19,027
31 Oct 22₹21,626
31 Oct 23₹29,679
31 Oct 24₹44,661
31 Oct 25₹45,504

HDFC Infrastructure Fund SIP Returns

   
My Monthly Investment:
Investment Tenure:
Years
Expected Annual Returns:
%
Total investment amount is ₹300,000
expected amount after 5 Years is ₹673,113.
Net Profit of ₹373,113
Invest Now

Returns for HDFC Infrastructure Fund

Returns up to 1 year are on absolute basis & more than 1 year are on CAGR (Compound Annual Growth Rate) basis. as on 10 Nov 25

DurationReturns
1 Month 0.4%
3 Month 3.1%
6 Month 9.9%
1 Year 1.6%
3 Year 27.2%
5 Year 33%
10 Year
15 Year
Since launch
Historical performance (Yearly) on absolute basis
YearReturns
2024 23%
2023 55.4%
2022 19.3%
2021 43.2%
2020 -7.5%
2019 -3.4%
2018 -29%
2017 43.3%
2016 -1.9%
2015 -2.5%
Fund Manager information for HDFC Infrastructure Fund
NameSinceTenure
Srinivasan Ramamurthy12 Jan 241.72 Yr.
Dhruv Muchhal22 Jun 232.28 Yr.

Data below for HDFC Infrastructure Fund as on 31 Aug 25

Equity Sector Allocation
SectorValue
Industrials38.53%
Financial Services19.18%
Basic Materials10.34%
Utility7.05%
Energy6.49%
Communication Services3.63%
Real Estate2.48%
Health Care1.76%
Technology1.57%
Consumer Cyclical0.49%
Asset Allocation
Asset ClassValue
Cash8.47%
Equity91.53%
Top Securities Holdings / Portfolio
NameHoldingValueQuantity
ICICI Bank Ltd (Financial Services)
Equity, Since 31 Oct 09 | 532174
6%₹148 Cr1,100,000
↓ -200,000
Larsen & Toubro Ltd (Industrials)
Equity, Since 30 Jun 12 | LT
6%₹139 Cr380,000
HDFC Bank Ltd (Financial Services)
Equity, Since 31 Aug 23 | HDFCBANK
5%₹133 Cr1,400,000
Kalpataru Projects International Ltd (Industrials)
Equity, Since 31 Jan 23 | 522287
4%₹95 Cr758,557
↑ 272
J Kumar Infraprojects Ltd (Industrials)
Equity, Since 31 Oct 15 | JKIL
4%₹89 Cr1,403,084
↑ 3,084
InterGlobe Aviation Ltd (Industrials)
Equity, Since 31 Dec 21 | INDIGO
3%₹84 Cr150,000
NTPC Ltd (Utilities)
Equity, Since 31 Dec 17 | 532555
3%₹75 Cr2,200,646
↑ 646
Reliance Industries Ltd (Energy)
Equity, Since 31 May 24 | RELIANCE
3%₹68 Cr500,000
Bharti Airtel Ltd (Communication Services)
Equity, Since 30 Sep 20 | BHARTIARTL
3%₹66 Cr350,000
State Bank of India (Financial Services)
Equity, Since 31 Mar 08 | SBIN
2%₹61 Cr704,361

3. Nippon India Small Cap Fund

The primary investment objective of the scheme is to generate long term capital appreciation by investing predominantly in equity and equity related instruments of small cap companies and the secondary objective is to generate consistent returns by investing in debt and money market securities.

Research Highlights for Nippon India Small Cap Fund

  • Highest AUM (₹64,821 Cr).
  • Established history (15+ yrs).
  • Top rated.
  • Risk profile: Moderately High.
  • 5Y return: 31.78% (lower mid).
  • 3Y return: 22.64% (bottom quartile).
  • 1Y return: -3.97% (bottom quartile).
  • Alpha: -2.55 (bottom quartile).
  • Sharpe: -0.65 (bottom quartile).
  • Information ratio: 0.10 (upper mid).

Below is the key information for Nippon India Small Cap Fund

Nippon India Small Cap Fund
Growth
Launch Date 16 Sep 10
NAV (10 Nov 25) ₹168.953 ↑ 0.30   (0.18 %)
Net Assets (Cr) ₹64,821 on 31 Aug 25
Category Equity - Small Cap
AMC Nippon Life Asset Management Ltd.
Rating
Risk Moderately High
Expense Ratio 1.44
Sharpe Ratio -0.65
Information Ratio 0.1
Alpha Ratio -2.55
Min Investment 5,000
Min SIP Investment 100
Exit Load 0-1 Years (1%),1 Years and above(NIL)

Growth of 10,000 investment over the years.

DateValue
31 Oct 20₹10,000
31 Oct 21₹19,480
31 Oct 22₹22,272
31 Oct 23₹29,220
31 Oct 24₹42,673
31 Oct 25₹41,342

Nippon India Small Cap Fund SIP Returns

   
My Monthly Investment:
Investment Tenure:
Years
Expected Annual Returns:
%
Total investment amount is ₹300,000
expected amount after 5 Years is ₹657,502.
Net Profit of ₹357,502
Invest Now

Returns for Nippon India Small Cap Fund

Returns up to 1 year are on absolute basis & more than 1 year are on CAGR (Compound Annual Growth Rate) basis. as on 10 Nov 25

DurationReturns
1 Month 0.1%
3 Month 2.6%
6 Month 11.3%
1 Year -4%
3 Year 22.6%
5 Year 31.8%
10 Year
15 Year
Since launch 20.5%
Historical performance (Yearly) on absolute basis
YearReturns
2024 26.1%
2023 48.9%
2022 6.5%
2021 74.3%
2020 29.2%
2019 -2.5%
2018 -16.7%
2017 63%
2016 5.6%
2015 15.1%
Fund Manager information for Nippon India Small Cap Fund
NameSinceTenure
Samir Rachh2 Jan 178.75 Yr.
Kinjal Desai25 May 187.36 Yr.

Data below for Nippon India Small Cap Fund as on 31 Aug 25

Equity Sector Allocation
SectorValue
Industrials20.82%
Consumer Cyclical15.14%
Financial Services14.81%
Basic Materials12.07%
Consumer Defensive9.3%
Health Care8.98%
Technology7.7%
Utility2.67%
Energy1.51%
Communication Services1.42%
Real Estate0.53%
Asset Allocation
Asset ClassValue
Cash4.9%
Equity95.1%
Top Securities Holdings / Portfolio
NameHoldingValueQuantity
Multi Commodity Exchange of India Ltd (Financial Services)
Equity, Since 28 Feb 21 | MCX
2%₹1,443 Cr1,851,010
HDFC Bank Ltd (Financial Services)
Equity, Since 30 Apr 22 | HDFCBANK
2%₹1,265 Cr13,300,000
Kirloskar Brothers Ltd (Industrials)
Equity, Since 31 Oct 12 | KIRLOSBROS
1%₹863 Cr4,472,130
Karur Vysya Bank Ltd (Financial Services)
Equity, Since 28 Feb 17 | 590003
1%₹804 Cr38,140,874
State Bank of India (Financial Services)
Equity, Since 31 Oct 19 | SBIN
1%₹794 Cr9,100,000
NLC India Ltd (Utilities)
Equity, Since 31 Oct 22 | NLCINDIA
1%₹776 Cr27,190,940
Tube Investments of India Ltd Ordinary Shares (Industrials)
Equity, Since 30 Apr 18 | TIINDIA
1%₹774 Cr2,499,222
Zydus Wellness Ltd (Consumer Defensive)
Equity, Since 31 Aug 16 | ZYDUSWELL
1%₹770 Cr16,848,030
Paradeep Phosphates Ltd (Basic Materials)
Equity, Since 31 May 22 | 543530
1%₹747 Cr38,089,109
Apar Industries Ltd (Industrials)
Equity, Since 31 Mar 17 | APARINDS
1%₹736 Cr899,271

4. SBI PSU Fund

The objective of the scheme would be to provide investors with opportunities for long-term growth in capital along with the liquidity of an open-ended scheme through an active management of investments in a diversified basket of equity stocks of domestic Public Sector Undertakings and in debt and money market instruments issued by PSUs AND others.

Research Highlights for SBI PSU Fund

  • Bottom quartile AUM (₹5,179 Cr).
  • Established history (15+ yrs).
  • Rating: 2★ (bottom quartile).
  • Risk profile: High.
  • 5Y return: 31.58% (bottom quartile).
  • 3Y return: 29.03% (top quartile).
  • 1Y return: 4.72% (top quartile).
  • Alpha: -0.35 (bottom quartile).
  • Sharpe: -0.81 (bottom quartile).
  • Information ratio: -0.37 (bottom quartile).

Below is the key information for SBI PSU Fund

SBI PSU Fund
Growth
Launch Date 7 Jul 10
NAV (10 Nov 25) ₹33.6257 ↑ 0.04   (0.12 %)
Net Assets (Cr) ₹5,179 on 31 Aug 25
Category Equity - Sectoral
AMC SBI Funds Management Private Limited
Rating
Risk High
Expense Ratio 1.89
Sharpe Ratio -0.81
Information Ratio -0.37
Alpha Ratio -0.35
Min Investment 5,000
Min SIP Investment 500
Exit Load 0-1 Years (1%),1 Years and above(NIL)

Growth of 10,000 investment over the years.

DateValue
31 Oct 20₹10,000
31 Oct 21₹16,381
31 Oct 22₹19,173
31 Oct 23₹24,318
31 Oct 24₹40,047
31 Oct 25₹42,467

SBI PSU Fund SIP Returns

   
My Monthly Investment:
Investment Tenure:
Years
Expected Annual Returns:
%
Total investment amount is ₹300,000
expected amount after 5 Years is ₹657,502.
Net Profit of ₹357,502
Invest Now

Returns for SBI PSU Fund

Returns up to 1 year are on absolute basis & more than 1 year are on CAGR (Compound Annual Growth Rate) basis. as on 10 Nov 25

DurationReturns
1 Month 2.4%
3 Month 8.4%
6 Month 12.2%
1 Year 4.7%
3 Year 29%
5 Year 31.6%
10 Year
15 Year
Since launch 8.2%
Historical performance (Yearly) on absolute basis
YearReturns
2024 23.5%
2023 54%
2022 29%
2021 32.4%
2020 -10%
2019 6%
2018 -23.8%
2017 21.9%
2016 16.2%
2015 -11.1%
Fund Manager information for SBI PSU Fund
NameSinceTenure
Rohit Shimpi1 Jun 241.33 Yr.

Data below for SBI PSU Fund as on 31 Aug 25

Equity Sector Allocation
SectorValue
Financial Services36.21%
Utility29.89%
Energy13.58%
Industrials12.34%
Basic Materials5.79%
Asset Allocation
Asset ClassValue
Cash2.18%
Equity97.82%
Top Securities Holdings / Portfolio
NameHoldingValueQuantity
State Bank of India (Financial Services)
Equity, Since 31 Jul 10 | SBIN
16%₹866 Cr9,927,500
Bharat Electronics Ltd (Industrials)
Equity, Since 30 Jun 24 | BEL
9%₹524 Cr12,975,000
NTPC Ltd (Utilities)
Equity, Since 31 Jul 10 | 532555
9%₹495 Cr14,543,244
Power Grid Corp Of India Ltd (Utilities)
Equity, Since 31 Jul 10 | 532898
8%₹463 Cr16,535,554
GAIL (India) Ltd (Utilities)
Equity, Since 31 May 24 | 532155
8%₹454 Cr25,750,000
Bharat Petroleum Corp Ltd (Energy)
Equity, Since 31 Aug 24 | 500547
6%₹329 Cr9,700,000
Bank of Baroda (Financial Services)
Equity, Since 31 Aug 24 | 532134
5%₹284 Cr11,000,000
NMDC Ltd (Basic Materials)
Equity, Since 31 Oct 23 | 526371
4%₹213 Cr27,900,000
Indian Bank (Financial Services)
Equity, Since 30 Jun 21 | 532814
3%₹182 Cr2,427,235
Oil India Ltd (Energy)
Equity, Since 31 Mar 24 | OIL
3%₹159 Cr3,850,000

5. Motilal Oswal Midcap 30 Fund 

(Erstwhile Motilal Oswal MOSt Focused Midcap 30 Fund)

The investment objective of the Scheme is to achieve long term capital appreciation by investing in a maximum of 30 quality mid-cap companies having long-term competitive advantages and potential for growth. However, there can be no assurance or guarantee that the investment objective of the Scheme would be achieved.

Research Highlights for Motilal Oswal Midcap 30 Fund 

  • Upper mid AUM (₹34,780 Cr).
  • Established history (11+ yrs).
  • Rating: 3★ (bottom quartile).
  • Risk profile: Moderately High.
  • 5Y return: 31.37% (bottom quartile).
  • 3Y return: 25.60% (bottom quartile).
  • 1Y return: -3.09% (bottom quartile).
  • Alpha: 4.99 (top quartile).
  • Sharpe: -0.18 (top quartile).
  • Information ratio: 0.57 (top quartile).

Below is the key information for Motilal Oswal Midcap 30 Fund 

Motilal Oswal Midcap 30 Fund 
Growth
Launch Date 24 Feb 14
NAV (10 Nov 25) ₹102.281 ↓ -0.34   (-0.34 %)
Net Assets (Cr) ₹34,780 on 31 Aug 25
Category Equity - Mid Cap
AMC Motilal Oswal Asset Management Co. Ltd
Rating
Risk Moderately High
Expense Ratio 1.56
Sharpe Ratio -0.18
Information Ratio 0.57
Alpha Ratio 4.99
Min Investment 5,000
Min SIP Investment 500
Exit Load 0-1 Years (1%),1 Years and above(NIL)

Growth of 10,000 investment over the years.

DateValue
31 Oct 20₹10,000
31 Oct 21₹17,165
31 Oct 22₹20,795
31 Oct 23₹24,620
31 Oct 24₹40,895
31 Oct 25₹41,318

Motilal Oswal Midcap 30 Fund  SIP Returns

   
My Monthly Investment:
Investment Tenure:
Years
Expected Annual Returns:
%
Total investment amount is ₹300,000
expected amount after 5 Years is ₹657,502.
Net Profit of ₹357,502
Invest Now

Returns for Motilal Oswal Midcap 30 Fund 

Returns up to 1 year are on absolute basis & more than 1 year are on CAGR (Compound Annual Growth Rate) basis. as on 10 Nov 25

DurationReturns
1 Month -1.8%
3 Month 2.8%
6 Month 7.5%
1 Year -3.1%
3 Year 25.6%
5 Year 31.4%
10 Year
15 Year
Since launch 22%
Historical performance (Yearly) on absolute basis
YearReturns
2024 57.1%
2023 41.7%
2022 10.7%
2021 55.8%
2020 9.3%
2019 9.7%
2018 -12.7%
2017 30.8%
2016 5.2%
2015 16.5%
Fund Manager information for Motilal Oswal Midcap 30 Fund 
NameSinceTenure
Ajay Khandelwal1 Oct 241 Yr.
Niket Shah1 Jul 205.25 Yr.
Rakesh Shetty22 Nov 222.86 Yr.
Sunil Sawant1 Jul 241.25 Yr.

Data below for Motilal Oswal Midcap 30 Fund  as on 31 Aug 25

Equity Sector Allocation
SectorValue
Technology35.03%
Consumer Cyclical23.94%
Industrials21.59%
Communication Services3.22%
Financial Services3.15%
Real Estate2.39%
Health Care1.69%
Asset Allocation
Asset ClassValue
Cash8.99%
Equity91.01%
Top Securities Holdings / Portfolio
NameHoldingValueQuantity
Dixon Technologies (India) Ltd (Technology)
Equity, Since 31 Mar 23 | DIXON
10%₹3,326 Cr2,037,521
↓ -62,478
Eternal Ltd (Consumer Cyclical)
Equity, Since 31 Aug 25 | 543320
9%₹3,255 Cr100,000,000
Coforge Ltd (Technology)
Equity, Since 31 Mar 23 | COFORGE
9%₹3,142 Cr19,750,000
Persistent Systems Ltd (Technology)
Equity, Since 31 Jan 23 | PERSISTENT
8%₹2,894 Cr6,000,000
↑ 500,000
One97 Communications Ltd (Technology)
Equity, Since 30 Sep 24 | 543396
8%₹2,810 Cr25,000,000
Kalyan Jewellers India Ltd (Consumer Cyclical)
Equity, Since 29 Feb 24 | KALYANKJIL
8%₹2,726 Cr60,000,000
Trent Ltd (Consumer Cyclical)
Equity, Since 30 Nov 24 | 500251
7%₹2,339 Cr4,999,694
↓ -1,000,306
Polycab India Ltd (Industrials)
Equity, Since 30 Sep 23 | POLYCAB
7%₹2,295 Cr3,150,000
↑ 100,000
Kaynes Technology India Ltd (Industrials)
Equity, Since 30 Jun 25 | KAYNES
5%₹1,657 Cr2,350,000
↑ 250,000
KEI Industries Ltd (Industrials)
Equity, Since 30 Nov 24 | KEI
5%₹1,625 Cr4,000,000
↑ 250,000

In case of any further queries, you can contact us on 8451864111 on any working day between 9.30am to 6.30 pm or write a mail to us anytime at support@fincash.com or chat with us by logging onto our website www.fincash.com.

Disclaimer:
All efforts have been made to ensure the information provided here is accurate. However, no guarantees are made regarding correctness of data. Please verify with scheme information document before making any investment.
How helpful was this page ?
Rated 5, based on 1 reviews.
POST A COMMENT