SOLUTIONS
EXPLORE FUNDS
CALCULATORS
fincash number+91-22-48913909Dashboard

How to Add Biller for SIP Transactions in IndusInd Bank?

Updated on August 23, 2025 , 6470 views

SIP or Systematic Investment plan is an investment mode in Mutual Fund through which individuals deposit small amounts at regular intervals. One of the important points that individuals should understand here is, the amounts get deducted at regular intervals. As a consequence, to make sure that the entire SIP investment process takes place smoothly; individuals can add biller to their Bank accounts. For adding biller in the bank accounts, individuals require the Unique Registration Number or URN of the SIP which needs to be added to the bank account either through net banking or mobile banking process. The process of adding biller for each bank is different. So, let us check the process of adding biller for SIP transactions in IndusInd Bank.

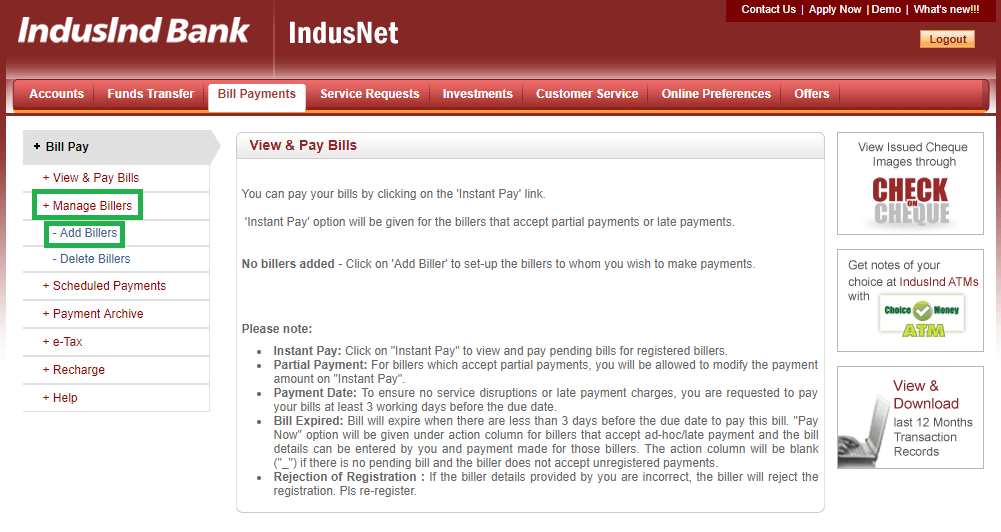
Login to Your IndusInd Bank Account & Click on Bill Pay Option

The first step is almost similar in most of the banks in which individuals need to log into their bank accounts. Even in this case, you first need to log into your account using your login credentials. After logging in, once you reach the home screen, you need to click on Bill Payments tab which is on the top of the screen. The image for this step is given below where Bill Payments tab is highlighted in Green.

Step 1

Click on Manage Biller Tab & Select Add Biller Option

Once you click on Bill Payments, a new screen opens. In this screen, you need to click on the Manage Billers tab which is on the left side of the screen. Once, you click on Manage Biller option, the tab expands and in that tab, you need to click on Add Billers option. The image for this step is given below where Manage Billers and Add Billers option is highlighted in Green.

Step 2

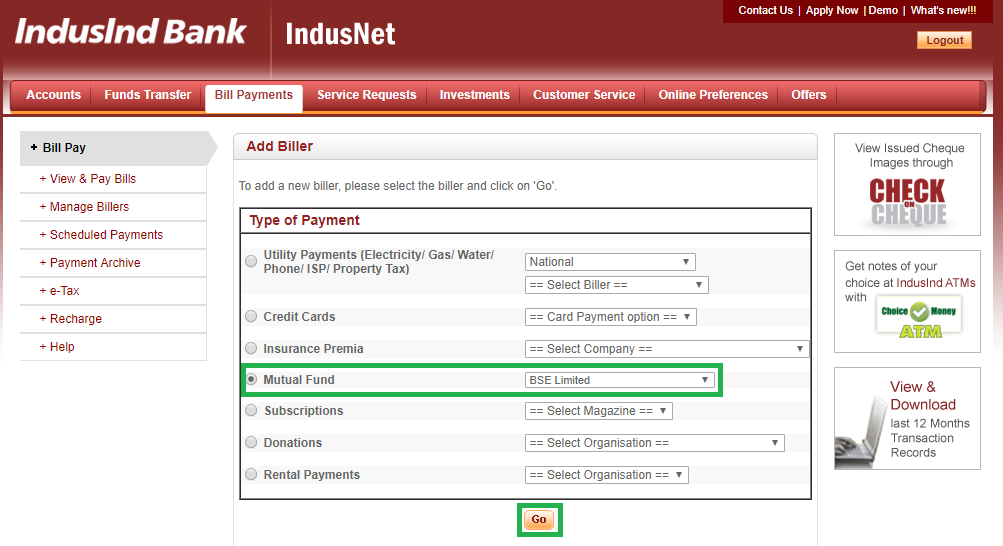
Click on Mutual Fund Option & Select BSE Limited

Once you click on Add Biller in the previous step, you will be redirected to a new screen which shows as Type of Payment. In this section, there are various options such as Utility Payments, credit cards, insurance Premia, and much more. In this section, you need to click on the Mutual Fund option and select BSE Limited in the drop down next to it. After selecting BSE Limited option you need to click on Go option. The image for this step is given below where the Mutual Fund, BSE Limited, and Go Button are highlighted in Green.
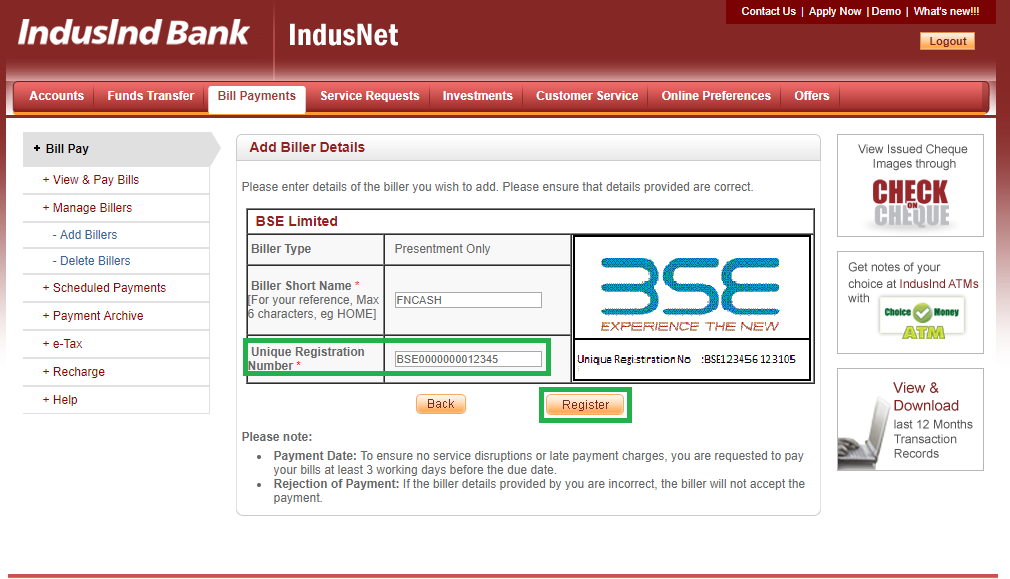
Step 3

Enter URN Details

This is the important step in the add biller process. Once you click on Go, in this step, you are redirected to a new screen, in which you need to enter your URN and other details. You will receive this URN number for your SIP through email from Fincash once you make the initial payment. If you do not receive it then you can find the same from the My SIPs section of your Fincash Account. After getting the URN, you need to enter the same here and add other details. After entering the details, you need to click on Register option. The image for this step is given below where the URN details and Register button both are highlighted in Green.

Step 4

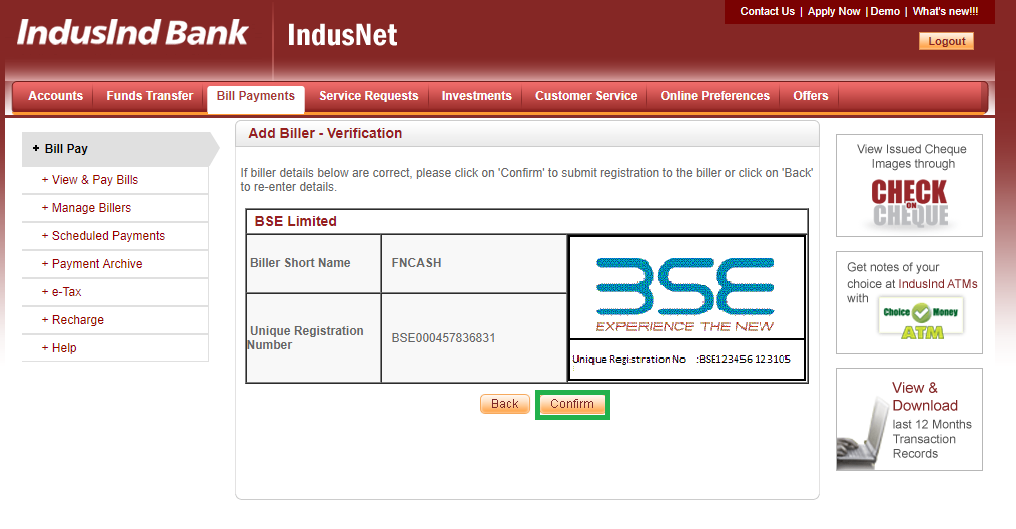
Summary Confirmation

Once you click on Register in the previous step, a new screen opens up in which you can see the summary of your details entered. In this step, you need to verify whether the details entered are correct or not. Once you verify with the details, then you need to click on Confirm. The image for this step is given below where the Confirm button is highlighted in Green.
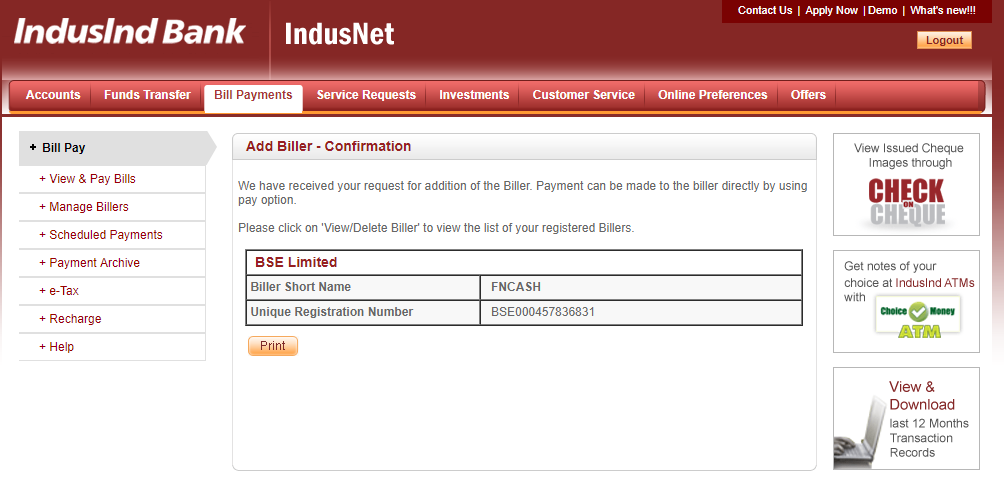
Step 5

Biller Confirmation

In this step, you receive the biller confirmation stating that your biller has been added successfully. The image for this step is given below.

Step 6

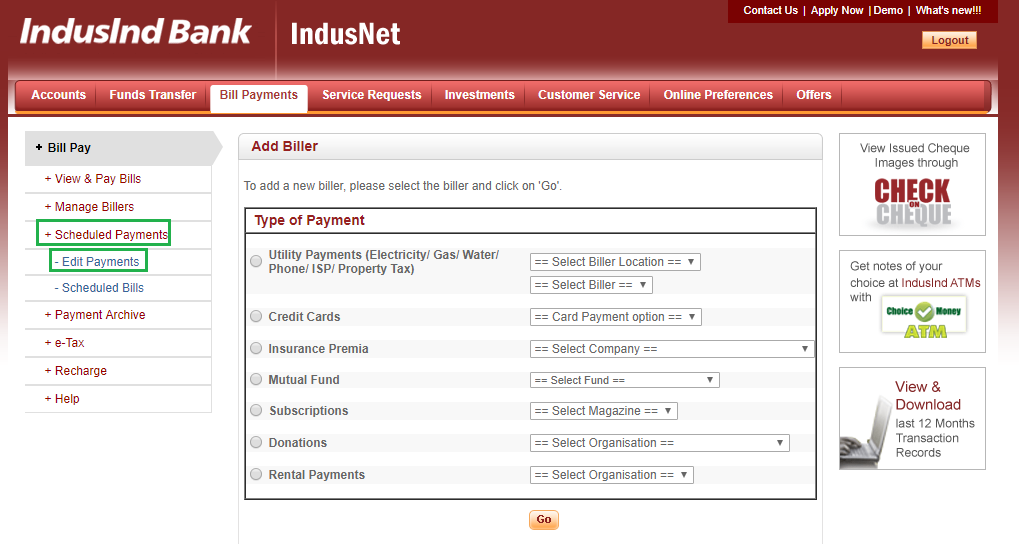
Click on Schedule Payments & Select Edit Payments

Your process of adding biller doesn’t stop just by adding biller. Once you successfully add biller, then you need to click on the Schedule Payments tab which is on the left side of the screen. Once you click, on it the tab expands and shows multiple options under it. Here, you need to click on Edit Payments option. The image for this step is given below where the Schedule Payments tab and Edit Payments option both are highlighted in Green.

Step 7

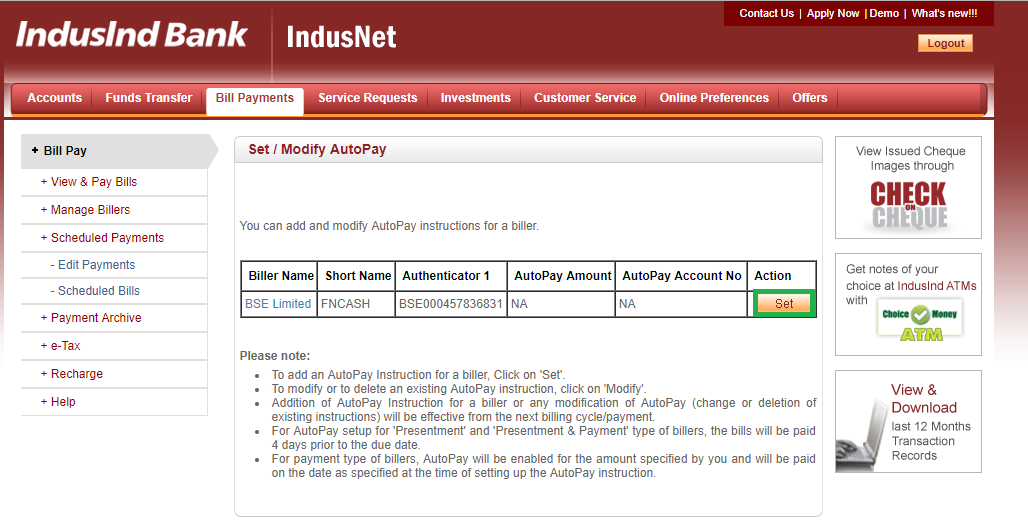
Click Set Option in Modify AutoPay Screen

Once you click on Edit Payments, a new screen opens up in which you can see the Mutual Fund Biller added. You can also see the URN of the SIP against the biller. Here, you need to click on Set option against the Mutual Fund Biller. The image for this step is given below where the Set option is highlighted in Green.

Step 8

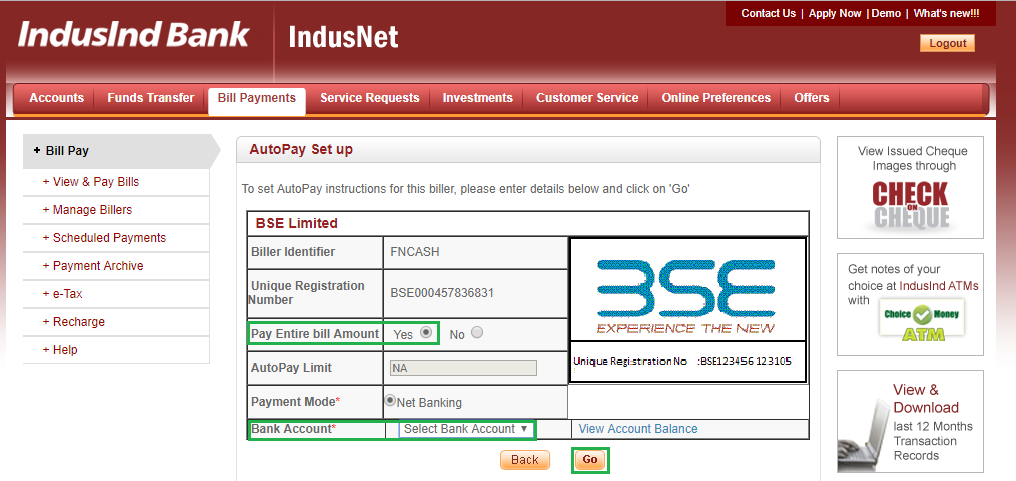
Enter Payments Details & Click on Go

In this step, you need to enter the payment details. Once you click on Set in the previous step, a new screen opens in which you need to enter the payment details. Here, against thePay Entire Bill Amount option, you need to select Yes option. Then you need to select the Payment Mode as Net Banking. Moreover, you need to select the bank account number from which you wish to make the payments. After entering all the details, you need to click on Go button which is at the bottom of the screen. The image for this step is given below where the Pay Entire Bill Amount option, Bank Account tab and Go button are highlighted in Green.

Step 9

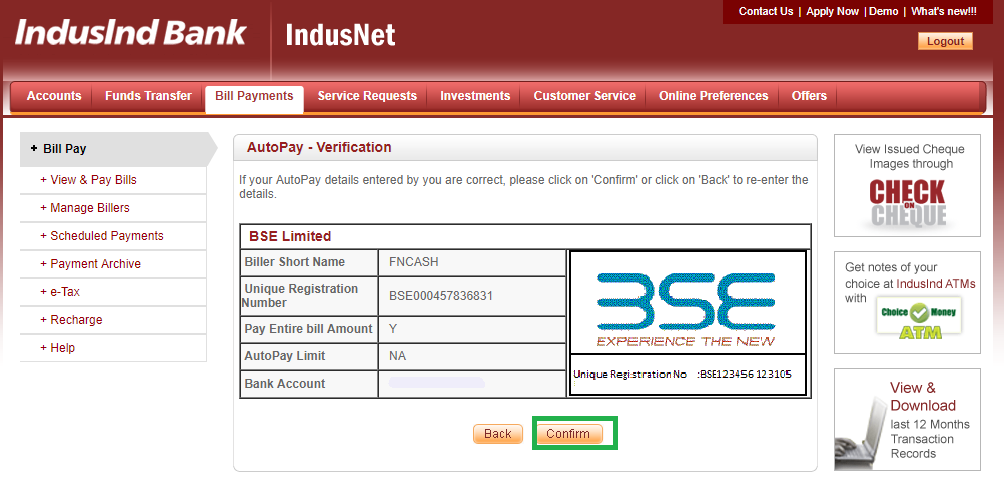
Verification of Payment Details

Once you enter the payment details and click on Go, you are redirected to a new screen in which you can verify all the details that you have entered. If you find all the details are entered correctly, then you can click on Confirm. If not, then click on Back so that you can edit the relevant details. The image for this step is given below where the Confirm button is highlighted in Green.

Step 10

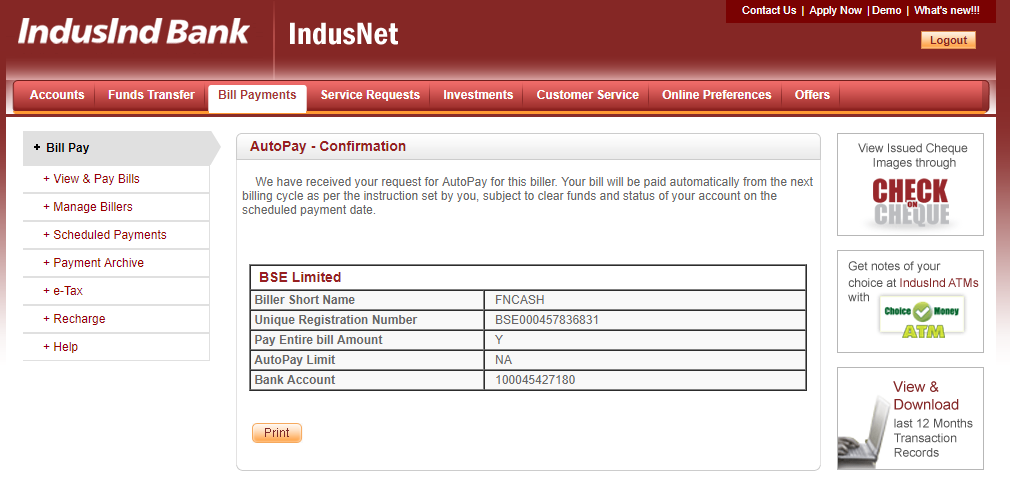
Confirmation of AutoPay Details

In this step, you get a confirmation about the AutoPay status. The image for this step is given below.

Step 11

Thus, from the above steps, it can be said that the process of adding biller for SIP transactions in IndusInd Bank is not difficult. By adding it, individuals can ensure that their SIP deductions take place in a timely manner. They just need to ensure that they have enough balance in their bank account.

Best SIPs to Invest to Earn Better Returns

Here are some of the recommend SIPs as per 5 year returns and AUM of more than INR 500 Cr

FundNAVNet Assets (Cr)Min SIP Investment3 MO (%)6 MO (%)1 YR (%)3 YR (%)5 YR (%)2024 (%)
ICICI Prudential Infrastructure Fund Growth ₹194.26
↑ 0.22
₹7,941 100 1.216.30.929.133.927.4
Motilal Oswal Midcap 30 Fund  Growth ₹104.72
↑ 0.29
₹33,609 500 6.214.73.829.13357.1
Nippon India Small Cap Fund Growth ₹168.884
↑ 0.11
₹65,922 100 316.9-5.724.23226.1
Franklin Build India Fund Growth ₹141.652
↑ 0.18
₹2,950 500 2.416.8-2.328.231.827.8
DSP India T.I.G.E.R Fund Growth ₹313.777
↓ -0.01
₹5,406 500 2.817-7.72731.532.4
Note: Returns up to 1 year are on absolute basis & more than 1 year are on CAGR basis. as on 25 Aug 25

Research Highlights & Commentary of 5 Funds showcased

CommentaryICICI Prudential Infrastructure FundMotilal Oswal Midcap 30 Fund Nippon India Small Cap FundFranklin Build India FundDSP India T.I.G.E.R Fund
Point 1Lower mid AUM (₹7,941 Cr).Upper mid AUM (₹33,609 Cr).Highest AUM (₹65,922 Cr).Bottom quartile AUM (₹2,950 Cr).Bottom quartile AUM (₹5,406 Cr).
Point 2Established history (20+ yrs).Established history (11+ yrs).Established history (14+ yrs).Established history (15+ yrs).Oldest track record among peers (21 yrs).
Point 3Rating: 3★ (bottom quartile).Rating: 3★ (bottom quartile).Rating: 4★ (upper mid).Top rated.Rating: 4★ (lower mid).
Point 4Risk profile: High.Risk profile: Moderately High.Risk profile: Moderately High.Risk profile: High.Risk profile: High.
Point 55Y return: 33.87% (top quartile).5Y return: 33.01% (upper mid).5Y return: 31.95% (lower mid).5Y return: 31.76% (bottom quartile).5Y return: 31.54% (bottom quartile).
Point 63Y return: 29.13% (top quartile).3Y return: 29.07% (upper mid).3Y return: 24.25% (bottom quartile).3Y return: 28.22% (lower mid).3Y return: 26.99% (bottom quartile).
Point 71Y return: 0.91% (upper mid).1Y return: 3.78% (top quartile).1Y return: -5.73% (bottom quartile).1Y return: -2.27% (lower mid).1Y return: -7.66% (bottom quartile).
Point 8Alpha: 0.00 (upper mid).Alpha: 3.70 (top quartile).Alpha: -3.84 (bottom quartile).Alpha: 0.00 (lower mid).Alpha: 0.00 (bottom quartile).
Point 9Sharpe: -0.42 (upper mid).Sharpe: -0.11 (top quartile).Sharpe: -0.51 (bottom quartile).Sharpe: -0.51 (lower mid).Sharpe: -0.65 (bottom quartile).
Point 10Information ratio: 0.00 (upper mid).Information ratio: 0.44 (top quartile).Information ratio: 0.00 (lower mid).Information ratio: 0.00 (bottom quartile).Information ratio: 0.00 (bottom quartile).

ICICI Prudential Infrastructure Fund

  • Lower mid AUM (₹7,941 Cr).
  • Established history (20+ yrs).
  • Rating: 3★ (bottom quartile).
  • Risk profile: High.
  • 5Y return: 33.87% (top quartile).
  • 3Y return: 29.13% (top quartile).
  • 1Y return: 0.91% (upper mid).
  • Alpha: 0.00 (upper mid).
  • Sharpe: -0.42 (upper mid).
  • Information ratio: 0.00 (upper mid).

Motilal Oswal Midcap 30 Fund 

  • Upper mid AUM (₹33,609 Cr).
  • Established history (11+ yrs).
  • Rating: 3★ (bottom quartile).
  • Risk profile: Moderately High.
  • 5Y return: 33.01% (upper mid).
  • 3Y return: 29.07% (upper mid).
  • 1Y return: 3.78% (top quartile).
  • Alpha: 3.70 (top quartile).
  • Sharpe: -0.11 (top quartile).
  • Information ratio: 0.44 (top quartile).

Nippon India Small Cap Fund

  • Highest AUM (₹65,922 Cr).
  • Established history (14+ yrs).
  • Rating: 4★ (upper mid).
  • Risk profile: Moderately High.
  • 5Y return: 31.95% (lower mid).
  • 3Y return: 24.25% (bottom quartile).
  • 1Y return: -5.73% (bottom quartile).
  • Alpha: -3.84 (bottom quartile).
  • Sharpe: -0.51 (bottom quartile).
  • Information ratio: 0.00 (lower mid).

Franklin Build India Fund

  • Bottom quartile AUM (₹2,950 Cr).
  • Established history (15+ yrs).
  • Top rated.
  • Risk profile: High.
  • 5Y return: 31.76% (bottom quartile).
  • 3Y return: 28.22% (lower mid).
  • 1Y return: -2.27% (lower mid).
  • Alpha: 0.00 (lower mid).
  • Sharpe: -0.51 (lower mid).
  • Information ratio: 0.00 (bottom quartile).

DSP India T.I.G.E.R Fund

  • Bottom quartile AUM (₹5,406 Cr).
  • Oldest track record among peers (21 yrs).
  • Rating: 4★ (lower mid).
  • Risk profile: High.
  • 5Y return: 31.54% (bottom quartile).
  • 3Y return: 26.99% (bottom quartile).
  • 1Y return: -7.66% (bottom quartile).
  • Alpha: 0.00 (bottom quartile).
  • Sharpe: -0.65 (bottom quartile).
  • Information ratio: 0.00 (bottom quartile).

1. ICICI Prudential Infrastructure Fund

To generate capital appreciation and income distribution to unit holders by investing predominantly in equity/equity related securities of the companies belonging to the infrastructure development and balance in debt securities and money market instruments.

Research Highlights for ICICI Prudential Infrastructure Fund

  • Lower mid AUM (₹7,941 Cr).
  • Established history (20+ yrs).
  • Rating: 3★ (bottom quartile).
  • Risk profile: High.
  • 5Y return: 33.87% (top quartile).
  • 3Y return: 29.13% (top quartile).
  • 1Y return: 0.91% (upper mid).
  • Alpha: 0.00 (upper mid).
  • Sharpe: -0.42 (upper mid).
  • Information ratio: 0.00 (upper mid).
  • Higher exposure to Industrials vs peer median.
  • Top bond sector: Cash Equivalent.
  • Equity-heavy allocation (~94%).
  • High-quality debt (AAA/AA ~100%).
  • Largest holding Larsen & Toubro Ltd (~9.0%).

Below is the key information for ICICI Prudential Infrastructure Fund

ICICI Prudential Infrastructure Fund
Growth
Launch Date 31 Aug 05
NAV (25 Aug 25) ₹194.26 ↑ 0.22   (0.11 %)
Net Assets (Cr) ₹7,941 on 31 Jul 25
Category Equity - Sectoral
AMC ICICI Prudential Asset Management Company Limited
Rating
Risk High
Expense Ratio 1.89
Sharpe Ratio -0.42
Information Ratio 0
Alpha Ratio 0
Min Investment 5,000
Min SIP Investment 100
Exit Load 0-1 Years (1%),1 Years and above(NIL)

Growth of 10,000 investment over the years.

DateValue
31 Jul 20₹10,000
31 Jul 21₹17,880
31 Jul 22₹21,387
31 Jul 23₹30,280
31 Jul 24₹49,231
31 Jul 25₹48,059

ICICI Prudential Infrastructure Fund SIP Returns

   
My Monthly Investment:
Investment Tenure:
Years
Expected Annual Returns:
%
Total investment amount is ₹300,000
expected amount after 5 Years is ₹689,048.
Net Profit of ₹389,048
Invest Now

Returns for ICICI Prudential Infrastructure Fund

Returns up to 1 year are on absolute basis & more than 1 year are on CAGR (Compound Annual Growth Rate) basis. as on 25 Aug 25

DurationReturns
1 Month -0.6%
3 Month 1.2%
6 Month 16.3%
1 Year 0.9%
3 Year 29.1%
5 Year 33.9%
10 Year
15 Year
Since launch 16%
Historical performance (Yearly) on absolute basis
YearReturns
2024 27.4%
2023 44.6%
2022 28.8%
2021 50.1%
2020 3.6%
2019 2.6%
2018 -14%
2017 40.8%
2016 2%
2015 -3.4%
Fund Manager information for ICICI Prudential Infrastructure Fund
NameSinceTenure
Ihab Dalwai3 Jun 178.17 Yr.
Sharmila D’mello30 Jun 223.09 Yr.

Data below for ICICI Prudential Infrastructure Fund as on 31 Jul 25

Equity Sector Allocation
SectorValue
Industrials38.68%
Basic Materials16.98%
Financial Services16.27%
Utility9.82%
Energy7.24%
Real Estate2.75%
Consumer Cyclical1.63%
Communication Services1.14%
Asset Allocation
Asset ClassValue
Cash5.5%
Equity94.5%
Top Securities Holdings / Portfolio
NameHoldingValueQuantity
Larsen & Toubro Ltd (Industrials)
Equity, Since 30 Nov 09 | LT
9%₹727 Cr1,980,204
↓ -150,000
NTPC Ltd (Utilities)
Equity, Since 29 Feb 16 | 532555
4%₹358 Cr10,679,473
↑ 3,079,473
Adani Ports & Special Economic Zone Ltd (Industrials)
Equity, Since 31 May 24 | ADANIPORTS
4%₹329 Cr2,268,659
↓ -200,000
Reliance Industries Ltd (Energy)
Equity, Since 31 Jul 23 | RELIANCE
4%₹290 Cr1,929,725
↑ 266,998
NCC Ltd (Industrials)
Equity, Since 31 Aug 21 | NCC
4%₹289 Cr12,522,005
Vedanta Ltd (Basic Materials)
Equity, Since 31 Jul 24 | 500295
4%₹284 Cr6,158,750
↑ 935,088
JM Financial Ltd (Financial Services)
Equity, Since 31 Oct 21 | JMFINANCIL
3%₹247 Cr15,506,510
↓ -2,256,731
Axis Bank Ltd (Financial Services)
Equity, Since 31 Dec 20 | 532215
3%₹227 Cr1,896,057
↑ 400,000
Kalpataru Projects International Ltd (Industrials)
Equity, Since 30 Sep 06 | KPIL
3%₹221 Cr1,803,566
↓ -100,000
AIA Engineering Ltd (Industrials)
Equity, Since 28 Feb 21 | AIAENG
3%₹219 Cr660,770
↑ 120,000

2. Motilal Oswal Midcap 30 Fund 

(Erstwhile Motilal Oswal MOSt Focused Midcap 30 Fund)

The investment objective of the Scheme is to achieve long term capital appreciation by investing in a maximum of 30 quality mid-cap companies having long-term competitive advantages and potential for growth. However, there can be no assurance or guarantee that the investment objective of the Scheme would be achieved.

Research Highlights for Motilal Oswal Midcap 30 Fund 

  • Upper mid AUM (₹33,609 Cr).
  • Established history (11+ yrs).
  • Rating: 3★ (bottom quartile).
  • Risk profile: Moderately High.
  • 5Y return: 33.01% (upper mid).
  • 3Y return: 29.07% (upper mid).
  • 1Y return: 3.78% (top quartile).
  • Alpha: 3.70 (top quartile).
  • Sharpe: -0.11 (top quartile).
  • Information ratio: 0.44 (top quartile).
  • Higher exposure to Technology vs peer median.
  • Higher exposure to Cash Equivalent (bond sector) vs peer median.
  • Equity-heavy allocation (~83%).
  • Largest holding Coforge Ltd (~10.5%).

Below is the key information for Motilal Oswal Midcap 30 Fund 

Motilal Oswal Midcap 30 Fund 
Growth
Launch Date 24 Feb 14
NAV (25 Aug 25) ₹104.72 ↑ 0.29   (0.27 %)
Net Assets (Cr) ₹33,609 on 31 Jul 25
Category Equity - Mid Cap
AMC Motilal Oswal Asset Management Co. Ltd
Rating
Risk Moderately High
Expense Ratio 1.56
Sharpe Ratio -0.11
Information Ratio 0.44
Alpha Ratio 3.7
Min Investment 5,000
Min SIP Investment 500
Exit Load 0-1 Years (1%),1 Years and above(NIL)

Growth of 10,000 investment over the years.

DateValue
31 Jul 20₹10,000
31 Jul 21₹16,540
31 Jul 22₹20,655
31 Jul 23₹26,047
31 Jul 24₹44,147
31 Jul 25₹44,850

Motilal Oswal Midcap 30 Fund  SIP Returns

   
My Monthly Investment:
Investment Tenure:
Years
Expected Annual Returns:
%
Total investment amount is ₹300,000
expected amount after 5 Years is ₹689,048.
Net Profit of ₹389,048
Invest Now

Returns for Motilal Oswal Midcap 30 Fund 

Returns up to 1 year are on absolute basis & more than 1 year are on CAGR (Compound Annual Growth Rate) basis. as on 25 Aug 25

DurationReturns
1 Month 3.5%
3 Month 6.2%
6 Month 14.7%
1 Year 3.8%
3 Year 29.1%
5 Year 33%
10 Year
15 Year
Since launch 22.7%
Historical performance (Yearly) on absolute basis
YearReturns
2024 57.1%
2023 41.7%
2022 10.7%
2021 55.8%
2020 9.3%
2019 9.7%
2018 -12.7%
2017 30.8%
2016 5.2%
2015 16.5%
Fund Manager information for Motilal Oswal Midcap 30 Fund 
NameSinceTenure
Ajay Khandelwal1 Oct 240.83 Yr.
Niket Shah1 Jul 205.09 Yr.
Rakesh Shetty22 Nov 222.69 Yr.
Sunil Sawant1 Jul 241.08 Yr.

Data below for Motilal Oswal Midcap 30 Fund  as on 31 Jul 25

Equity Sector Allocation
SectorValue
Technology33.7%
Industrials18.11%
Consumer Cyclical17.65%
Health Care4.49%
Communication Services3.99%
Real Estate2.83%
Financial Services2.61%
Asset Allocation
Asset ClassValue
Cash17.17%
Equity82.83%
Top Securities Holdings / Portfolio
NameHoldingValueQuantity
Coforge Ltd (Technology)
Equity, Since 31 Mar 23 | COFORGE
10%₹3,464 Cr18,000,000
Persistent Systems Ltd (Technology)
Equity, Since 31 Jan 23 | PERSISTENT
10%₹3,172 Cr5,250,000
Trent Ltd (Consumer Cyclical)
Equity, Since 30 Nov 24 | 500251
9%₹3,104 Cr4,992,139
↑ 2,848,945
Dixon Technologies (India) Ltd (Technology)
Equity, Since 31 Mar 23 | DIXON
9%₹2,997 Cr1,999,999
↑ 1,164,799
Kalyan Jewellers India Ltd (Consumer Cyclical)
Equity, Since 29 Feb 24 | KALYANKJIL
8%₹2,501 Cr45,000,000
↑ 1,509,750
Polycab India Ltd (Industrials)
Equity, Since 30 Sep 23 | POLYCAB
5%₹1,671 Cr2,550,000
↑ 50,000
KEI Industries Ltd (Industrials)
Equity, Since 30 Nov 24 | KEI
4%₹1,327 Cr3,500,000
↑ 750,000
Bharti Hexacom Ltd (Communication Services)
Equity, Since 31 Oct 24 | BHARTIHEXA
4%₹1,318 Cr6,750,000
Max Healthcare Institute Ltd Ordinary Shares (Healthcare)
Equity, Since 31 Mar 24 | MAXHEALTH
4%₹1,272 Cr9,969,361
Kaynes Technology India Ltd (Industrials)
Equity, Since 30 Jun 25 | KAYNES
3%₹975 Cr1,599,306
↑ 1,599,306

3. Nippon India Small Cap Fund

The primary investment objective of the scheme is to generate long term capital appreciation by investing predominantly in equity and equity related instruments of small cap companies and the secondary objective is to generate consistent returns by investing in debt and money market securities.

Research Highlights for Nippon India Small Cap Fund

  • Highest AUM (₹65,922 Cr).
  • Established history (14+ yrs).
  • Rating: 4★ (upper mid).
  • Risk profile: Moderately High.
  • 5Y return: 31.95% (lower mid).
  • 3Y return: 24.25% (bottom quartile).
  • 1Y return: -5.73% (bottom quartile).
  • Alpha: -3.84 (bottom quartile).
  • Sharpe: -0.51 (bottom quartile).
  • Information ratio: 0.00 (lower mid).
  • Top sector: Industrials.
  • Top bond sector: Cash Equivalent.
  • Equity-heavy allocation (~96%).
  • Largest holding Multi Commodity Exchange of India Ltd (~2.5%).

Below is the key information for Nippon India Small Cap Fund

Nippon India Small Cap Fund
Growth
Launch Date 16 Sep 10
NAV (25 Aug 25) ₹168.884 ↑ 0.11   (0.06 %)
Net Assets (Cr) ₹65,922 on 31 Jul 25
Category Equity - Small Cap
AMC Nippon Life Asset Management Ltd.
Rating
Risk Moderately High
Expense Ratio 1.44
Sharpe Ratio -0.51
Information Ratio 0
Alpha Ratio -3.84
Min Investment 5,000
Min SIP Investment 100
Exit Load 0-1 Years (1%),1 Years and above(NIL)

Growth of 10,000 investment over the years.

DateValue
31 Jul 20₹10,000
31 Jul 21₹21,333
31 Jul 22₹23,526
31 Jul 23₹31,952
31 Jul 24₹49,722
31 Jul 25₹46,790

Nippon India Small Cap Fund SIP Returns

   
My Monthly Investment:
Investment Tenure:
Years
Expected Annual Returns:
%
Total investment amount is ₹300,000
expected amount after 5 Years is ₹657,502.
Net Profit of ₹357,502
Invest Now

Returns for Nippon India Small Cap Fund

Returns up to 1 year are on absolute basis & more than 1 year are on CAGR (Compound Annual Growth Rate) basis. as on 25 Aug 25

DurationReturns
1 Month -0.9%
3 Month 3%
6 Month 16.9%
1 Year -5.7%
3 Year 24.2%
5 Year 32%
10 Year
15 Year
Since launch 20.8%
Historical performance (Yearly) on absolute basis
YearReturns
2024 26.1%
2023 48.9%
2022 6.5%
2021 74.3%
2020 29.2%
2019 -2.5%
2018 -16.7%
2017 63%
2016 5.6%
2015 15.1%
Fund Manager information for Nippon India Small Cap Fund
NameSinceTenure
Samir Rachh2 Jan 178.58 Yr.
Kinjal Desai25 May 187.19 Yr.

Data below for Nippon India Small Cap Fund as on 31 Jul 25

Equity Sector Allocation
SectorValue
Industrials23.43%
Financial Services14.84%
Consumer Cyclical14.65%
Basic Materials12.82%
Health Care8.57%
Consumer Defensive8.11%
Technology7.37%
Utility2.24%
Energy1.77%
Communication Services1.45%
Real Estate0.69%
Asset Allocation
Asset ClassValue
Cash4.05%
Equity95.95%
Top Securities Holdings / Portfolio
NameHoldingValueQuantity
Multi Commodity Exchange of India Ltd (Financial Services)
Equity, Since 28 Feb 21 | MCX
2%₹1,656 Cr1,851,010
HDFC Bank Ltd (Financial Services)
Equity, Since 30 Apr 22 | HDFCBANK
2%₹1,331 Cr6,650,000
Kirloskar Brothers Ltd (Industrials)
Equity, Since 31 Oct 12 | KIRLOSBROS
2%₹1,054 Cr4,472,130
Karur Vysya Bank Ltd (Financial Services)
Equity, Since 28 Feb 17 | 590003
1%₹850 Cr31,784,062
ELANTAS Beck India Ltd (Basic Materials)
Equity, Since 28 Feb 13 | 500123
1%₹827 Cr651,246
↑ 36,498
Apar Industries Ltd (Industrials)
Equity, Since 31 Mar 17 | APARINDS
1%₹784 Cr899,271
Tube Investments of India Ltd Ordinary Shares (Industrials)
Equity, Since 30 Apr 18 | TIINDIA
1%₹777 Cr2,499,222
State Bank of India (Financial Services)
Equity, Since 31 Oct 19 | SBIN
1%₹747 Cr9,100,000
Bharat Heavy Electricals Ltd (Industrials)
Equity, Since 30 Sep 22 | 500103
1%₹732 Cr27,500,000
Pfizer Ltd (Healthcare)
Equity, Since 28 Feb 22 | PFIZER
1%₹685 Cr1,206,103

4. Franklin Build India Fund

The Scheme seeks to achieve capital appreciation by investing in companies engaged directly or indirectly in infrastructure related activities.

Research Highlights for Franklin Build India Fund

  • Bottom quartile AUM (₹2,950 Cr).
  • Established history (15+ yrs).
  • Top rated.
  • Risk profile: High.
  • 5Y return: 31.76% (bottom quartile).
  • 3Y return: 28.22% (lower mid).
  • 1Y return: -2.27% (lower mid).
  • Alpha: 0.00 (lower mid).
  • Sharpe: -0.51 (lower mid).
  • Information ratio: 0.00 (bottom quartile).
  • Higher exposure to Industrials vs peer median.
  • Top bond sector: Cash Equivalent.
  • Equity-heavy allocation (~96%).
  • Largest holding Larsen & Toubro Ltd (~8.2%).

Below is the key information for Franklin Build India Fund

Franklin Build India Fund
Growth
Launch Date 4 Sep 09
NAV (25 Aug 25) ₹141.652 ↑ 0.18   (0.13 %)
Net Assets (Cr) ₹2,950 on 31 Jul 25
Category Equity - Sectoral
AMC Franklin Templeton Asst Mgmt(IND)Pvt Ltd
Rating
Risk High
Expense Ratio 2.01
Sharpe Ratio -0.51
Information Ratio 0
Alpha Ratio 0
Min Investment 5,000
Min SIP Investment 500
Exit Load 0-1 Years (1%),1 Years and above(NIL)

Growth of 10,000 investment over the years.

DateValue
31 Jul 20₹10,000
31 Jul 21₹17,587
31 Jul 22₹19,236
31 Jul 23₹26,244
31 Jul 24₹44,020
31 Jul 25₹42,375

Franklin Build India Fund SIP Returns

   
My Monthly Investment:
Investment Tenure:
Years
Expected Annual Returns:
%
Total investment amount is ₹300,000
expected amount after 5 Years is ₹657,502.
Net Profit of ₹357,502
Invest Now

Returns for Franklin Build India Fund

Returns up to 1 year are on absolute basis & more than 1 year are on CAGR (Compound Annual Growth Rate) basis. as on 25 Aug 25

DurationReturns
1 Month 0.5%
3 Month 2.4%
6 Month 16.8%
1 Year -2.3%
3 Year 28.2%
5 Year 31.8%
10 Year
15 Year
Since launch 18.1%
Historical performance (Yearly) on absolute basis
YearReturns
2024 27.8%
2023 51.1%
2022 11.2%
2021 45.9%
2020 5.4%
2019 6%
2018 -10.7%
2017 43.3%
2016 8.4%
2015 2.1%
Fund Manager information for Franklin Build India Fund
NameSinceTenure
Ajay Argal18 Oct 213.79 Yr.
Kiran Sebastian7 Feb 223.48 Yr.
Sandeep Manam18 Oct 213.79 Yr.

Data below for Franklin Build India Fund as on 31 Jul 25

Equity Sector Allocation
SectorValue
Industrials36.15%
Energy12.74%
Utility12.5%
Financial Services11.47%
Communication Services8.4%
Basic Materials6.9%
Real Estate3.07%
Consumer Cyclical2.66%
Technology1.91%
Asset Allocation
Asset ClassValue
Cash4.19%
Equity95.81%
Top Securities Holdings / Portfolio
NameHoldingValueQuantity
Larsen & Toubro Ltd (Industrials)
Equity, Since 29 Feb 20 | LT
8%₹244 Cr665,000
Reliance Industries Ltd (Energy)
Equity, Since 31 Oct 21 | RELIANCE
6%₹180 Cr1,200,000
InterGlobe Aviation Ltd (Industrials)
Equity, Since 29 Feb 20 | INDIGO
6%₹179 Cr300,000
ICICI Bank Ltd (Financial Services)
Equity, Since 31 Mar 12 | 532174
6%₹173 Cr1,200,000
Oil & Natural Gas Corp Ltd (Energy)
Equity, Since 30 Jun 19 | 500312
5%₹147 Cr6,000,000
Bharti Airtel Ltd (Communication Services)
Equity, Since 30 Sep 09 | BHARTIARTL
5%₹143 Cr710,000
NTPC Ltd (Utilities)
Equity, Since 30 Nov 16 | 532555
5%₹138 Cr4,125,000
Axis Bank Ltd (Financial Services)
Equity, Since 31 Mar 12 | 532215
4%₹120 Cr1,000,000
Power Grid Corp Of India Ltd (Utilities)
Equity, Since 28 Feb 21 | 532898
4%₹108 Cr3,600,000
Tata Power Co Ltd (Utilities)
Equity, Since 31 Jan 25 | 500400
3%₹81 Cr2,000,000

5. DSP India T.I.G.E.R Fund

To generate capital appreciation, from a portfolio that is substantially constituted of equity securities and equity related securities of corporates, which could benefit from structural changes brought about by continuing liberalization in economic policies by the government and/or continuing investments in infrastructure, both by the public and private sector.

Research Highlights for DSP India T.I.G.E.R Fund

  • Bottom quartile AUM (₹5,406 Cr).
  • Oldest track record among peers (21 yrs).
  • Rating: 4★ (lower mid).
  • Risk profile: High.
  • 5Y return: 31.54% (bottom quartile).
  • 3Y return: 26.99% (bottom quartile).
  • 1Y return: -7.66% (bottom quartile).
  • Alpha: 0.00 (bottom quartile).
  • Sharpe: -0.65 (bottom quartile).
  • Information ratio: 0.00 (bottom quartile).
  • Top sector: Industrials.
  • Top bond sector: Cash Equivalent.
  • Equity-heavy allocation (~93%).
  • Largest holding Larsen & Toubro Ltd (~4.6%).

Below is the key information for DSP India T.I.G.E.R Fund

DSP India T.I.G.E.R Fund
Growth
Launch Date 11 Jun 04
NAV (25 Aug 25) ₹313.777 ↓ -0.01   (0.00 %)
Net Assets (Cr) ₹5,406 on 31 Jul 25
Category Equity - Sectoral
AMC DSP BlackRock Invmt Managers Pvt. Ltd.
Rating
Risk High
Expense Ratio 1.89
Sharpe Ratio -0.65
Information Ratio 0
Alpha Ratio 0
Min Investment 1,000
Min SIP Investment 500
Exit Load 0-12 Months (1%),12 Months and above(NIL)

Growth of 10,000 investment over the years.

DateValue
31 Jul 20₹10,000
31 Jul 21₹18,502
31 Jul 22₹20,142
31 Jul 23₹27,621
31 Jul 24₹47,125
31 Jul 25₹42,767

DSP India T.I.G.E.R Fund SIP Returns

   
My Monthly Investment:
Investment Tenure:
Years
Expected Annual Returns:
%
Total investment amount is ₹300,000
expected amount after 5 Years is ₹657,502.
Net Profit of ₹357,502
Invest Now

Returns for DSP India T.I.G.E.R Fund

Returns up to 1 year are on absolute basis & more than 1 year are on CAGR (Compound Annual Growth Rate) basis. as on 25 Aug 25

DurationReturns
1 Month 0.5%
3 Month 2.8%
6 Month 17%
1 Year -7.7%
3 Year 27%
5 Year 31.5%
10 Year
15 Year
Since launch 17.6%
Historical performance (Yearly) on absolute basis
YearReturns
2024 32.4%
2023 49%
2022 13.9%
2021 51.6%
2020 2.7%
2019 6.7%
2018 -17.2%
2017 47%
2016 4.1%
2015 0.7%
Fund Manager information for DSP India T.I.G.E.R Fund
NameSinceTenure
Rohit Singhania21 Jun 1015.12 Yr.

Data below for DSP India T.I.G.E.R Fund as on 31 Jul 25

Equity Sector Allocation
SectorValue
Industrials28.5%
Basic Materials15.17%
Utility10.47%
Financial Services10.42%
Consumer Cyclical8.59%
Health Care6.63%
Energy5.45%
Communication Services2.61%
Technology2.16%
Real Estate1.62%
Consumer Defensive1.27%
Asset Allocation
Asset ClassValue
Cash7.11%
Equity92.89%
Top Securities Holdings / Portfolio
NameHoldingValueQuantity
Larsen & Toubro Ltd (Industrials)
Equity, Since 30 Jun 04 | LT
5%₹256 Cr697,669
NTPC Ltd (Utilities)
Equity, Since 30 Nov 17 | 532555
4%₹239 Cr7,145,883
Apollo Hospitals Enterprise Ltd (Healthcare)
Equity, Since 31 Dec 24 | APOLLOHOSP
3%₹178 Cr245,928
Power Grid Corp Of India Ltd (Utilities)
Equity, Since 31 Jan 25 | 532898
3%₹167 Cr5,567,574
Multi Commodity Exchange of India Ltd (Financial Services)
Equity, Since 31 May 25 | MCX
3%₹147 Cr164,204
Rainbow Childrens Medicare Ltd (Healthcare)
Equity, Since 31 Jan 25 | 543524
3%₹146 Cr935,870
Amber Enterprises India Ltd Ordinary Shares (Consumer Cyclical)
Equity, Since 31 Dec 24 | AMBER
3%₹140 Cr207,277
Bharti Airtel Ltd (Communication Services)
Equity, Since 31 Oct 18 | BHARTIARTL
3%₹138 Cr688,435
Kirloskar Oil Engines Ltd (Industrials)
Equity, Since 31 Mar 23 | KIRLOSENG
2%₹137 Cr1,608,534
Solar Industries India Ltd (Basic Materials)
Equity, Since 31 Mar 14 | SOLARINDS
2%₹132 Cr75,291

In case of any further queries, you can contact us on 8451864111 on any working day between 9.30am to 6.30 pm or write a mail to us anytime at support@fincash.com or chat with us by logging onto our website www.fincash.com.

Disclaimer:
All efforts have been made to ensure the information provided here is accurate. However, no guarantees are made regarding correctness of data. Please verify with scheme information document before making any investment.
How helpful was this page ?
Rated 4, based on 7 reviews.
POST A COMMENT