पंजाब नेशनल बैंक में एसआईपी लेनदेन के लिए बिलर कैसे जोड़ें?
मेंसिप या व्यवस्थितनिवेश योजना व्यक्तियों में छोटी राशि जमाम्यूचुअल फंड निश्चित अंतराल पर योजनाएं। चूंकि पैसे नियमित अंतराल पर काटे जाते हैं, इसलिए व्यक्ति बिलर्स को अपने में जोड़कर भुगतान प्रक्रिया को आसान बना सकते हैंबैंक कारण। एसआईपी लेनदेन के लिए बिलर जोड़ने के लिए, व्यक्तियों के पास एसआईपी लेनदेन का विशिष्ट पंजीकरण संख्या या यूआरएन होना चाहिए। पहला एसआईपी भुगतान करने के बाद व्यक्तियों को यह नंबर मिलता है। प्रत्येक बैंक के लिए बिलर जोड़ने की प्रक्रिया अलग है। तो, आइए पंजाब में एसआईपी लेनदेन के लिए बिलर जोड़ने की प्रक्रिया को समझते हैंराष्ट्रीय बैंक. इन स्टेप्स को मोबाइल बैंकिंग की मदद से नीचे समझाया गया है।
अपना पीएनबी मोबाइल एप्लिकेशन खोलें
लॉगिन की प्रक्रिया में पहला कदम अपने मोबाइल पर पीएनबी मोबाइल एप्लिकेशन दर्ज करना है। इस चरण की छवि नीचे दी गई है जहां पीएनबी मोबाइल एप्लिकेशन का आइकन हरे रंग में हाइलाइट किया गया है।

यूजर आईडी और एमपिन डालकर अपने खाते में लॉग इन करें
एक बार जब आप पीएनबी एप्लिकेशन पर क्लिक करते हैं, तो एक नई स्क्रीन खुलती है। इस स्क्रीन में आपको अपना यूजर आईडी और एमपिन डालना होगा। इस चरण के लिए छवि नीचे दी गई है जहां उपयोगकर्ता आईडी और एमपिन ब्लॉक हरे रंग में हाइलाइट किए गए हैं।

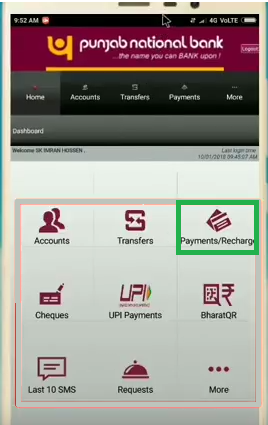
होम स्क्रीन में भुगतान रिचार्ज का चयन करें
होम स्क्रीन पर अपनी यूजर आईडी और एमपिन से लॉग इन करने के बाद, आपको पर क्लिक करना होगाभुगतान/रिचार्ज विकल्प। इस चरण के लिए चित्र भुगतान/रिचार्ज टैब के नीचे हरे रंग में हाइलाइट किया गया है।
रजिस्टर बिलर पर क्लिक करें
यह बिलर जोड़ने की प्रक्रिया का चौथा चरण है। एक बार जब आप भुगतान/रिचार्ज पर क्लिक करते हैं, तो एक नया टैब खुलता है जिसमें विभिन्न विकल्प होते हैं जैसे रजिस्टर बिलर, बिल देखें और भुगतान करें, बिलर देखें, और इसी तरह। इस स्टेप में आपको पर क्लिक करना होगारजिस्टर बिलर विकल्प। इस चरण की छवि इस प्रकार है जहां हरे रंग में रजिस्टर बिलर विकल्प हाइलाइट किया गया है।

म्यूचुअल फंड विकल्प पर क्लिक करें
एक बार जब आप रजिस्टर बिलर पर क्लिक करते हैं, तो एक नई स्क्रीन खुलती है जो विभिन्न बिलर्स को दिखाती है जिन्हें जोड़ा जा सकता है। कुछ विकल्पों में शामिल हैंबीमा, सदस्यता, दूरसंचार, और इसी तरह। यहां, आपको चयन करने की आवश्यकता हैम्यूचुअल फंड विकल्प। इस चरण की छवि इस प्रकार है जहां हरे रंग में म्यूचुअल फंड विकल्प हाइलाइट किया गया है।

बीएसई लिमिटेड का चयन करें
एक बार जब आप पिछले चरण में म्यूचुअल फंड पर क्लिक करते हैं, तो आप एक नई स्क्रीन पर रीडायरेक्ट हो जाते हैं जहां बहुत सारे विकल्प होते हैं; आपको चयन करने की आवश्यकता हैBSE Limited. इस चरण की छवि इस प्रकार है जहां बीएसई लिमिटेड को हरे रंग में हाइलाइट किया गया है।

यूआरएन और उपनाम दर्ज करें
इस चरण में, आपको उपनाम के साथ एसआईपी लेनदेन का विशिष्ट पंजीकरण संख्या या यूआरएन दर्ज करना होगा। यह यूआरएन नंबर वह है जिसे आप फिनकैश से अपने ईमेल में प्राप्त करते हैं। यदि आपको URN प्राप्त नहीं होता है; तो आप इसे * पर लॉग इन करके प्राप्त कर सकते हैंआपका फिनकैश खाता* और माई एसआईपी सेक्शन में जाकर। विवरण दर्ज करने के बाद, आपको जारी रखें पर क्लिक करना होगा। इस चरण की छवि इस प्रकार है जहाँ URN नंबर बॉक्स को हरे रंग में हाइलाइट किया गया है।

एक बार जब आप जारी रखें पर क्लिक करते हैं, तो नई स्क्रीन में आपको ऑटो भुगतान विकल्पों से संबंधित विवरण जोड़ना होगा जिसमें; आपको ऑटो पे के लिए चयन करना होगा। फिर आपको अपने पंजीकृत मोबाइल नंबर पर प्राप्त ओटीपी दर्ज करना होगा। एक बार जब आप ओटीपी दर्ज करते हैं, तो बिलर जोड़ने की प्रक्रिया की पुष्टि हो जाती है.
इस प्रकार, उपरोक्त चरणों से, हम कह सकते हैं कि पंजाब नेशनल बैंक में बिलर जोड़ने की प्रक्रिया आसान है।
बेहतर रिटर्न अर्जित करने के लिए निवेश करने के लिए सर्वश्रेष्ठ एसआईपी
यहाँ कुछ अनुशंसित SIP हैं:5 वर्ष से अधिक का रिटर्न और एयूएमINR 500 करोड़:
Fund NAV Net Assets (Cr) Min SIP Investment 3 MO (%) 6 MO (%) 1 YR (%) 3 YR (%) 5 YR (%) 2025 (%) ICICI Prudential Infrastructure Fund Growth ₹202.13
↑ 1.69 ₹8,550 100 0.2 5.6 3.9 18.9 22.9 6.7 SBI Gold Fund Growth ₹41.1638
↑ 0.00 ₹15,294 500 -4 -20.3 42.6 32 22.7 71.5 SBI PSU Fund Growth ₹34.0268
↑ 0.03 ₹6,684 500 -6.4 -3.2 7.7 22.6 22.6 11.3 ICICI Prudential Regular Gold Savings Fund Growth ₹43.5288
↑ 0.04 ₹6,265 100 -3.9 -21 42.4 31.9 22.6 72 Axis Gold Fund Growth ₹40.8476
↑ 0.04 ₹2,828 1,000 -3.9 -20.9 42 31.5 22.6 69.8 Note: Returns up to 1 year are on absolute basis & more than 1 year are on CAGR basis. as on 29 Jul 26 Research Highlights & Commentary of 5 Funds showcased
Commentary ICICI Prudential Infrastructure Fund SBI Gold Fund SBI PSU Fund ICICI Prudential Regular Gold Savings Fund Axis Gold Fund Point 1 Upper mid AUM (₹8,550 Cr). Highest AUM (₹15,294 Cr). Lower mid AUM (₹6,684 Cr). Bottom quartile AUM (₹6,265 Cr). Bottom quartile AUM (₹2,828 Cr). Point 2 Oldest track record among peers (20 yrs). Established history (14+ yrs). Established history (16+ yrs). Established history (14+ yrs). Established history (14+ yrs). Point 3 Top rated. Rating: 2★ (upper mid). Rating: 2★ (lower mid). Rating: 1★ (bottom quartile). Rating: 1★ (bottom quartile). Point 4 Risk profile: High. Risk profile: Moderately High. Risk profile: High. Risk profile: Moderately High. Risk profile: Moderately High. Point 5 5Y return: 22.91% (top quartile). 5Y return: 22.68% (upper mid). 5Y return: 22.65% (lower mid). 5Y return: 22.63% (bottom quartile). 5Y return: 22.56% (bottom quartile). Point 6 3Y return: 18.93% (bottom quartile). 3Y return: 31.98% (top quartile). 3Y return: 22.56% (bottom quartile). 3Y return: 31.91% (upper mid). 3Y return: 31.54% (lower mid). Point 7 1Y return: 3.95% (bottom quartile). 1Y return: 42.57% (top quartile). 1Y return: 7.71% (bottom quartile). 1Y return: 42.40% (upper mid). 1Y return: 42.02% (lower mid). Point 8 Alpha: 0.00 (top quartile). 1M return: 0.06% (lower mid). Alpha: -0.30 (bottom quartile). 1M return: 0.31% (top quartile). 1M return: 0.29% (upper mid). Point 9 Sharpe: -0.07 (bottom quartile). Alpha: 0.00 (upper mid). Sharpe: 0.12 (bottom quartile). Alpha: 0.00 (lower mid). Alpha: 0.00 (bottom quartile). Point 10 Information ratio: 0.00 (top quartile). Sharpe: 1.29 (upper mid). Information ratio: -0.11 (bottom quartile). Sharpe: 1.22 (lower mid). Sharpe: 1.35 (top quartile). ICICI Prudential Infrastructure Fund
SBI Gold Fund
SBI PSU Fund
ICICI Prudential Regular Gold Savings Fund
Axis Gold Fund
To generate capital appreciation and income distribution to unit holders by investing predominantly in equity/equity related securities of the companies belonging to the infrastructure development and balance in debt securities and money market instruments. Below is the key information for ICICI Prudential Infrastructure Fund Returns up to 1 year are on The scheme seeks to provide returns that closely correspond to returns provided by SBI - ETF Gold (Previously known as SBI GETS). Research Highlights for SBI Gold Fund Below is the key information for SBI Gold Fund Returns up to 1 year are on The objective of the scheme would be to provide investors with opportunities for long-term growth in capital along with the liquidity of an open-ended scheme through an active management of investments in a diversified basket of equity stocks of domestic Public Sector Undertakings and in debt and money market instruments issued by PSUs AND others. Research Highlights for SBI PSU Fund Below is the key information for SBI PSU Fund Returns up to 1 year are on ICICI Prudential Regular Gold Savings Fund (the Scheme) is a fund of funds scheme with the primary objective to generate returns by investing in units of ICICI Prudential Gold Exchange Traded Fund (IPru Gold ETF).
However, there can be no assurance that the investment objectives of the Scheme will be realized. Research Highlights for ICICI Prudential Regular Gold Savings Fund Below is the key information for ICICI Prudential Regular Gold Savings Fund Returns up to 1 year are on To generate returns that closely correspond to returns generated by Axis Gold ETF. Research Highlights for Axis Gold Fund Below is the key information for Axis Gold Fund Returns up to 1 year are on 1. ICICI Prudential Infrastructure Fund
ICICI Prudential Infrastructure Fund
Growth Launch Date 31 Aug 05 NAV (29 Jul 26) ₹202.13 ↑ 1.69 (0.84 %) Net Assets (Cr) ₹8,550 on 30 Jun 26 Category Equity - Sectoral AMC ICICI Prudential Asset Management Company Limited Rating ☆☆☆ Risk High Expense Ratio 1.89 Sharpe Ratio -0.07 Information Ratio 0 Alpha Ratio 0 Min Investment 5,000 Min SIP Investment 100 Exit Load 0-1 Years (1%),1 Years and above(NIL) Growth of 10,000 investment over the years.
Date Value 30 Jun 21 ₹10,000 30 Jun 22 ₹11,534 30 Jun 23 ₹16,346 30 Jun 24 ₹27,296 30 Jun 25 ₹28,743 30 Jun 26 ₹29,425 Returns for ICICI Prudential Infrastructure Fund
absolute basis & more than 1 year are on CAGR (Compound Annual Growth Rate) basis. as on 29 Jul 26 Duration Returns 1 Month -0.7% 3 Month 0.2% 6 Month 5.6% 1 Year 3.9% 3 Year 18.9% 5 Year 22.9% 10 Year 15 Year Since launch 15.5% Historical performance (Yearly) on absolute basis
Year Returns 2025 6.7% 2024 27.4% 2023 44.6% 2022 28.8% 2021 50.1% 2020 3.6% 2019 2.6% 2018 -14% 2017 40.8% 2016 2% Fund Manager information for ICICI Prudential Infrastructure Fund
Name Since Tenure Ihab Dalwai 3 Jun 17 9.08 Yr. Sharmila D’mello 30 Jun 22 4.01 Yr. Data below for ICICI Prudential Infrastructure Fund as on 30 Jun 26
Equity Sector Allocation
Sector Value Industrials 47.57% Financial Services 10.57% Utility 10.32% Basic Materials 9.74% Real Estate 8.09% Energy 5.04% Consumer Cyclical 1.98% Communication Services 0.09% Asset Allocation
Asset Class Value Cash 5.83% Equity 94.17% Top Securities Holdings / Portfolio
Name Holding Value Quantity InterGlobe Aviation Ltd (Industrials)
Equity, Since 28 Feb 23 | INDIGO9% ₹745 Cr 1,691,985
↑ 50,000 Larsen & Toubro Ltd (Industrials)
Equity, Since 30 Nov 09 | LT7% ₹614 Cr 1,505,704 Oberoi Realty Ltd (Real Estate)
Equity, Since 31 May 23 | OBEROIRLTY4% ₹365 Cr 2,139,426 Gujarat Energy Ltd (Utilities)
Equity, Since 31 Jan 23 | GUJGASLTD4% ₹340 Cr 8,482,024
↑ 156,557 NTPC Ltd (Utilities)
Equity, Since 29 Feb 16 | NTPC4% ₹334 Cr 8,626,448 Shree Cement Ltd (Basic Materials)
Equity, Since 30 Apr 24 | SHREECEM3% ₹270 Cr 106,892
↑ 3,387 Kalpataru Projects International Ltd (Industrials)
Equity, Since 30 Sep 06 | KPIL3% ₹262 Cr 2,005,608 AIA Engineering Ltd (Industrials)
Equity, Since 28 Feb 21 | AIAENG3% ₹258 Cr 572,697 HDFC Bank Ltd (Financial Services)
Equity, Since 31 Jan 22 | HDFCBANK3% ₹250 Cr 3,357,506
↑ 1,057,506 Container Corporation of India Ltd (Industrials)
Equity, Since 31 Jan 16 | CONCOR3% ₹227 Cr 4,885,153 2. SBI Gold Fund
SBI Gold Fund
Growth Launch Date 12 Sep 11 NAV (29 Jul 26) ₹41.1638 ↑ 0.00 (0.01 %) Net Assets (Cr) ₹15,294 on 30 Jun 26 Category Gold - Gold AMC SBI Funds Management Private Limited Rating ☆☆ Risk Moderately High Expense Ratio 0.3 Sharpe Ratio 1.29 Information Ratio 0 Alpha Ratio 0 Min Investment 5,000 Min SIP Investment 500 Exit Load 0-1 Years (1%),1 Years and above(NIL) Growth of 10,000 investment over the years.
Date Value 30 Jun 21 ₹10,000 30 Jun 22 ₹10,828 30 Jun 23 ₹12,154 30 Jun 24 ₹14,949 30 Jun 25 ₹19,644 30 Jun 26 ₹28,455 Returns for SBI Gold Fund
absolute basis & more than 1 year are on CAGR (Compound Annual Growth Rate) basis. as on 29 Jul 26 Duration Returns 1 Month 0.1% 3 Month -4% 6 Month -20.3% 1 Year 42.6% 3 Year 32% 5 Year 22.7% 10 Year 15 Year Since launch 10% Historical performance (Yearly) on absolute basis
Year Returns 2025 71.5% 2024 19.6% 2023 14.1% 2022 12.6% 2021 -5.7% 2020 27.4% 2019 22.8% 2018 6.4% 2017 3.5% 2016 10% Fund Manager information for SBI Gold Fund
Name Since Tenure Viral Chhadva 1 Mar 26 0.33 Yr. Data below for SBI Gold Fund as on 30 Jun 26
Asset Allocation
Asset Class Value Cash 1.64% Other 98.36% Top Securities Holdings / Portfolio
Name Holding Value Quantity SBI Gold ETF
- | -100% ₹16,542 Cr 1,246,686,194
↑ 13,950,000 Net Receivable / Payable
CBLO | -0% -₹55 Cr Treps
CBLO/Reverse Repo | -0% ₹45 Cr 3. SBI PSU Fund
SBI PSU Fund
Growth Launch Date 7 Jul 10 NAV (29 Jul 26) ₹34.0268 ↑ 0.03 (0.10 %) Net Assets (Cr) ₹6,684 on 30 Jun 26 Category Equity - Sectoral AMC SBI Funds Management Private Limited Rating ☆☆ Risk High Expense Ratio 1.89 Sharpe Ratio 0.12 Information Ratio -0.11 Alpha Ratio -0.3 Min Investment 5,000 Min SIP Investment 500 Exit Load 0-1 Years (1%),1 Years and above(NIL) Growth of 10,000 investment over the years.
Date Value 30 Jun 21 ₹10,000 30 Jun 22 ₹9,973 30 Jun 23 ₹13,609 30 Jun 24 ₹26,792 30 Jun 25 ₹26,602 30 Jun 26 ₹28,255 Returns for SBI PSU Fund
absolute basis & more than 1 year are on CAGR (Compound Annual Growth Rate) basis. as on 29 Jul 26 Duration Returns 1 Month -1.8% 3 Month -6.4% 6 Month -3.2% 1 Year 7.7% 3 Year 22.6% 5 Year 22.6% 10 Year 15 Year Since launch 7.9% Historical performance (Yearly) on absolute basis
Year Returns 2025 11.3% 2024 23.5% 2023 54% 2022 29% 2021 32.4% 2020 -10% 2019 6% 2018 -23.8% 2017 21.9% 2016 16.2% Fund Manager information for SBI PSU Fund
Name Since Tenure Rohit Shimpi 1 Jun 24 2.08 Yr. Data below for SBI PSU Fund as on 30 Jun 26
Equity Sector Allocation
Sector Value Financial Services 32.54% Utility 31.22% Industrials 14.07% Energy 11.97% Basic Materials 6.94% Asset Allocation
Asset Class Value Cash 3.18% Equity 96.74% Debt 0.07% Top Securities Holdings / Portfolio
Name Holding Value Quantity State Bank of India (Financial Services)
Equity, Since 31 Jul 10 | SBIN17% ₹1,112 Cr 11,527,500
↑ 1,000,000 GAIL (India) Ltd (Utilities)
Equity, Since 31 May 24 | GAIL10% ₹628 Cr 38,150,000 NTPC Ltd (Utilities)
Equity, Since 31 Jul 10 | NTPC9% ₹597 Cr 15,443,244 Bharat Electronics Ltd (Industrials)
Equity, Since 30 Jun 24 | BEL9% ₹583 Cr 14,185,000
↑ 800,000 Power Grid Corp Of India Ltd (Utilities)
Equity, Since 31 Jul 10 | POWERGRID9% ₹579 Cr 19,935,554 Oil & Natural Gas Corp Ltd (Energy)
Equity, Since 31 May 20 | ONGC6% ₹389 Cr 14,655,000 Bank of Baroda (Financial Services)
Equity, Since 31 Aug 24 | BANKBARODA5% ₹352 Cr 13,100,000 Bharat Petroleum Corp Ltd (Energy)
Equity, Since 31 Aug 24 | BPCL4% ₹289 Cr 9,700,000 Bharat Heavy Electricals Ltd (Industrials)
Equity, Since 30 Jun 25 | BHEL4% ₹271 Cr 6,500,000 NMDC Ltd (Basic Materials)
Equity, Since 31 Oct 23 | NMDC4% ₹245 Cr 27,900,000 4. ICICI Prudential Regular Gold Savings Fund
ICICI Prudential Regular Gold Savings Fund
Growth Launch Date 11 Oct 11 NAV (29 Jul 26) ₹43.5288 ↑ 0.04 (0.09 %) Net Assets (Cr) ₹6,265 on 30 Jun 26 Category Gold - Gold AMC ICICI Prudential Asset Management Company Limited Rating ☆ Risk Moderately High Expense Ratio 0.38 Sharpe Ratio 1.22 Information Ratio 0 Alpha Ratio 0 Min Investment 5,000 Min SIP Investment 100 Exit Load 0-15 Months (2%),15 Months and above(NIL) Growth of 10,000 investment over the years.
Date Value 30 Jun 21 ₹10,000 30 Jun 22 ₹10,811 30 Jun 23 ₹12,106 30 Jun 24 ₹14,939 30 Jun 25 ₹19,567 30 Jun 26 ₹28,290 Returns for ICICI Prudential Regular Gold Savings Fund
absolute basis & more than 1 year are on CAGR (Compound Annual Growth Rate) basis. as on 29 Jul 26 Duration Returns 1 Month 0.3% 3 Month -3.9% 6 Month -21% 1 Year 42.4% 3 Year 31.9% 5 Year 22.6% 10 Year 15 Year Since launch 10.5% Historical performance (Yearly) on absolute basis
Year Returns 2025 72% 2024 19.5% 2023 13.5% 2022 12.7% 2021 -5.4% 2020 26.6% 2019 22.7% 2018 7.4% 2017 0.8% 2016 8.9% Fund Manager information for ICICI Prudential Regular Gold Savings Fund
Name Since Tenure Manish Banthia 27 Sep 12 13.77 Yr. Nishit Patel 29 Dec 20 5.51 Yr. Ashwini Bharucha 1 Nov 25 0.66 Yr. Venus Ahuja 1 Nov 25 0.66 Yr. Data below for ICICI Prudential Regular Gold Savings Fund as on 30 Jun 26
Asset Allocation
Asset Class Value Cash 1.86% Other 98.14% Top Securities Holdings / Portfolio
Name Holding Value Quantity ICICI Pru Gold ETF
- | -100% ₹6,851 Cr 514,675,516
↑ 10,666,563 Treps
CBLO/Reverse Repo | -0% ₹22 Cr Net Current Assets
Net Current Assets | -0% -₹18 Cr 5. Axis Gold Fund
Axis Gold Fund
Growth Launch Date 20 Oct 11 NAV (29 Jul 26) ₹40.8476 ↑ 0.04 (0.09 %) Net Assets (Cr) ₹2,828 on 30 Jun 26 Category Gold - Gold AMC Axis Asset Management Company Limited Rating ☆ Risk Moderately High Expense Ratio 0.5 Sharpe Ratio 1.35 Information Ratio 0 Alpha Ratio 0 Min Investment 5,000 Min SIP Investment 1,000 Exit Load 0-1 Years (1%),1 Years and above(NIL) Growth of 10,000 investment over the years.
Date Value 30 Jun 21 ₹10,000 30 Jun 22 ₹10,819 30 Jun 23 ₹12,177 30 Jun 24 ₹14,959 30 Jun 25 ₹19,547 30 Jun 26 ₹28,179 Returns for Axis Gold Fund
absolute basis & more than 1 year are on CAGR (Compound Annual Growth Rate) basis. as on 29 Jul 26 Duration Returns 1 Month 0.3% 3 Month -3.9% 6 Month -20.9% 1 Year 42% 3 Year 31.5% 5 Year 22.6% 10 Year 15 Year Since launch 10% Historical performance (Yearly) on absolute basis
Year Returns 2025 69.8% 2024 19.2% 2023 14.7% 2022 12.5% 2021 -4.7% 2020 26.9% 2019 23.1% 2018 8.3% 2017 0.7% 2016 10.7% Fund Manager information for Axis Gold Fund
Name Since Tenure Aditya Pagaria 9 Nov 21 4.64 Yr. Pratik Tibrewal 1 Feb 25 1.41 Yr. Data below for Axis Gold Fund as on 30 Jun 26
Asset Allocation
Asset Class Value Cash 1.81% Other 98.19% Top Securities Holdings / Portfolio
Name Holding Value Quantity Axis Gold ETF
- | -100% ₹3,091 Cr 238,687,058
↑ 2,659,572 Clearing Corporation Of India Ltd
CBLO | -0% ₹6 Cr Net Receivables / (Payables)
CBLO | -0% -₹5 Cr
किसी भी अन्य प्रश्न के मामले में, आप किसी भी कार्य दिवस पर सुबह 9.30 बजे से शाम 6.30 बजे के बीच 8451864111 पर हमसे संपर्क कर सकते हैं या हमें किसी भी समय एक मेल लिख सकते हैं।support@fincash.com या हमारी वेबसाइट पर लॉग इन करके हमारे साथ चैट करेंwww.fincash.com.
यहां प्रदान की गई जानकारी सटीक है, यह सुनिश्चित करने के लिए सभी प्रयास किए गए हैं। हालांकि, डेटा की शुद्धता के संबंध में कोई गारंटी नहीं दी जाती है। कृपया कोई भी निवेश करने से पहले योजना सूचना दस्तावेज के साथ सत्यापित करें।
")


AMFI Registration No. 112358 | CIN: U74999MH2016PTC282153
Shepard Technologies Pvt. Ltd. (with ARN code 112358) makes no warranties or representations, express or implied, on products offered through the platform. It accepts no liability for any damages or losses, however caused, in connection with the use of, or on the reliance of its product or related services. Terms and conditions of the website are applicable.
©2026 Shepard Technologies Private Limited. All Rights Reserved
Research Highlights for ICICI Prudential Infrastructure Fund