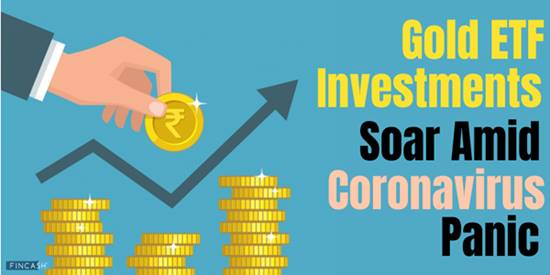
निवेशकों को कोरोनावायरस के बारे में चिंता क्यों नहीं करनी चाहिए?
दुनियाभर में कोरोनावायरस ट्रेंड कर रहा है। चीन में इसके बड़े पैमाने पर प्रकोप के साथ, देश अपने आर्थिक और राजकोषीय विकास में मंदी का अनुभव कर रहा है। अन्य देशों जैसे यू.एस., सिंगापुर, यूके, मलेशिया, थाईलैंड, आदि ने भी कुछ उलटा असर महसूस किया है।
विभिन्न फार्मा उत्पादों की कीमतें बढ़ गई हैं और निवेशकों मेंमंडी मरे हुए डरे हुए हैं। और चूंकि भारत चीनी उत्पादों के सबसे बड़े आयातकों में से एक है, इसलिए भारतीय निवेशकों के बीच बाजार में मंदी का डर बना हुआ है।

निवेशकों के लिए अच्छी खबर!
उद्योग जगत के जानकारों ने पूरी स्थिति का अध्ययन किया है और हर निवेशक की दिशा में हरी झंडी दिखा रहे हैं।
हाल ही में आई एक रिपोर्ट के अनुसार, आर्थिक मामलों के सचिव अतनु चक्रवर्ती ने कहा कि कोरोनावायरस का प्रकोप भारतीय आर्थिक गतिविधियों को प्रभावित नहीं करेगा। इसके अलावा, रिपोर्ट में यह भी बताया गया है कि बैंकरों ने कहा है कि वे अभी तक ऐसा कुछ भी नहीं देख पाए हैं जिससे बैंक पर प्रभाव पड़े।अर्थव्यवस्था.
आपको चिंता क्यों नहीं करनी चाहिए?
ऐतिहासिक रूप से, उभरती बीमारियों के लिए बाजार की प्रतिक्रिया अल्पकालिक रही है। देखा जाए तो सीवियर एक्यूट रेस्पिरेटरी सिंड्रोम (SARS) 2003, जो कोरोनावायरस से मिलता-जुलता था। वास्तव में, इसने 8100 लोगों को प्रभावित किया है और 770 लोगों की मौत हुई है, लेकिन उस समय SARS ही एकमात्र ऐसी चीज थी जब स्टॉक में उछाल आया।
सबसे विशेष रूप से, स्वाइन फ्लू संकट के बाद अत्यधिक लाभ हुआ और उसके बाद एक महान प्रतिक्षेप हुआमंदी.
भारत ने विश्व स्तर पर विभिन्न प्रकोपों को देखा है जिसने भारतीय अर्थव्यवस्था को भी प्रभावित किया है। हालांकि, अर्थव्यवस्था वापस उछाल देती है और निवेशकों को हमेशा अधिक निवेश करने के लिए प्रोत्साहित किया जाता है जब अर्थव्यवस्था एक झटके का सामना कर रही हो।
अल्पकालिक बाजार में उतार-चढ़ाव उन निवेशकों के रिटर्न को प्रभावित नहीं कर सकता है जो लंबी अवधि के निवेश पर ध्यान केंद्रित करते हैं क्योंकि बाजार लंबे समय में वापस उछाल देता है।
Talk to our investment specialist
इसलिए, लॉन्गटर्म पर ध्यान दें!
निवेशकों को शांत रहना चाहिए और लंबी अवधि के लाभ पर अपना ध्यान केंद्रित रखना चाहिए। अल्पकालिक बाजार में उतार-चढ़ाव से बचें, अनुशासित रहें और अपनी संपत्ति पर टिके रहें।
अपने फंड को विभिन्न क्षेत्रों में विभाजित करें और अपने पोर्टफोलियो में विविधता लाएं। यह आपके जोखिम और रिटर्न को संतुलित करने के सर्वोत्तम तरीकों में से एक है। इस तरह, यदि एक फंड प्रदर्शन करने में विफल रहता है, तो अन्य फंड रिटर्न को संतुलित कर सकते हैं।
आप सबसे अच्छा विकल्प चुन सकते हैंसिप मोड के माध्यम सेम्यूचुअल फंड्स, जहां एक छोटी राशि का निवेश किया जाता हैइक्विटी फंड एक नियमित अंतराल पर। एक एसआईपी के रूप में इसका लाभ मिलता हैकंपाउंडिंग की शक्ति और रुपये की औसत लागत, बाजार के अल्पकालिक नुकसान आपके पोर्टफोलियो को ज्यादा प्रभावित नहीं करते हैं। लंबी अवधि में रिटर्न सकारात्मक है।
वित्त वर्ष 22 - 23 में निवेश करने के लिए सर्वश्रेष्ठ प्रदर्शन करने वाले एसआईपी फंड
"The primary investment objective of the Scheme is to seek capital appreciation by investing predominantly in units of MLIIF - WGF. The Scheme may, at the discretion of the Investment Manager, also invest in the units of other similar overseas mutual fund schemes, which may constitute a significant part of its corpus. The Scheme may also invest a certain portion of its corpus in money market securities and/or units of money market/liquid schemes of DSP Merrill Lynch Mutual Fund, in order to meet liquidity requirements from time to time. However, there is no assurance that the investment objective of the Scheme will be realized." Below is the key information for DSP World Gold Fund Returns up to 1 year are on The objective of the scheme would be to provide investors with opportunities for long-term growth in capital along with the liquidity of an open-ended scheme through an active management of investments in a diversified basket of equity stocks of domestic Public Sector Undertakings and in debt and money market instruments issued by PSUs AND others. Research Highlights for SBI PSU Fund Below is the key information for SBI PSU Fund Returns up to 1 year are on To generate capital appreciation and income distribution to unit holders by investing predominantly in equity/equity related securities of the companies belonging to the infrastructure development and balance in debt securities and money market instruments. Research Highlights for ICICI Prudential Infrastructure Fund Below is the key information for ICICI Prudential Infrastructure Fund Returns up to 1 year are on To generate capital appreciation by investing in Equity and Equity Related Instruments of companies where the Central / State Government(s) has majority shareholding or management control or has powers to appoint majority of directors. However, there is no assurance or guarantee that the investment objective of the Scheme will be achieved. The Scheme does not assure or guarantee any returns. Research Highlights for Invesco India PSU Equity Fund Below is the key information for Invesco India PSU Equity Fund Returns up to 1 year are on To generate capital appreciation, from a portfolio that is substantially constituted of equity securities and equity related securities of corporates, which could benefit from structural changes brought about by continuing liberalization in economic policies by the government and/or continuing investments in infrastructure, both by the public and private sector. Research Highlights for DSP India T.I.G.E.R Fund Below is the key information for DSP India T.I.G.E.R Fund Returns up to 1 year are on Fund NAV Net Assets (Cr) Min SIP Investment 3 MO (%) 6 MO (%) 1 YR (%) 3 YR (%) 5 YR (%) 2024 (%) DSP World Gold Fund Growth ₹60.3973
↓ -2.23 ₹1,756 500 32.8 78.1 143 56.3 28.1 167.1 SBI PSU Fund Growth ₹36.7055
↑ 0.18 ₹5,817 500 7.8 17.7 33.3 34.3 27.5 11.3 ICICI Prudential Infrastructure Fund Growth ₹198.6
↑ 0.98 ₹8,134 100 0.1 2.5 18.5 25.4 26.5 6.7 Invesco India PSU Equity Fund Growth ₹68.86
↑ 0.52 ₹1,449 500 3.1 11.2 33.1 32.2 25.9 10.3 DSP India T.I.G.E.R Fund Growth ₹326.36
↑ 1.58 ₹5,323 500 2.1 4.6 23 25.9 24.4 -2.5 Note: Returns up to 1 year are on absolute basis & more than 1 year are on CAGR basis. as on 17 Feb 26 Research Highlights & Commentary of 5 Funds showcased
Commentary DSP World Gold Fund SBI PSU Fund ICICI Prudential Infrastructure Fund Invesco India PSU Equity Fund DSP India T.I.G.E.R Fund Point 1 Bottom quartile AUM (₹1,756 Cr). Upper mid AUM (₹5,817 Cr). Highest AUM (₹8,134 Cr). Bottom quartile AUM (₹1,449 Cr). Lower mid AUM (₹5,323 Cr). Point 2 Established history (18+ yrs). Established history (15+ yrs). Established history (20+ yrs). Established history (16+ yrs). Oldest track record among peers (21 yrs). Point 3 Rating: 3★ (upper mid). Rating: 2★ (bottom quartile). Rating: 3★ (lower mid). Rating: 3★ (bottom quartile). Top rated. Point 4 Risk profile: High. Risk profile: High. Risk profile: High. Risk profile: High. Risk profile: High. Point 5 5Y return: 28.10% (top quartile). 5Y return: 27.55% (upper mid). 5Y return: 26.52% (lower mid). 5Y return: 25.92% (bottom quartile). 5Y return: 24.39% (bottom quartile). Point 6 3Y return: 56.28% (top quartile). 3Y return: 34.34% (upper mid). 3Y return: 25.38% (bottom quartile). 3Y return: 32.18% (lower mid). 3Y return: 25.91% (bottom quartile). Point 7 1Y return: 143.03% (top quartile). 1Y return: 33.34% (upper mid). 1Y return: 18.45% (bottom quartile). 1Y return: 33.14% (lower mid). 1Y return: 22.96% (bottom quartile). Point 8 Alpha: 1.32 (top quartile). Alpha: -0.22 (bottom quartile). Alpha: 0.00 (upper mid). Alpha: -1.90 (bottom quartile). Alpha: 0.00 (lower mid). Point 9 Sharpe: 3.42 (top quartile). Sharpe: 0.33 (upper mid). Sharpe: 0.12 (bottom quartile). Sharpe: 0.27 (lower mid). Sharpe: -0.31 (bottom quartile). Point 10 Information ratio: -0.67 (bottom quartile). Information ratio: -0.47 (bottom quartile). Information ratio: 0.00 (top quartile). Information ratio: -0.37 (lower mid). Information ratio: 0.00 (upper mid). DSP World Gold Fund
SBI PSU Fund
ICICI Prudential Infrastructure Fund
Invesco India PSU Equity Fund
DSP India T.I.G.E.R Fund
200 करोड़ म्यूचुअल फंड की इक्विटी श्रेणी में 5 साल के आधार पर ऑर्डर किया गयासीएजीआर रिटर्न।1. DSP World Gold Fund
DSP World Gold Fund
Growth Launch Date 14 Sep 07 NAV (17 Feb 26) ₹60.3973 ↓ -2.23 (-3.56 %) Net Assets (Cr) ₹1,756 on 31 Dec 25 Category Equity - Global AMC DSP BlackRock Invmt Managers Pvt. Ltd. Rating ☆☆☆ Risk High Expense Ratio 1.41 Sharpe Ratio 3.42 Information Ratio -0.67 Alpha Ratio 1.32 Min Investment 1,000 Min SIP Investment 500 Exit Load 0-12 Months (1%),12 Months and above(NIL) Growth of 10,000 investment over the years.
Date Value 31 Jan 21 ₹10,000 31 Jan 22 ₹8,807 31 Jan 23 ₹9,422 31 Jan 24 ₹8,517 31 Jan 25 ₹12,548 31 Jan 26 ₹33,170 Returns for DSP World Gold Fund
absolute basis & more than 1 year are on CAGR (Compound Annual Growth Rate) basis. as on 17 Feb 26 Duration Returns 1 Month 2.5% 3 Month 32.8% 6 Month 78.1% 1 Year 143% 3 Year 56.3% 5 Year 28.1% 10 Year 15 Year Since launch 10.3% Historical performance (Yearly) on absolute basis
Year Returns 2024 167.1% 2023 15.9% 2022 7% 2021 -7.7% 2020 -9% 2019 31.4% 2018 35.1% 2017 -10.7% 2016 -4% 2015 52.7% Fund Manager information for DSP World Gold Fund
Name Since Tenure Jay Kothari 1 Mar 13 12.93 Yr. Data below for DSP World Gold Fund as on 31 Dec 25
Equity Sector Allocation
Sector Value Basic Materials 95.89% Asset Allocation
Asset Class Value Cash 1.55% Equity 95.89% Debt 0.01% Other 2.56% Top Securities Holdings / Portfolio
Name Holding Value Quantity BGF World Gold I2
Investment Fund | -74% ₹1,458 Cr 1,177,658
↓ -41,596 VanEck Gold Miners ETF
- | GDX25% ₹497 Cr 573,719 Treps / Reverse Repo Investments
CBLO/Reverse Repo | -2% ₹35 Cr Net Receivables/Payables
Net Current Assets | -1% -₹15 Cr 2. SBI PSU Fund
SBI PSU Fund
Growth Launch Date 7 Jul 10 NAV (18 Feb 26) ₹36.7055 ↑ 0.18 (0.49 %) Net Assets (Cr) ₹5,817 on 31 Dec 25 Category Equity - Sectoral AMC SBI Funds Management Private Limited Rating ☆☆ Risk High Expense Ratio 1.89 Sharpe Ratio 0.33 Information Ratio -0.47 Alpha Ratio -0.22 Min Investment 5,000 Min SIP Investment 500 Exit Load 0-1 Years (1%),1 Years and above(NIL) Growth of 10,000 investment over the years.
Date Value 31 Jan 21 ₹10,000 31 Jan 22 ₹14,656 31 Jan 23 ₹17,067 31 Jan 24 ₹30,032 31 Jan 25 ₹32,242 31 Jan 26 ₹38,028 Returns for SBI PSU Fund
absolute basis & more than 1 year are on CAGR (Compound Annual Growth Rate) basis. as on 17 Feb 26 Duration Returns 1 Month 7.4% 3 Month 7.8% 6 Month 17.7% 1 Year 33.3% 3 Year 34.3% 5 Year 27.5% 10 Year 15 Year Since launch 8.7% Historical performance (Yearly) on absolute basis
Year Returns 2024 11.3% 2023 23.5% 2022 54% 2021 29% 2020 32.4% 2019 -10% 2018 6% 2017 -23.8% 2016 21.9% 2015 16.2% Fund Manager information for SBI PSU Fund
Name Since Tenure Rohit Shimpi 1 Jun 24 1.67 Yr. Data below for SBI PSU Fund as on 31 Dec 25
Equity Sector Allocation
Sector Value Financial Services 34.09% Utility 29.59% Energy 13.91% Industrials 12.42% Basic Materials 7.01% Asset Allocation
Asset Class Value Cash 2.9% Equity 97.02% Debt 0.08% Top Securities Holdings / Portfolio
Name Holding Value Quantity State Bank of India (Financial Services)
Equity, Since 31 Jul 10 | SBIN18% ₹1,069 Cr 9,927,500 Bharat Electronics Ltd (Industrials)
Equity, Since 30 Jun 24 | BEL10% ₹583 Cr 12,975,000 NTPC Ltd (Utilities)
Equity, Since 31 Jul 10 | NTPC9% ₹550 Cr 15,443,244 Power Grid Corp Of India Ltd (Utilities)
Equity, Since 31 Jul 10 | POWERGRID9% ₹511 Cr 19,935,554
↑ 2,300,000 GAIL (India) Ltd (Utilities)
Equity, Since 31 May 24 | GAIL8% ₹488 Cr 29,150,000 Bharat Petroleum Corp Ltd (Energy)
Equity, Since 31 Aug 24 | BPCL6% ₹354 Cr 9,700,000 Bank of Baroda (Financial Services)
Equity, Since 31 Aug 24 | BANKBARODA6% ₹329 Cr 11,000,000 NMDC Ltd (Basic Materials)
Equity, Since 31 Oct 23 | NMDC4% ₹227 Cr 27,900,000 Indian Bank (Financial Services)
Equity, Since 30 Jun 21 | INDIANB4% ₹221 Cr 2,427,235 Oil India Ltd (Energy)
Equity, Since 31 Mar 24 | OIL3% ₹196 Cr 3,850,000 3. ICICI Prudential Infrastructure Fund
ICICI Prudential Infrastructure Fund
Growth Launch Date 31 Aug 05 NAV (18 Feb 26) ₹198.6 ↑ 0.98 (0.50 %) Net Assets (Cr) ₹8,134 on 31 Dec 25 Category Equity - Sectoral AMC ICICI Prudential Asset Management Company Limited Rating ☆☆☆ Risk High Expense Ratio 1.89 Sharpe Ratio 0.12 Information Ratio 0 Alpha Ratio 0 Min Investment 5,000 Min SIP Investment 100 Exit Load 0-1 Years (1%),1 Years and above(NIL) Growth of 10,000 investment over the years.
Date Value 31 Jan 21 ₹10,000 31 Jan 22 ₹16,042 31 Jan 23 ₹19,152 31 Jan 24 ₹29,825 31 Jan 25 ₹34,393 31 Jan 26 ₹36,891 Returns for ICICI Prudential Infrastructure Fund
absolute basis & more than 1 year are on CAGR (Compound Annual Growth Rate) basis. as on 17 Feb 26 Duration Returns 1 Month 2.6% 3 Month 0.1% 6 Month 2.5% 1 Year 18.5% 3 Year 25.4% 5 Year 26.5% 10 Year 15 Year Since launch 15.7% Historical performance (Yearly) on absolute basis
Year Returns 2024 6.7% 2023 27.4% 2022 44.6% 2021 28.8% 2020 50.1% 2019 3.6% 2018 2.6% 2017 -14% 2016 40.8% 2015 2% Fund Manager information for ICICI Prudential Infrastructure Fund
Name Since Tenure Ihab Dalwai 3 Jun 17 8.67 Yr. Sharmila D’mello 30 Jun 22 3.59 Yr. Data below for ICICI Prudential Infrastructure Fund as on 31 Dec 25
Equity Sector Allocation
Sector Value Industrials 48.97% Financial Services 12.33% Utility 9.63% Basic Materials 9.49% Real Estate 6.53% Energy 6% Consumer Cyclical 2.03% Communication Services 0.11% Asset Allocation
Asset Class Value Cash 4.63% Equity 95.37% Top Securities Holdings / Portfolio
Name Holding Value Quantity Larsen & Toubro Ltd (Industrials)
Equity, Since 30 Nov 09 | LT9% ₹690 Cr 1,755,704 InterGlobe Aviation Ltd (Industrials)
Equity, Since 28 Feb 23 | INDIGO8% ₹640 Cr 1,391,449
↑ 275,091 NTPC Ltd (Utilities)
Equity, Since 29 Feb 16 | NTPC4% ₹332 Cr 9,326,448
↓ -1,050,000 Oberoi Realty Ltd (Real Estate)
Equity, Since 31 May 23 | OBEROIRLTY3% ₹253 Cr 1,696,181
↑ 637,668 Adani Ports & Special Economic Zone Ltd (Industrials)
Equity, Since 31 May 24 | ADANIPORTS3% ₹241 Cr 1,700,000 AIA Engineering Ltd (Industrials)
Equity, Since 28 Feb 21 | AIAENG3% ₹229 Cr 574,561
↓ -37,559 Kalpataru Projects International Ltd (Industrials)
Equity, Since 30 Sep 06 | KPIL3% ₹221 Cr 1,931,967
↑ 20,847 IndusInd Bank Ltd (Financial Services)
Equity, Since 31 Oct 24 | INDUSINDBK3% ₹217 Cr 2,424,016 Reliance Industries Ltd (Energy)
Equity, Since 31 Jul 23 | RELIANCE3% ₹213 Cr 1,529,725 Axis Bank Ltd (Financial Services)
Equity, Since 31 Dec 20 | AXISBANK3% ₹209 Cr 1,527,307
↓ -156,250 4. Invesco India PSU Equity Fund
Invesco India PSU Equity Fund
Growth Launch Date 18 Nov 09 NAV (18 Feb 26) ₹68.86 ↑ 0.52 (0.76 %) Net Assets (Cr) ₹1,449 on 31 Dec 25 Category Equity - Sectoral AMC Invesco Asset Management (India) Private Ltd Rating ☆☆☆ Risk High Expense Ratio 2.14 Sharpe Ratio 0.27 Information Ratio -0.37 Alpha Ratio -1.9 Min Investment 5,000 Min SIP Investment 500 Exit Load 0-1 Years (1%),1 Years and above(NIL) Growth of 10,000 investment over the years.
Date Value 31 Jan 21 ₹10,000 31 Jan 22 ₹13,872 31 Jan 23 ₹15,622 31 Jan 24 ₹26,577 31 Jan 25 ₹29,948 31 Jan 26 ₹35,297 Returns for Invesco India PSU Equity Fund
absolute basis & more than 1 year are on CAGR (Compound Annual Growth Rate) basis. as on 17 Feb 26 Duration Returns 1 Month 2.6% 3 Month 3.1% 6 Month 11.2% 1 Year 33.1% 3 Year 32.2% 5 Year 25.9% 10 Year 15 Year Since launch 12.6% Historical performance (Yearly) on absolute basis
Year Returns 2024 10.3% 2023 25.6% 2022 54.5% 2021 20.5% 2020 31.1% 2019 6.1% 2018 10.1% 2017 -16.9% 2016 24.3% 2015 17.9% Fund Manager information for Invesco India PSU Equity Fund
Name Since Tenure Hiten Jain 1 Jul 25 0.59 Yr. Sagar Gandhi 1 Jul 25 0.59 Yr. Data below for Invesco India PSU Equity Fund as on 31 Dec 25
Equity Sector Allocation
Sector Value Industrials 31.92% Financial Services 29.89% Utility 18.15% Energy 12.64% Basic Materials 4.19% Consumer Cyclical 1.08% Asset Allocation
Asset Class Value Cash 2.14% Equity 97.86% Top Securities Holdings / Portfolio
Name Holding Value Quantity State Bank of India (Financial Services)
Equity, Since 28 Feb 21 | SBIN9% ₹139 Cr 1,294,989
↓ -92,628 Bharat Electronics Ltd (Industrials)
Equity, Since 31 Mar 17 | BEL9% ₹135 Cr 2,997,692 Indian Bank (Financial Services)
Equity, Since 30 Jun 21 | INDIANB7% ₹106 Cr 1,157,444 Bharat Petroleum Corp Ltd (Energy)
Equity, Since 30 Sep 18 | BPCL7% ₹99 Cr 2,717,009 Hindustan Aeronautics Ltd Ordinary Shares (Industrials)
Equity, Since 31 May 22 | HAL6% ₹87 Cr 187,643
↓ -8,515 NTPC Green Energy Ltd (Utilities)
Equity, Since 30 Nov 24 | NTPCGREEN5% ₹79 Cr 9,129,820 Dredging Corp of India Ltd (Industrials)
Equity, Since 31 Jul 25 | DREDGECORP5% ₹73 Cr 646,300 Bharat Dynamics Ltd Ordinary Shares (Industrials)
Equity, Since 31 May 22 | BDL5% ₹69 Cr 445,685 Bank of Baroda (Financial Services)
Equity, Since 30 Jun 21 | BANKBARODA5% ₹67 Cr 2,244,222 NTPC Ltd (Utilities)
Equity, Since 31 May 19 | NTPC4% ₹64 Cr 1,801,543 5. DSP India T.I.G.E.R Fund
DSP India T.I.G.E.R Fund
Growth Launch Date 11 Jun 04 NAV (18 Feb 26) ₹326.36 ↑ 1.58 (0.49 %) Net Assets (Cr) ₹5,323 on 31 Dec 25 Category Equity - Sectoral AMC DSP BlackRock Invmt Managers Pvt. Ltd. Rating ☆☆☆☆ Risk High Expense Ratio 1.89 Sharpe Ratio -0.31 Information Ratio 0 Alpha Ratio 0 Min Investment 1,000 Min SIP Investment 500 Exit Load 0-12 Months (1%),12 Months and above(NIL) Growth of 10,000 investment over the years.
Date Value 31 Jan 21 ₹10,000 31 Jan 22 ₹15,028 31 Jan 23 ₹16,816 31 Jan 24 ₹26,495 31 Jan 25 ₹30,221 31 Jan 26 ₹31,981 Returns for DSP India T.I.G.E.R Fund
absolute basis & more than 1 year are on CAGR (Compound Annual Growth Rate) basis. as on 17 Feb 26 Duration Returns 1 Month 5.3% 3 Month 2.1% 6 Month 4.6% 1 Year 23% 3 Year 25.9% 5 Year 24.4% 10 Year 15 Year Since launch 17.4% Historical performance (Yearly) on absolute basis
Year Returns 2024 -2.5% 2023 32.4% 2022 49% 2021 13.9% 2020 51.6% 2019 2.7% 2018 6.7% 2017 -17.2% 2016 47% 2015 4.1% Fund Manager information for DSP India T.I.G.E.R Fund
Name Since Tenure Rohit Singhania 21 Jun 10 15.63 Yr. Data below for DSP India T.I.G.E.R Fund as on 31 Dec 25
Equity Sector Allocation
Sector Value Industrials 30.23% Basic Materials 14.52% Financial Services 12.4% Utility 11.04% Energy 8.15% Consumer Cyclical 8.07% Health Care 5.75% Communication Services 3.2% Technology 1.66% Real Estate 1.57% Consumer Defensive 1.34% Asset Allocation
Asset Class Value Cash 2.08% Equity 97.92% Top Securities Holdings / Portfolio
Name Holding Value Quantity Larsen & Toubro Ltd (Industrials)
Equity, Since 30 Jun 04 | LT5% ₹267 Cr 678,645
↓ -15,823 NTPC Ltd (Utilities)
Equity, Since 30 Nov 17 | NTPC5% ₹254 Cr 7,145,883 Apollo Hospitals Enterprise Ltd (Healthcare)
Equity, Since 31 Dec 24 | APOLLOHOSP4% ₹197 Cr 283,144
↑ 37,216 Multi Commodity Exchange of India Ltd (Financial Services)
Equity, Since 31 May 25 | MCX3% ₹172 Cr 680,825 Bharti Airtel Ltd (Communication Services)
Equity, Since 31 Oct 18 | BHARTIARTL3% ₹160 Cr 812,745 Oil & Natural Gas Corp Ltd (Energy)
Equity, Since 31 Mar 24 | ONGC3% ₹153 Cr 5,686,486
↑ 1,321,459 Power Grid Corp Of India Ltd (Utilities)
Equity, Since 31 Jan 25 | POWERGRID3% ₹143 Cr 5,567,574 Hindustan Aeronautics Ltd Ordinary Shares (Industrials)
Equity, Since 31 Oct 25 | HAL3% ₹141 Cr 305,098 Kirloskar Oil Engines Ltd (Industrials)
Equity, Since 31 Mar 23 | KIRLOSENG3% ₹136 Cr 1,154,264 Coal India Ltd (Energy)
Equity, Since 31 Dec 23 | COALINDIA2% ₹119 Cr 2,705,180
↓ -616,273
शांत रहें, लंबी अवधि के रिटर्न पर ध्यान दें और अपने निवेश को अल्पकालिक उतार-चढ़ाव से वापस उछाल दें!
यहां प्रदान की गई जानकारी सटीक है, यह सुनिश्चित करने के लिए सभी प्रयास किए गए हैं। हालांकि, डेटा की शुद्धता के संबंध में कोई गारंटी नहीं दी जाती है। कृपया कोई भी निवेश करने से पहले योजना सूचना दस्तावेज के साथ सत्यापित करें।


Research Highlights for DSP World Gold Fund