म्युच्युअल फंडात एकरकमी गुंतवणुकीचे फायदे
एकरकमी गुंतवणूक संदर्भितगुंतवणूक म्युच्युअल फंड योजनेत लक्षणीय रक्कम. एकरकमी गुंतवणुकीत, पैसे एकवेळ डाउन पेमेंट म्हणून जमा केले जातात. ज्या व्यक्तीकडे मोठी रक्कम आहे ते म्युच्युअल फंडात लक्षणीय रक्कम जमा करू शकतात. गुंतवणुकीची एकरकमी पद्धत सिस्टिमॅटिकच्या विरुद्ध आहेगुंतवणूक योजना किंवाSIP मोड एखादी व्यक्ती एकरकमी रक्कम एकतर स्थिर गुंतवू शकतेउत्पन्न किंवाइक्विटी फंड त्यांची जोखीम-भूक, गुंतवणूक कालावधी आणि गुंतवणुकीचे उद्दिष्ट यावर अवलंबून. जरी बहुतेक लोक पसंत करतातम्युच्युअल फंडात गुंतवणूक SIP द्वारे अद्याप, एकरकमी गुंतवणुकीचे काही फायदे आहेत. तर, एकरकमी गुंतवणुकीचे फायदे समजून घेऊयाम्युच्युअल फंड.
एकरकमी गुंतवणूकीचे फायदे
म्युच्युअल फंडामध्ये एकरकमी गुंतवणुकीचे काही फायदे खालीलप्रमाणे आहेत:
मोठ्या रकमेची गुंतवणूक
एकरकमी मोडच्या पर्यायाने, व्यक्ती म्युच्युअल फंडामध्ये मोठ्या प्रमाणात गुंतवणूक करू शकतात. परिणामी, जेव्हाबाजार वाढीचा कालावधी दर्शविते, नंतर गुंतवणूक मूल्य देखील च्या मूल्याच्या तुलनेत मोठ्या प्रमाणात वाढतेएसआयपी गुंतवणूक.
दीर्घकालीन कार्यकाळासाठी आदर्श
एकरकमी गुंतवणूक अशा व्यक्तींसाठी योग्य आहे जे दीर्घकालीन गुंतवणूक करण्यास प्राधान्य देतात. एकरकमी गुंतवणुकीच्या बाबतीत दीर्घकालीन गुंतवणूक 10 वर्षे किंवा त्याहून अधिक कालावधीच्या अंदाजे गुंतवणूक कालावधीसाठी विचारात घेतली जाऊ शकते. तथापि, एकरकमी गुंतवणुकीसाठीकर्ज निधी, व्यक्ती मध्यम-मुदतीच्या कालावधीसाठी गुंतवणूक करणे देखील निवडू शकतात.
सोय
एकरकमी मोड सामान्यतः व्यक्तींसाठी सोयीस्कर आहे कारण ज्यांच्याकडे मोठी रक्कम आहे ते लोक त्यांची गुंतवणूक पसरवू शकतात. तथापि, जर गुंतवणूक SIP मोडद्वारे केली गेली असेल तर त्यांना काळजी घ्यावी लागेल की रक्कम नियमित अंतराने गुंतवली जाईल.
वेळेसाठी गुंतवणूक करा
जेव्हाही गुंतवणूकदार दीर्घकालीन गुंतवणुकीची निवड करतात तेव्हा त्यांनी नेहमी बाजाराची वेळ पहावी. बाजार आधीच मंदीत असताना आणि वाढीची क्षमता दाखवत असताना व्यक्तींनी गुंतवणूक करणे निवडले पाहिजे. या परिस्थितीत, व्यक्ती एसआयपी मोडच्या तुलनेत एकरकमी मोडद्वारे जास्त परतावा मिळवू शकतात. तथापि, जर बाजार आधीच शिखरावर पोहोचले असताना एकरकमी गुंतवणूक केली गेली, तर अशा परिस्थितीत, व्यक्तींचे नुकसान होऊ शकते.

Talk to our investment specialist
2022 साठी सर्वोत्तम कामगिरी करणारा एकरकमी निधी
एकरकमी गुंतवणूक दीर्घकालीन कालावधीसाठी केली जात असल्याने, परिणामी, आम्ही विशेषत: इक्विटी श्रेणीमध्ये गुंतवणूक करणे निवडू शकतो.लार्ज कॅप फंड. तर, आपण काही सर्वोत्तम कामगिरी करणार्या लार्ज-कॅप म्युच्युअल फंड योजना पाहू या ज्या एकरकमी पद्धतीने दीर्घकालीन गुंतवणुकीसाठी निवडल्या जाऊ शकतात.
Fund NAV Net Assets (Cr) Min Investment 3 MO (%) 6 MO (%) 1 YR (%) 3 YR (%) 5 YR (%) 2025 (%) IDBI India Top 100 Equity Fund Growth ₹44.16
↑ 0.05 ₹655 5,000 9.2 12.5 15.4 21.9 12.6 JM Core 11 Fund Growth ₹20.2426
↑ 0.30 ₹279 5,000 8.1 1.8 2.6 14.2 14.1 -1.9 Invesco India Largecap Fund Growth ₹71.54
↑ 0.69 ₹1,749 5,000 5.8 2.3 1.9 13.9 12.8 5.5 Nippon India Large Cap Fund Growth ₹90.1145
↑ 0.90 ₹51,660 5,000 2.3 -2.5 -1.3 13.1 15.2 9.2 ICICI Prudential Bluechip Fund Growth ₹109.1
↑ 1.11 ₹76,297 5,000 1.6 -4.1 -1.9 13.1 13.5 11.3 Note: Returns up to 1 year are on absolute basis & more than 1 year are on CAGR basis. as on 28 Jul 23 Research Highlights & Commentary of 5 Funds showcased
Commentary IDBI India Top 100 Equity Fund JM Core 11 Fund Invesco India Largecap Fund Nippon India Large Cap Fund ICICI Prudential Bluechip Fund Point 1 Bottom quartile AUM (₹655 Cr). Bottom quartile AUM (₹279 Cr). Lower mid AUM (₹1,749 Cr). Upper mid AUM (₹51,660 Cr). Highest AUM (₹76,297 Cr). Point 2 Established history (14+ yrs). Oldest track record among peers (18 yrs). Established history (16+ yrs). Established history (18+ yrs). Established history (18+ yrs). Point 3 Rating: 3★ (bottom quartile). Top rated. Rating: 3★ (bottom quartile). Rating: 4★ (upper mid). Rating: 4★ (lower mid). Point 4 Risk profile: Moderately High. Risk profile: High. Risk profile: Moderately High. Risk profile: Moderately High. Risk profile: Moderately High. Point 5 5Y return: 12.61% (bottom quartile). 5Y return: 14.06% (upper mid). 5Y return: 12.75% (bottom quartile). 5Y return: 15.24% (top quartile). 5Y return: 13.52% (lower mid). Point 6 3Y return: 21.88% (top quartile). 3Y return: 14.22% (upper mid). 3Y return: 13.87% (lower mid). 3Y return: 13.13% (bottom quartile). 3Y return: 13.12% (bottom quartile). Point 7 1Y return: 15.39% (top quartile). 1Y return: 2.59% (upper mid). 1Y return: 1.88% (lower mid). 1Y return: -1.27% (bottom quartile). 1Y return: -1.91% (bottom quartile). Point 8 Alpha: 2.11 (top quartile). Alpha: -0.12 (bottom quartile). Alpha: 1.94 (upper mid). Alpha: 0.46 (lower mid). Alpha: -1.97 (bottom quartile). Point 9 Sharpe: 1.09 (top quartile). Sharpe: -0.23 (upper mid). Sharpe: -0.24 (lower mid). Sharpe: -0.35 (bottom quartile). Sharpe: -0.48 (bottom quartile). Point 10 Information ratio: 0.14 (bottom quartile). Information ratio: 0.10 (bottom quartile). Information ratio: 0.75 (lower mid). Information ratio: 1.03 (top quartile). Information ratio: 0.90 (upper mid). IDBI India Top 100 Equity Fund
JM Core 11 Fund
Invesco India Largecap Fund
Nippon India Large Cap Fund
ICICI Prudential Bluechip Fund
एकरकमी वरील एयूएम/निव्वळ मालमत्ता असलेले निधी100 कोटी. वर क्रमवारी लावलीमागील 3 वर्षाचा परतावा.
The Investment objective of the Scheme is to provide investors with the opportunities for long-term capital appreciation by investing predominantly in Equity and Equity related Instruments of Large Cap companies. However
there can be no assurance that the investment objective under the Scheme will be realized. Below is the key information for IDBI India Top 100 Equity Fund Returns up to 1 year are on The investment objective of the Scheme is to provide long-term growth by investing predominantly in a concentrated portfolio of equity / equity related instruments of companies. Research Highlights for JM Core 11 Fund Below is the key information for JM Core 11 Fund Returns up to 1 year are on (Erstwhile Invesco India Business Leaders Fund) To generate long term capital appreciation by investing in equity and equity related instruments including equity derivatives of companies which in our opinion are leaders in their respective industry or industry segment. However, there is no assurance or guarantee that the investment objective of the Scheme will be achieved. The Scheme does not assure or guarantee any returns. Research Highlights for Invesco India Largecap Fund Below is the key information for Invesco India Largecap Fund Returns up to 1 year are on (Erstwhile Reliance Top 200 Fund) The primary investment objective of the scheme is to seek to generate long term capital appreciation by investing in equity and equity related instruments of companies whose market capitalization is within the range of highest & lowest market capitalization of S&P BSE 200 Index. The secondary objective is to generate consistent returns by investing in debt and money market securities. Research Highlights for Nippon India Large Cap Fund Below is the key information for Nippon India Large Cap Fund Returns up to 1 year are on (Erstwhile ICICI Prudential Focused Bluechip Equity Fund) To generate long-term capital appreciation and income distribution to unit holders from a portfolio that is invested in equity and equity related securities of about 20 companies belonging to the large cap domain and the balance in debt securities and money market instruments. The Fund Manager will always select stocks for investment from among Top 200 stocks in terms of market capitalization on the National Stock Exchange of India Ltd. If the total assets under management under this scheme goes above Rs. 1,000 crores the Fund
Manager reserves the right to increase the number of companies to more than 20. Research Highlights for ICICI Prudential Bluechip Fund Below is the key information for ICICI Prudential Bluechip Fund Returns up to 1 year are on 1. IDBI India Top 100 Equity Fund
IDBI India Top 100 Equity Fund
Growth Launch Date 15 May 12 NAV (28 Jul 23) ₹44.16 ↑ 0.05 (0.11 %) Net Assets (Cr) ₹655 on 30 Jun 23 Category Equity - Large Cap AMC IDBI Asset Management Limited Rating ☆☆☆ Risk Moderately High Expense Ratio 2.47 Sharpe Ratio 1.09 Information Ratio 0.14 Alpha Ratio 2.11 Min Investment 5,000 Min SIP Investment 500 Exit Load 0-1 Years (1%),1 Years and above(NIL) Growth of 10,000 investment over the years.
Date Value 30 Jun 21 ₹10,000 30 Jun 22 ₹10,040 30 Jun 23 ₹12,362 Returns for IDBI India Top 100 Equity Fund
absolute basis & more than 1 year are on CAGR (Compound Annual Growth Rate) basis. as on 28 Jul 23 Duration Returns 1 Month 3% 3 Month 9.2% 6 Month 12.5% 1 Year 15.4% 3 Year 21.9% 5 Year 12.6% 10 Year 15 Year Since launch 14.2% Historical performance (Yearly) on absolute basis
Year Returns 2025 2024 2023 2022 2021 2020 2019 2018 2017 2016 Fund Manager information for IDBI India Top 100 Equity Fund
Name Since Tenure Data below for IDBI India Top 100 Equity Fund as on 30 Jun 23
Equity Sector Allocation
Sector Value Asset Allocation
Asset Class Value Top Securities Holdings / Portfolio
Name Holding Value Quantity 2. JM Core 11 Fund
JM Core 11 Fund
Growth Launch Date 5 Mar 08 NAV (10 Jul 26) ₹20.2426 ↑ 0.30 (1.51 %) Net Assets (Cr) ₹279 on 31 May 26 Category Equity - Large Cap AMC JM Financial Asset Management Limited Rating ☆☆☆☆ Risk High Expense Ratio 2.38 Sharpe Ratio -0.23 Information Ratio 0.1 Alpha Ratio -0.12 Min Investment 5,000 Min SIP Investment 500 Exit Load 0-60 Days (1%),60 Days and above(NIL) Growth of 10,000 investment over the years.
Date Value 30 Jun 21 ₹10,000 30 Jun 22 ₹9,962 30 Jun 23 ₹12,943 30 Jun 24 ₹19,005 30 Jun 25 ₹19,091 30 Jun 26 ₹18,895 Returns for JM Core 11 Fund
absolute basis & more than 1 year are on CAGR (Compound Annual Growth Rate) basis. as on 28 Jul 23 Duration Returns 1 Month 8.3% 3 Month 8.1% 6 Month 1.8% 1 Year 2.6% 3 Year 14.2% 5 Year 14.1% 10 Year 15 Year Since launch 3.9% Historical performance (Yearly) on absolute basis
Year Returns 2025 -1.9% 2024 24.3% 2023 32.9% 2022 7.1% 2021 16.3% 2020 6.3% 2019 10.6% 2018 -5% 2017 43.1% 2016 11.1% Fund Manager information for JM Core 11 Fund
Name Since Tenure Satish Ramanathan 1 Oct 24 1.75 Yr. Asit Bhandarkar 25 Feb 09 17.36 Yr. Ruchi Fozdar 4 Oct 24 1.74 Yr. Deepak Gupta 11 Apr 25 1.22 Yr. Data below for JM Core 11 Fund as on 31 May 26
Equity Sector Allocation
Sector Value Financial Services 23.84% Consumer Cyclical 23.45% Industrials 17.21% Technology 14.07% Health Care 7.8% Basic Materials 6.35% Utility 3.2% Communication Services 2.95% Asset Allocation
Asset Class Value Cash 1.13% Equity 98.87% Top Securities Holdings / Portfolio
Name Holding Value Quantity Ujjivan Small Finance Bank Ltd Ordinary Shares (Financial Services)
Equity, Since 31 May 25 | 5429045% ₹15 Cr 2,671,722
↓ -130,000 Larsen & Toubro Ltd (Industrials)
Equity, Since 31 Oct 11 | LT5% ₹14 Cr 34,507
↓ -2,000 Amber Enterprises India Ltd Ordinary Shares (Consumer Cyclical)
Equity, Since 31 Mar 23 | AMBER5% ₹14 Cr 18,050 OneSource Specialty Pharma Ltd (Healthcare)
Equity, Since 31 Jan 25 | ONESOURCE4% ₹12 Cr 65,637 Bajaj Finance Ltd (Financial Services)
Equity, Since 31 Jan 25 | BAJFINANCE4% ₹12 Cr 131,500
↓ -8,000 One97 Communications Ltd (Technology)
Equity, Since 31 May 25 | PAYTM4% ₹12 Cr 105,000 Premier Energies Ltd (Technology)
Equity, Since 31 Mar 26 | PREMIERENE4% ₹12 Cr 110,000
↑ 10,000 Adani Ports & Special Economic Zone Ltd (Industrials)
Equity, Since 31 May 25 | ADANIPORTS4% ₹12 Cr 64,000 Eternal Ltd (Consumer Cyclical)
Equity, Since 30 Nov 23 | ETERNAL4% ₹12 Cr 460,000 IDFC First Bank Ltd (Financial Services)
Equity, Since 30 Apr 25 | IDFCFIRSTB4% ₹11 Cr 1,600,000 3. Invesco India Largecap Fund
Invesco India Largecap Fund
Growth Launch Date 21 Aug 09 NAV (10 Jul 26) ₹71.54 ↑ 0.69 (0.97 %) Net Assets (Cr) ₹1,749 on 31 May 26 Category Equity - Large Cap AMC Invesco Asset Management (India) Private Ltd Rating ☆☆☆ Risk Moderately High Expense Ratio 2.1 Sharpe Ratio -0.24 Information Ratio 0.75 Alpha Ratio 1.94 Min Investment 5,000 Min SIP Investment 100 Exit Load 0-1 Years (1%),1 Years and above(NIL) Growth of 10,000 investment over the years.
Date Value 30 Jun 21 ₹10,000 30 Jun 22 ₹10,005 30 Jun 23 ₹12,373 30 Jun 24 ₹16,924 30 Jun 25 ₹18,181 30 Jun 26 ₹18,122 Returns for Invesco India Largecap Fund
absolute basis & more than 1 year are on CAGR (Compound Annual Growth Rate) basis. as on 28 Jul 23 Duration Returns 1 Month 6.4% 3 Month 5.8% 6 Month 2.3% 1 Year 1.9% 3 Year 13.9% 5 Year 12.8% 10 Year 15 Year Since launch 12.4% Historical performance (Yearly) on absolute basis
Year Returns 2025 5.5% 2024 20% 2023 27.8% 2022 -3% 2021 32.5% 2020 14.1% 2019 10.5% 2018 -0.4% 2017 28.3% 2016 2.8% Fund Manager information for Invesco India Largecap Fund
Name Since Tenure Hiten Jain 1 Dec 23 2.58 Yr. Data below for Invesco India Largecap Fund as on 31 May 26
Equity Sector Allocation
Sector Value Financial Services 32.99% Industrials 20.35% Consumer Cyclical 14.78% Technology 10.22% Health Care 8.14% Basic Materials 6.02% Communication Services 3.35% Real Estate 2.12% Consumer Defensive 1.19% Utility 0.59% Asset Allocation
Asset Class Value Cash 0.25% Equity 99.75% Top Securities Holdings / Portfolio
Name Holding Value Quantity ICICI Bank Ltd (Financial Services)
Equity, Since 30 Sep 19 | ICICIBANK7% ₹122 Cr 969,443 ICICI Prudential Asset Management Co Ltd (Financial Services)
Equity, Since 31 Dec 25 | ICICIAMC6% ₹105 Cr 296,370 HDFC Bank Ltd (Financial Services)
Equity, Since 30 Sep 09 | HDFCBANK6% ₹103 Cr 1,384,844 Infosys Ltd (Technology)
Equity, Since 30 Apr 18 | INFY4% ₹75 Cr 646,679 Larsen & Toubro Ltd (Industrials)
Equity, Since 31 Oct 25 | LT4% ₹71 Cr 173,437 Bajaj Finance Ltd (Financial Services)
Equity, Since 28 Feb 25 | BAJFINANCE3% ₹61 Cr 671,135 Bharti Airtel Ltd (Communication Services)
Equity, Since 31 Dec 19 | BHARTIARTL3% ₹59 Cr 320,404 Eternal Ltd (Consumer Cyclical)
Equity, Since 31 Aug 23 | ETERNAL3% ₹58 Cr 2,302,684 Tech Mahindra Ltd (Technology)
Equity, Since 31 May 23 | TECHM3% ₹55 Cr 370,579 Axis Bank Ltd (Financial Services)
Equity, Since 31 Jan 26 | AXISBANK3% ₹52 Cr 406,975 4. Nippon India Large Cap Fund
Nippon India Large Cap Fund
Growth Launch Date 8 Aug 07 NAV (10 Jul 26) ₹90.1145 ↑ 0.90 (1.01 %) Net Assets (Cr) ₹51,660 on 31 May 26 Category Equity - Large Cap AMC Nippon Life Asset Management Ltd. Rating ☆☆☆☆ Risk Moderately High Expense Ratio 1.58 Sharpe Ratio -0.35 Information Ratio 1.03 Alpha Ratio 0.46 Min Investment 5,000 Min SIP Investment 100 Exit Load 0-1 Years (1%),1 Years and above(NIL) Growth of 10,000 investment over the years.
Date Value 30 Jun 21 ₹10,000 30 Jun 22 ₹10,578 30 Jun 23 ₹13,946 30 Jun 24 ₹19,434 30 Jun 25 ₹20,766 30 Jun 26 ₹20,223 Returns for Nippon India Large Cap Fund
absolute basis & more than 1 year are on CAGR (Compound Annual Growth Rate) basis. as on 28 Jul 23 Duration Returns 1 Month 4.8% 3 Month 2.3% 6 Month -2.5% 1 Year -1.3% 3 Year 13.1% 5 Year 15.2% 10 Year 15 Year Since launch 12.3% Historical performance (Yearly) on absolute basis
Year Returns 2025 9.2% 2024 18.2% 2023 32.1% 2022 11.3% 2021 32.4% 2020 4.9% 2019 7.3% 2018 -0.2% 2017 38.4% 2016 2.2% Fund Manager information for Nippon India Large Cap Fund
Name Since Tenure Sailesh Raj Bhan 8 Aug 07 18.91 Yr. Kinjal Desai 25 May 18 8.11 Yr. Bhavik Dave 19 Aug 24 1.87 Yr. Amber Singhania 11 Mar 26 0.31 Yr. Data below for Nippon India Large Cap Fund as on 31 May 26
Equity Sector Allocation
Sector Value Financial Services 34.93% Consumer Cyclical 15.3% Consumer Defensive 11.37% Industrials 8.63% Health Care 8.21% Technology 7.23% Utility 5.65% Energy 4.2% Basic Materials 2.34% Communication Services 0.69% Real Estate 0.68% Asset Allocation
Asset Class Value Cash 0.25% Equity 99.75% Top Securities Holdings / Portfolio
Name Holding Value Quantity HDFC Bank Ltd (Financial Services)
Equity, Since 31 Dec 08 | HDFCBANK9% ₹4,808 Cr 64,580,734
↑ 2,700,000 ICICI Bank Ltd (Financial Services)
Equity, Since 31 Oct 09 | ICICIBANK8% ₹4,231 Cr 33,677,945
↑ 1,000,000 Reliance Industries Ltd (Energy)
Equity, Since 31 Aug 19 | RELIANCE4% ₹2,172 Cr 16,441,139
↑ 903,600 Axis Bank Ltd (Financial Services)
Equity, Since 31 Mar 15 | AXISBANK4% ₹2,099 Cr 16,315,542
↑ 700,000 Bajaj Finance Ltd (Financial Services)
Equity, Since 31 Dec 21 | BAJFINANCE4% ₹1,820 Cr 20,034,184 Larsen & Toubro Ltd (Industrials)
Equity, Since 30 Sep 07 | LT3% ₹1,793 Cr 4,397,774 GE Vernova T&D India Ltd (Industrials)
Equity, Since 30 Jun 12 | GVT&D3% ₹1,452 Cr 2,819,557
↓ -533,863 Sun Pharmaceuticals Industries Ltd (Healthcare)
Equity, Since 30 Sep 25 | SUNPHARMA3% ₹1,447 Cr 8,040,635
↑ 1,955,755 Infosys Ltd (Technology)
Equity, Since 30 Sep 07 | INFY3% ₹1,408 Cr 12,126,097 Hindustan Unilever Ltd (Consumer Defensive)
Equity, Since 30 Sep 20 | HINDUNILVR3% ₹1,400 Cr 6,498,878
↑ 500,000 5. ICICI Prudential Bluechip Fund
ICICI Prudential Bluechip Fund
Growth Launch Date 23 May 08 NAV (10 Jul 26) ₹109.1 ↑ 1.11 (1.03 %) Net Assets (Cr) ₹76,297 on 31 May 26 Category Equity - Large Cap AMC ICICI Prudential Asset Management Company Limited Rating ☆☆☆☆ Risk Moderately High Expense Ratio 1.46 Sharpe Ratio -0.48 Information Ratio 0.9 Alpha Ratio -1.97 Min Investment 5,000 Min SIP Investment 100 Exit Load 0-1 Years (1%),1 Years and above(NIL) Growth of 10,000 investment over the years.
Date Value 30 Jun 21 ₹10,000 30 Jun 22 ₹10,446 30 Jun 23 ₹12,920 30 Jun 24 ₹17,880 30 Jun 25 ₹19,286 30 Jun 26 ₹18,583 Returns for ICICI Prudential Bluechip Fund
absolute basis & more than 1 year are on CAGR (Compound Annual Growth Rate) basis. as on 28 Jul 23 Duration Returns 1 Month 5% 3 Month 1.6% 6 Month -4.1% 1 Year -1.9% 3 Year 13.1% 5 Year 13.5% 10 Year 15 Year Since launch 14.1% Historical performance (Yearly) on absolute basis
Year Returns 2025 11.3% 2024 16.9% 2023 27.4% 2022 6.9% 2021 29.2% 2020 13.5% 2019 9.8% 2018 -0.8% 2017 32.7% 2016 7.7% Fund Manager information for ICICI Prudential Bluechip Fund
Name Since Tenure Sankaran Naren 5 Feb 26 0.4 Yr. Vaibhav Dusad 18 Jan 21 5.45 Yr. Sharmila D'Silva 31 Jul 22 3.92 Yr. Data below for ICICI Prudential Bluechip Fund as on 31 May 26
Equity Sector Allocation
Sector Value Financial Services 28.98% Consumer Cyclical 13.83% Industrials 11.11% Energy 7.43% Basic Materials 6.68% Consumer Defensive 5.84% Health Care 5.11% Communication Services 4.85% Technology 4.81% Utility 4.4% Real Estate 1.32% Asset Allocation
Asset Class Value Cash 5.23% Equity 94.77% Top Securities Holdings / Portfolio
Name Holding Value Quantity ICICI Bank Ltd (Financial Services)
Equity, Since 30 Jun 08 | ICICIBANK9% ₹6,650 Cr 52,926,976 HDFC Bank Ltd (Financial Services)
Equity, Since 31 Dec 10 | HDFCBANK8% ₹6,458 Cr 86,741,473 Reliance Industries Ltd (Energy)
Equity, Since 30 Jun 08 | RELIANCE5% ₹4,125 Cr 31,220,500
↑ 1,500,000 Larsen & Toubro Ltd (Industrials)
Equity, Since 31 Jan 12 | LT5% ₹4,107 Cr 10,075,656
↓ -594,718 Axis Bank Ltd (Financial Services)
Equity, Since 31 Mar 14 | AXISBANK5% ₹3,562 Cr 27,689,059
↑ 100,000 Bharti Airtel Ltd (Communication Services)
Equity, Since 31 Aug 09 | BHARTIARTL4% ₹3,311 Cr 18,104,129
↑ 337,869 Infosys Ltd (Technology)
Equity, Since 30 Nov 10 | INFY4% ₹2,747 Cr 23,662,450
↓ -1,575,000 Maruti Suzuki India Ltd (Consumer Cyclical)
Equity, Since 30 Apr 16 | MARUTI4% ₹2,712 Cr 2,065,675
↓ -79,950 UltraTech Cement Ltd (Basic Materials)
Equity, Since 30 Sep 17 | ULTRACEMCO3% ₹2,050 Cr 1,785,267
↓ -50,000 Sun Pharmaceuticals Industries Ltd (Healthcare)
Equity, Since 31 Jul 15 | SUNPHARMA3% ₹2,024 Cr 11,249,940
एकरकमी कॅल्क्युलेटर
एकरकमी कॅल्क्युलेटर हे एक साधन आहे जे व्यक्तींना त्यांचे मूल्य किती असेल हे समजण्यास मदत करतेम्युच्युअल फंडात एकरकमी गुंतवणूक गुंतवणूक कालावधीच्या शेवटी. कॅल्क्युलेटरमध्ये जो इनपुट डेटा देणे आवश्यक आहे त्यात एकरकमी गुंतवणुकीचा कालावधी, एकरकमी गुंतवणुकीची रक्कम, इक्विटी मार्केटमध्ये अपेक्षित दीर्घकालीन वाढीचा दर, अपेक्षित दीर्घकालीनमहागाई दर. तर, एकरकमी कॅल्क्युलेटर कसे वापरायचे याची संकल्पना समजून घेऊ.
एकरकमी गुंतवणूक: 35 रुपये,000
गुंतवणुकीचा कालावधी: 20 वर्षे
दीर्घकालीन वाढीचा दर (अंदाजे): १५%
दीर्घकालीन महागाई दर (अंदाजे): ४%
एकरकमी कॅल्क्युलेटरनुसार अपेक्षित परतावा: INR 2,82,181
गुंतवणुकीवर निव्वळ नफा: INR 2,47,181
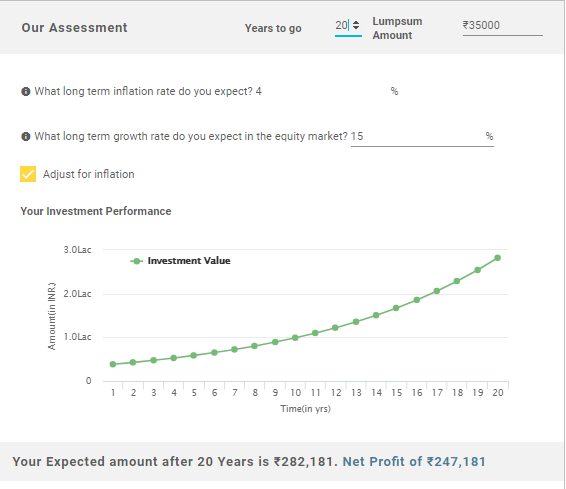
अशा प्रकारे, वरील गणना दर्शवते की तुमच्या गुंतवणुकीवरील गुंतवणुकीवर निव्वळ नफा INR 2,47,181 आहे तर तुमच्या गुंतवणुकीचे एकूण मूल्य INR 2,82,181 आहे..
अशाप्रकारे, वरील पॉइंटर्सवरून असे म्हणता येईल की गुंतवणुकीच्या एकरकमी पद्धतीचेही फायदे आहेत. तथापि, गुंतवणुकीची एकरकमी पद्धत निवडताना व्यक्तींनी सावधगिरी बाळगली पाहिजे. त्यांनी अशी पद्धत त्यांच्यासाठी योग्य आहे की नाही हे तपासावे. जर व्यक्तींना एकरकमी मोड फारसा सोयीस्कर नसेल, तर ते STP किंवा निवडू शकतातपद्धतशीर हस्तांतरण योजना ज्यामध्ये ते प्रथम एकरकमी रक्कम गुंतवतातलिक्विड फंड आणि नंतर नियमित अंतराने इक्विटी फंडात पद्धतशीरपणे हस्तांतरित करा.
येथे प्रदान केलेली माहिती अचूक असल्याची खात्री करण्यासाठी सर्व प्रयत्न केले गेले आहेत. तथापि, डेटाच्या अचूकतेबद्दल कोणतीही हमी दिली जात नाही. कृपया कोणतीही गुंतवणूक करण्यापूर्वी योजना माहिती दस्तऐवजासह सत्यापित करा.


AMFI Registration No. 112358 | CIN: U74999MH2016PTC282153
Shepard Technologies Pvt. Ltd. (with ARN code 112358) makes no warranties or representations, express or implied, on products offered through the platform. It accepts no liability for any damages or losses, however caused, in connection with the use of, or on the reliance of its product or related services. Terms and conditions of the website are applicable.
©2026 Shepard Technologies Private Limited. All Rights Reserved
Research Highlights for IDBI India Top 100 Equity Fund