सर्वोत्कृष्ट डेट म्युच्युअल फंड 2022
सर्वोत्कृष्ट कर्ज निधी गुंतवणूकीच्या कालावधीनुसार बदलतातगुंतवणूकदार. सर्वोत्कृष्ट निवडताना गुंतवणूकदारांनी त्यांच्या गुंतवणुकीच्या क्षितिजावर स्पष्ट असणे आवश्यक आहेकर्ज निधी त्यांच्या गुंतवणुकीसाठी आणि व्याजदर परिस्थितीमध्ये देखील घटक.
खूप कमी होल्डिंग कालावधी असलेल्या गुंतवणूकदारांसाठी, काही दिवस ते एक महिना म्हणा,लिक्विड फंड आणि अति-अल्पकालीन निधी संबंधित असू शकते. जेव्हा वेळ क्षितिज एक ते दोन वर्षांचा असतो तेव्हा अल्पकालीन निधी हे इच्छित साधन असू शकते. दीर्घ मुदतीसाठी, 3 वर्षांहून अधिक काळासाठी, दीर्घकालीन डेट फंड हे गुंतवणूकदारांचे सर्वाधिक पसंतीचे साधन आहेत, विशेषत: घसरलेल्या व्याजदराच्या वेळी. सर्वात महत्त्वाचे म्हणजे, डेट फंड पेक्षा कमी धोकादायक असल्याचे सिद्ध झाले आहेइक्विटी अल्पकालीन गुंतवणूक शोधत असताना, तथापि, दीर्घकालीन उत्पन्न निधीची अस्थिरता इक्विटीशी जुळू शकते.

डेट फंड सरकारी सिक्युरिटीज, ट्रेझरी बिले, कॉर्पोरेट यांसारख्या निश्चित उत्पन्न साधनांमध्ये गुंतवणूक करतात म्हणूनबंध, इत्यादी, त्यांच्याकडे कालांतराने सातत्यपूर्ण आणि नियमित परतावा निर्माण करण्याची क्षमता आहे. तथापि, गुंतवणुकीसाठी सर्वोत्तम डेट फंड निवडण्यापूर्वी अनेक गुणात्मक आणि परिमाणात्मक घटक समजून घेणे आवश्यक आहे, उदा - AUM, सरासरी परिपक्वता, कर आकारणी, पोर्टफोलिओची क्रेडिट गुणवत्ता इ. खाली आम्ही शीर्ष 5 सर्वोत्तम डेट फंडांची यादी केली आहे. डेट फंडाच्या विविध श्रेणींमध्ये गुंतवणूक करण्यासाठी -सर्वोत्तम लिक्विड फंड, सर्वोत्तम अल्ट्रा शॉर्ट टर्म फंड,सर्वोत्तम अल्पकालीन निधी, सर्वोत्तम दीर्घकालीन निधी आणि सर्वोत्तमगिल्ट फंड 2022 - 2023 मध्ये गुंतवणूक करा.
डेट म्युच्युअल फंडात गुंतवणूक का करावी?
a नियमित उत्पन्न मिळविण्यासाठी डेट फंड ही एक आदर्श गुंतवणूक मानली जाते. उदाहरणार्थ, लाभांश पेआउट निवडणे हा नियमित उत्पन्नाचा पर्याय असू शकतो.
b डेट फंडांमध्ये, गुंतवणूकदार कोणत्याही वेळी गुंतवणुकीतून आवश्यक पैसे काढू शकतात आणि उर्वरित पैसे गुंतवू शकतात.
c डेट फंड मोठ्या प्रमाणावर सरकारी सिक्युरिटीज, कॉर्पोरेट डेट आणि इतर सिक्युरिटीज जसे की ट्रेझरी बिले इत्यादींमध्ये गुंतवणूक करत असल्याने, त्यांना इक्विटी बाजारातील अस्थिरतेचा परिणाम होत नाही.
d जर एखादा गुंतवणूकदार अल्प-मुदतीसाठी साध्य करण्याचा विचार करत असेलआर्थिक उद्दिष्टे किंवा कमी कालावधीसाठी गुंतवणूक करा मग डेट फंड हा चांगला पर्याय असू शकतो. लिक्विड फंड, अल्ट्रा शॉर्ट टर्म फंड आणि शॉर्ट टर्म इन्कम फंड हे इच्छित पर्याय असू शकतात.
ई डेट फंडांमध्ये, गुंतवणूकदार एक पद्धतशीर पैसे काढण्याची योजना सुरू करून दर महिन्याला निश्चित उत्पन्न मिळवू शकतात (SWP याच्या उलट आहेSIP /कृपया) मासिक आधारावर निश्चित रक्कम काढणे. तसेच, जेव्हा आवश्यक असेल तेव्हा तुम्ही SWP ची रक्कम बदलू शकता.
डेट म्युच्युअल फंडातील जोखीम
असतानागुंतवणूक डेट फंडांमध्ये, गुंतवणूकदारांनी त्यांच्याशी संबंधित दोन प्रमुख जोखमींबद्दल सावध असले पाहिजे- क्रेडिट जोखीम आणि व्याज जोखीम.
a उधारीची जोखीम
जेव्हा कर्जाची साधने जारी केलेली कंपनी नियमित पेमेंट करत नाही तेव्हा क्रेडिट जोखीम उद्भवते. अशा परिस्थितीत, फंडाचा पोर्टफोलिओमध्ये किती भाग आहे यावर त्याचा फंडावर मोठा परिणाम होतो. म्हणून, अधिक रेटिंग असलेल्या कर्ज साधनांमध्ये असण्याची सूचना केली जाते. अएएए कमी किंवा नगण्य पेमेंटसह रेटिंग ही सर्वोच्च गुणवत्ता मानली जातेअविचल जोखीम.
b व्याज जोखीम
व्याजदर जोखीम प्रचलित व्याजदरातील बदलामुळे बाँडच्या किमतीतील बदलास सूचित करते. जेव्हा अर्थव्यवस्थेत व्याजदर वाढतात तेव्हा रोख्यांच्या किमती खाली येतात आणि त्याउलट. फंडाच्या पोर्टफोलिओची मॅच्युरिटी जितकी जास्त असेल तितका तो व्याजदराच्या जोखमीसाठी अधिक प्रवण असतो. त्यामुळे वाढत्या व्याजदराच्या परिस्थितीत, कमी मुदतीच्या कर्ज निधीसाठी जाण्याचा सल्ला दिला जातो. आणि घसरलेल्या व्याजदर परिस्थितीत उलट.
डेट म्युच्युअल फंड कर आकारणी
डेट फंडावरील कराची गणना खालील पद्धतीने केली जाते-
a शॉर्ट टर्म कॅपिटल गेन
जर कर्ज गुंतवणुकीचा होल्डिंग कालावधी 36 महिन्यांपेक्षा कमी असेल, तर ती अल्प-मुदतीची गुंतवणूक म्हणून वर्गीकृत केली जाते आणि त्यावर व्यक्तीच्या कर स्लॅबनुसार कर आकारला जातो.
b दीर्घकालीन भांडवली नफा
जर कर्ज गुंतवणुकीचा होल्डिंग कालावधी 36 महिन्यांपेक्षा जास्त असेल, तर ती दीर्घकालीन गुंतवणूक म्हणून वर्गीकृत केली जाते आणि इंडेक्सेशन लाभासह 20% कर आकारला जातो.
| भांडवल फायदा होतो | गुंतवणूक होल्डिंग नफा | कर आकारणी |
|---|---|---|
| अल्पकालीनभांडवली नफा | 36 महिन्यांपेक्षा कमी | व्यक्तीच्या कर स्लॅबनुसार |
| दीर्घकालीन भांडवली नफा | 36 महिन्यांहून अधिक | इंडेक्सेशन लाभांसह 20% |
Talk to our investment specialist
आर्थिक वर्ष 22 - 23 गुंतवणुकीसाठी भारतातील सर्वोत्तम डेट म्युच्युअल फंड
शीर्ष 5 लिक्विड म्युच्युअल फंड
शीर्षस्थानीद्रव एयूएम/निव्वळ मालमत्ता > 10 असलेले निधी,000 कोटी.Fund NAV Net Assets (Cr) Min Investment 1 MO (%) 3 MO (%) 6 MO (%) 1 YR (%) 2024 (%) Debt Yield (YTM) Mod. Duration Eff. Maturity Axis Liquid Fund Growth ₹3,098.62
↑ 0.44 ₹56,168 500 0.6 1.6 3.4 6.3 6.6 6.23% 1M 5D 1M 5D Aditya Birla Sun Life Liquid Fund Growth ₹448.239
↑ 0.07 ₹47,520 5,000 0.6 1.6 3.3 6.3 6.5 7.01% 1M 17D 1M 20D Invesco India Liquid Fund Growth ₹3,823.24
↑ 0.58 ₹14,989 5,000 0.6 1.6 3.3 6.3 6.5 6.56% 30D 1M 1D Nippon India Liquid Fund Growth ₹6,786.9
↑ 1.00 ₹31,752 100 0.6 1.6 3.3 6.3 6.5 6.98% 1M 14D 1M 17D Tata Liquid Fund Growth ₹4,379.72
↑ 0.62 ₹30,449 5,000 0.6 1.6 3.3 6.3 6.5 6.59% 1M 6D 1M 6D Note: Returns up to 1 year are on absolute basis & more than 1 year are on CAGR basis. as on 13 Jul 26 Research Highlights & Commentary of 5 Funds showcased
Commentary Axis Liquid Fund Aditya Birla Sun Life Liquid Fund Invesco India Liquid Fund Nippon India Liquid Fund Tata Liquid Fund Point 1 Highest AUM (₹56,168 Cr). Upper mid AUM (₹47,520 Cr). Bottom quartile AUM (₹14,989 Cr). Lower mid AUM (₹31,752 Cr). Bottom quartile AUM (₹30,449 Cr). Point 2 Established history (16+ yrs). Oldest track record among peers (22 yrs). Established history (19+ yrs). Established history (22+ yrs). Established history (21+ yrs). Point 3 Top rated. Rating: 4★ (upper mid). Rating: 4★ (lower mid). Rating: 4★ (bottom quartile). Rating: 4★ (bottom quartile). Point 4 Risk profile: Low. Risk profile: Low. Risk profile: Low. Risk profile: Low. Risk profile: Low. Point 5 1Y return: 6.34% (top quartile). 1Y return: 6.30% (upper mid). 1Y return: 6.29% (lower mid). 1Y return: 6.26% (bottom quartile). 1Y return: 6.26% (bottom quartile). Point 6 1M return: 0.59% (upper mid). 1M return: 0.58% (lower mid). 1M return: 0.59% (top quartile). 1M return: 0.58% (bottom quartile). 1M return: 0.57% (bottom quartile). Point 7 Sharpe: 2.39 (upper mid). Sharpe: 2.20 (bottom quartile). Sharpe: 2.29 (lower mid). Sharpe: 1.97 (bottom quartile). Sharpe: 2.42 (top quartile). Point 8 Information ratio: 0.00 (top quartile). Information ratio: 0.00 (upper mid). Information ratio: 0.00 (lower mid). Information ratio: 0.00 (bottom quartile). Information ratio: 0.00 (bottom quartile). Point 9 Yield to maturity (debt): 6.23% (bottom quartile). Yield to maturity (debt): 7.01% (top quartile). Yield to maturity (debt): 6.56% (bottom quartile). Yield to maturity (debt): 6.98% (upper mid). Yield to maturity (debt): 6.59% (lower mid). Point 10 Modified duration: 0.10 yrs (upper mid). Modified duration: 0.13 yrs (bottom quartile). Modified duration: 0.08 yrs (top quartile). Modified duration: 0.12 yrs (bottom quartile). Modified duration: 0.10 yrs (lower mid). Axis Liquid Fund
Aditya Birla Sun Life Liquid Fund
Invesco India Liquid Fund
Nippon India Liquid Fund
Tata Liquid Fund
टॉप 5 अल्ट्रा शॉर्ट टर्म बाँड म्युच्युअल फंड
शीर्षस्थानीअल्ट्रा शॉर्ट बाँड एयूएम/निव्वळ मालमत्ता > 1,000 कोटी असलेले निधी.Fund NAV Net Assets (Cr) Min Investment 3 MO (%) 6 MO (%) 1 YR (%) 3 YR (%) 2024 (%) Debt Yield (YTM) Mod. Duration Eff. Maturity Aditya Birla Sun Life Savings Fund Growth ₹584.944
↑ 0.27 ₹19,611 1,000 1.7 3.2 6.3 7.3 7.4 7.98% 5M 16D 6M 25D UTI Ultra Short Term Fund Growth ₹4,500.57
↑ 1.33 ₹3,997 5,000 1.5 3.1 5.8 6.7 6.6 0% ICICI Prudential Ultra Short Term Fund Growth ₹29.5181
↑ 0.01 ₹16,002 5,000 1.6 3.2 6.2 7 7.1 7.79% 5M 8D 6M 11D SBI Magnum Ultra Short Duration Fund Growth ₹6,361.05
↑ 1.85 ₹11,861 5,000 1.5 3.2 6.1 7 7 7.77% 5M 5D 8M 16D Invesco India Ultra Short Term Fund Growth ₹2,868.75
↑ 0.71 ₹1,197 5,000 1.6 3.2 6 6.9 6.8 7.53% 5M 3D 5M 6D Note: Returns up to 1 year are on absolute basis & more than 1 year are on CAGR basis. as on 13 Jul 26 Research Highlights & Commentary of 5 Funds showcased
Commentary Aditya Birla Sun Life Savings Fund UTI Ultra Short Term Fund ICICI Prudential Ultra Short Term Fund SBI Magnum Ultra Short Duration Fund Invesco India Ultra Short Term Fund Point 1 Highest AUM (₹19,611 Cr). Bottom quartile AUM (₹3,997 Cr). Upper mid AUM (₹16,002 Cr). Lower mid AUM (₹11,861 Cr). Bottom quartile AUM (₹1,197 Cr). Point 2 Established history (23+ yrs). Established history (22+ yrs). Established history (15+ yrs). Oldest track record among peers (27 yrs). Established history (15+ yrs). Point 3 Top rated. Rating: 4★ (upper mid). Rating: 3★ (lower mid). Rating: 3★ (bottom quartile). Rating: 3★ (bottom quartile). Point 4 Risk profile: Moderately Low. Risk profile: Moderately Low. Risk profile: Moderate. Risk profile: Low. Risk profile: Moderate. Point 5 1Y return: 6.26% (top quartile). 1Y return: 5.84% (bottom quartile). 1Y return: 6.20% (upper mid). 1Y return: 6.12% (lower mid). 1Y return: 6.02% (bottom quartile). Point 6 1M return: 0.69% (lower mid). 1M return: 0.68% (bottom quartile). 1M return: 0.68% (bottom quartile). 1M return: 0.72% (upper mid). 1M return: 0.73% (top quartile). Point 7 Sharpe: 0.52 (upper mid). Sharpe: -0.21 (bottom quartile). Sharpe: 0.53 (top quartile). Sharpe: 0.40 (lower mid). Sharpe: 0.21 (bottom quartile). Point 8 Information ratio: 0.00 (top quartile). Information ratio: 0.00 (upper mid). Information ratio: 0.00 (lower mid). Information ratio: 0.00 (bottom quartile). Information ratio: 0.00 (bottom quartile). Point 9 Yield to maturity (debt): 7.98% (top quartile). Yield to maturity (debt): 0.00% (bottom quartile). Yield to maturity (debt): 7.79% (upper mid). Yield to maturity (debt): 7.77% (lower mid). Yield to maturity (debt): 7.53% (bottom quartile). Point 10 Modified duration: 0.46 yrs (bottom quartile). Modified duration: 0.00 yrs (top quartile). Modified duration: 0.44 yrs (bottom quartile). Modified duration: 0.43 yrs (lower mid). Modified duration: 0.42 yrs (upper mid). Aditya Birla Sun Life Savings Fund
UTI Ultra Short Term Fund
ICICI Prudential Ultra Short Term Fund
SBI Magnum Ultra Short Duration Fund
Invesco India Ultra Short Term Fund
शीर्ष आणि सर्वोत्तम फ्लोटिंग रेट म्युच्युअल फंड
Fund NAV Net Assets (Cr) Min Investment 3 MO (%) 6 MO (%) 1 YR (%) 3 YR (%) 2024 (%) Debt Yield (YTM) Mod. Duration Eff. Maturity Aditya Birla Sun Life Floating Rate Fund - Long Term Growth ₹370.685
↑ 0.14 ₹13,445 1,000 1.7 3.1 6 7.4 7.7 7.66% 10M 20D 1Y 7M 6D ICICI Prudential Floating Interest Fund Growth ₹453.537
↑ 0.04 ₹7,567 5,000 1.9 3.3 6.4 7.6 7.7 7.87% 1Y 10M 13D 2Y 10M 24D Nippon India Floating Rate Fund Growth ₹48.027
↑ 0.00 ₹7,522 5,000 2 3 5.5 7.4 7.9 7.9% 2Y 2M 1D 2Y 8M 1D Note: Returns up to 1 year are on absolute basis & more than 1 year are on CAGR basis. as on 13 Jul 26 Research Highlights & Commentary of 3 Funds showcased
Commentary Aditya Birla Sun Life Floating Rate Fund - Long Term ICICI Prudential Floating Interest Fund Nippon India Floating Rate Fund Point 1 Highest AUM (₹13,445 Cr). Lower mid AUM (₹7,567 Cr). Bottom quartile AUM (₹7,522 Cr). Point 2 Established history (17+ yrs). Established history (20+ yrs). Oldest track record among peers (21 yrs). Point 3 Top rated. Rating: 3★ (lower mid). Rating: 3★ (bottom quartile). Point 4 Risk profile: Moderately Low. Risk profile: Moderate. Risk profile: Moderately Low. Point 5 1Y return: 5.99% (lower mid). 1Y return: 6.36% (upper mid). 1Y return: 5.54% (bottom quartile). Point 6 1M return: 0.73% (bottom quartile). 1M return: 0.80% (lower mid). 1M return: 0.80% (upper mid). Point 7 Sharpe: -0.24 (lower mid). Sharpe: -0.14 (upper mid). Sharpe: -1.09 (bottom quartile). Point 8 Information ratio: 0.00 (upper mid). Information ratio: 0.00 (lower mid). Information ratio: 0.00 (bottom quartile). Point 9 Yield to maturity (debt): 7.66% (bottom quartile). Yield to maturity (debt): 7.87% (lower mid). Yield to maturity (debt): 7.90% (upper mid). Point 10 Modified duration: 0.89 yrs (upper mid). Modified duration: 1.87 yrs (lower mid). Modified duration: 2.17 yrs (bottom quartile). Aditya Birla Sun Life Floating Rate Fund - Long Term
ICICI Prudential Floating Interest Fund
Nippon India Floating Rate Fund
शीर्ष 5 सर्वोत्तम मनी मार्केट म्युच्युअल फंड
Fund NAV Net Assets (Cr) Min Investment 3 MO (%) 6 MO (%) 1 YR (%) 3 YR (%) 2024 (%) Debt Yield (YTM) Mod. Duration Eff. Maturity Aditya Birla Sun Life Money Manager Fund Growth ₹394.846
↑ 0.12 ₹27,550 1,000 1.6 3.3 6.2 7.3 7.4 7.94% 7M 28D 8M 1D UTI Money Market Fund Growth ₹3,291.87
↑ 0.89 ₹18,611 10,000 1.6 3.2 6.2 7.3 7.5 7.58% 6M 20D 6M 20D Kotak Money Market Scheme Growth ₹4,791.87
↑ 1.27 ₹31,606 5,000 1.6 3.2 6.2 7.2 7.4 7.71% 7M 6D 7M 6D ICICI Prudential Money Market Fund Growth ₹404.871
↑ 0.12 ₹30,335 500 1.5 3.2 6.1 7.2 7.4 7.7% 6M 29D 7M 16D Tata Money Market Fund Growth ₹5,039.38
↑ 1.51 ₹33,030 5,000 1.6 3.3 6.2 7.3 7.4 7.79% 7M 1D 7M 1D Note: Returns up to 1 year are on absolute basis & more than 1 year are on CAGR basis. as on 13 Jul 26 Research Highlights & Commentary of 5 Funds showcased
Commentary Aditya Birla Sun Life Money Manager Fund UTI Money Market Fund Kotak Money Market Scheme ICICI Prudential Money Market Fund Tata Money Market Fund Point 1 Bottom quartile AUM (₹27,550 Cr). Bottom quartile AUM (₹18,611 Cr). Upper mid AUM (₹31,606 Cr). Lower mid AUM (₹30,335 Cr). Highest AUM (₹33,030 Cr). Point 2 Established history (20+ yrs). Established history (17+ yrs). Oldest track record among peers (23 yrs). Established history (20+ yrs). Established history (23+ yrs). Point 3 Top rated. Rating: 4★ (upper mid). Rating: 4★ (lower mid). Rating: 4★ (bottom quartile). Rating: 3★ (bottom quartile). Point 4 Risk profile: Low. Risk profile: Low. Risk profile: Low. Risk profile: Low. Risk profile: Low. Point 5 1Y return: 6.19% (upper mid). 1Y return: 6.22% (top quartile). 1Y return: 6.17% (bottom quartile). 1Y return: 6.15% (bottom quartile). 1Y return: 6.19% (lower mid). Point 6 1M return: 0.81% (top quartile). 1M return: 0.78% (lower mid). 1M return: 0.78% (bottom quartile). 1M return: 0.78% (upper mid). 1M return: 0.77% (bottom quartile). Point 7 Sharpe: 0.19 (bottom quartile). Sharpe: 0.35 (upper mid). Sharpe: 0.24 (lower mid). Sharpe: 0.19 (bottom quartile). Sharpe: 0.48 (top quartile). Point 8 Information ratio: 0.00 (top quartile). Information ratio: 0.00 (upper mid). Information ratio: 0.00 (lower mid). Information ratio: 0.00 (bottom quartile). Information ratio: 0.00 (bottom quartile). Point 9 Yield to maturity (debt): 7.94% (top quartile). Yield to maturity (debt): 7.58% (bottom quartile). Yield to maturity (debt): 7.71% (lower mid). Yield to maturity (debt): 7.70% (bottom quartile). Yield to maturity (debt): 7.79% (upper mid). Point 10 Modified duration: 0.66 yrs (bottom quartile). Modified duration: 0.56 yrs (top quartile). Modified duration: 0.60 yrs (bottom quartile). Modified duration: 0.58 yrs (upper mid). Modified duration: 0.59 yrs (lower mid). Aditya Birla Sun Life Money Manager Fund
UTI Money Market Fund
Kotak Money Market Scheme
ICICI Prudential Money Market Fund
Tata Money Market Fund
टॉप 5 शॉर्ट टर्म बाँड म्युच्युअल फंड
Fund NAV Net Assets (Cr) 3 MO (%) 6 MO (%) 1 YR (%) 3 YR (%) 2024 (%) Debt Yield (YTM) Mod. Duration Eff. Maturity PGIM India Short Maturity Fund Growth ₹39.3202
↓ 0.00 ₹28 1.2 3.1 6.1 4.2 7.18% 1Y 7M 28D 1Y 11M 1D ICICI Prudential Short Term Fund Growth ₹64.1425
↑ 0.01 ₹21,229 2.1 3.3 5.9 7.4 8 8.14% 2Y 8M 19D 4Y 5M 23D Aditya Birla Sun Life Short Term Opportunities Fund Growth ₹50.482
↑ 0.02 ₹6,825 2.1 3 5.5 7.2 7.7 7.8% 2Y 1M 10D 2Y 8M 5D Nippon India Short Term Fund Growth ₹56.023
↑ 0.01 ₹7,247 2 3 5.4 7.3 7.9 8.03% 2Y 3M 18D 2Y 8M 23D UTI Short Term Income Fund Growth ₹33.5534
↑ 0.01 ₹2,405 2 2.9 5.1 7 7.3 7.92% 1Y 9M 7D 2Y 8M 19D Note: Returns up to 1 year are on absolute basis & more than 1 year are on CAGR basis. as on 29 Sep 23 Research Highlights & Commentary of 5 Funds showcased
Commentary PGIM India Short Maturity Fund ICICI Prudential Short Term Fund Aditya Birla Sun Life Short Term Opportunities Fund Nippon India Short Term Fund UTI Short Term Income Fund Point 1 Bottom quartile AUM (₹28 Cr). Highest AUM (₹21,229 Cr). Lower mid AUM (₹6,825 Cr). Upper mid AUM (₹7,247 Cr). Bottom quartile AUM (₹2,405 Cr). Point 2 Established history (23+ yrs). Oldest track record among peers (24 yrs). Established history (23+ yrs). Established history (23+ yrs). Established history (18+ yrs). Point 3 Top rated. Rating: 4★ (upper mid). Rating: 4★ (lower mid). Rating: 4★ (bottom quartile). Rating: 4★ (bottom quartile). Point 4 Risk profile: Moderate. Risk profile: Moderate. Risk profile: Moderate. Risk profile: Moderately Low. Risk profile: Moderate. Point 5 1Y return: 6.08% (top quartile). 1Y return: 5.94% (upper mid). 1Y return: 5.47% (lower mid). 1Y return: 5.36% (bottom quartile). 1Y return: 5.13% (bottom quartile). Point 6 1M return: 0.43% (bottom quartile). 1M return: 0.99% (top quartile). 1M return: 0.96% (upper mid). 1M return: 0.80% (bottom quartile). 1M return: 0.83% (lower mid). Point 7 Sharpe: -0.98 (upper mid). Sharpe: -0.80 (top quartile). Sharpe: -1.21 (bottom quartile). Sharpe: -1.18 (lower mid). Sharpe: -1.45 (bottom quartile). Point 8 Information ratio: 0.00 (top quartile). Information ratio: 0.00 (upper mid). Information ratio: 0.00 (lower mid). Information ratio: 0.00 (bottom quartile). Information ratio: 0.00 (bottom quartile). Point 9 Yield to maturity (debt): 7.18% (bottom quartile). Yield to maturity (debt): 8.14% (top quartile). Yield to maturity (debt): 7.80% (bottom quartile). Yield to maturity (debt): 8.03% (upper mid). Yield to maturity (debt): 7.92% (lower mid). Point 10 Modified duration: 1.66 yrs (top quartile). Modified duration: 2.72 yrs (bottom quartile). Modified duration: 2.11 yrs (lower mid). Modified duration: 2.30 yrs (bottom quartile). Modified duration: 1.77 yrs (upper mid). PGIM India Short Maturity Fund
ICICI Prudential Short Term Fund
Aditya Birla Sun Life Short Term Opportunities Fund
Nippon India Short Term Fund
UTI Short Term Income Fund
शीर्ष 5 मध्यम ते दीर्घ मुदतीचे बाँड म्युच्युअल फंड
शीर्षस्थानीमध्यम ते दीर्घ मुदतीचे बाँड एयूएम/निव्वळ मालमत्ता > 500 कोटी असलेले निधी.Fund NAV Net Assets (Cr) 3 MO (%) 6 MO (%) 1 YR (%) 3 YR (%) 2024 (%) Debt Yield (YTM) Mod. Duration Eff. Maturity SBI Magnum Income Fund Growth ₹73.8747
↓ 0.00 ₹2,020 2.5 3.1 4.1 6.5 5.9 7.92% 4Y 1M 17D 8Y 3M ICICI Prudential Bond Fund Growth ₹42.3421
↓ 0.00 ₹2,628 3.1 3.5 4.5 7.2 6.7 7.85% 6Y 5M 19D 15Y 2M 16D Aditya Birla Sun Life Income Fund Growth ₹130.254
↓ -0.07 ₹1,752 2.8 3 3.4 6.2 5.1 7.74% 6Y 5M 19D 15Y 1M 20D HDFC Income Fund Growth ₹60.7325
↓ -0.03 ₹817 3 3.4 3.8 6.6 5.5 7.34% 6Y 5M 8D 13Y 1M 28D Kotak Bond Fund Growth ₹80.0764
↓ -0.09 ₹1,811 3 3.3 3.8 6.4 5.4 7.59% 4Y 7M 20D 8Y 2M 5D Note: Returns up to 1 year are on absolute basis & more than 1 year are on CAGR basis. as on 13 Jul 26 Research Highlights & Commentary of 5 Funds showcased
Commentary SBI Magnum Income Fund ICICI Prudential Bond Fund Aditya Birla Sun Life Income Fund HDFC Income Fund Kotak Bond Fund Point 1 Upper mid AUM (₹2,020 Cr). Highest AUM (₹2,628 Cr). Bottom quartile AUM (₹1,752 Cr). Bottom quartile AUM (₹817 Cr). Lower mid AUM (₹1,811 Cr). Point 2 Established history (27+ yrs). Established history (17+ yrs). Oldest track record among peers (30 yrs). Established history (25+ yrs). Established history (26+ yrs). Point 3 Top rated. Rating: 3★ (upper mid). Rating: 3★ (lower mid). Rating: 2★ (bottom quartile). Rating: 2★ (bottom quartile). Point 4 Risk profile: Moderate. Risk profile: Moderate. Risk profile: Moderate. Risk profile: Moderate. Risk profile: Moderate. Point 5 1Y return: 4.10% (upper mid). 1Y return: 4.48% (top quartile). 1Y return: 3.36% (bottom quartile). 1Y return: 3.85% (lower mid). 1Y return: 3.80% (bottom quartile). Point 6 1M return: 1.44% (bottom quartile). 1M return: 1.75% (lower mid). 1M return: 1.79% (upper mid). 1M return: 1.81% (top quartile). 1M return: 1.68% (bottom quartile). Point 7 Sharpe: -1.74 (bottom quartile). Sharpe: -1.43 (top quartile). Sharpe: -1.86 (bottom quartile). Sharpe: -1.62 (upper mid). Sharpe: -1.63 (lower mid). Point 8 Information ratio: 0.00 (top quartile). Information ratio: 0.00 (upper mid). Information ratio: 0.00 (lower mid). Information ratio: 0.00 (bottom quartile). Information ratio: 0.00 (bottom quartile). Point 9 Yield to maturity (debt): 7.92% (top quartile). Yield to maturity (debt): 7.85% (upper mid). Yield to maturity (debt): 7.74% (lower mid). Yield to maturity (debt): 7.34% (bottom quartile). Yield to maturity (debt): 7.59% (bottom quartile). Point 10 Modified duration: 4.13 yrs (top quartile). Modified duration: 6.47 yrs (bottom quartile). Modified duration: 6.47 yrs (bottom quartile). Modified duration: 6.44 yrs (lower mid). Modified duration: 4.64 yrs (upper mid). SBI Magnum Income Fund
ICICI Prudential Bond Fund
Aditya Birla Sun Life Income Fund
HDFC Income Fund
Kotak Bond Fund
शीर्ष 5 बँकिंग आणि PSU डेट म्युच्युअल फंड
Fund NAV Net Assets (Cr) 3 MO (%) 6 MO (%) 1 YR (%) 3 YR (%) 2024 (%) Debt Yield (YTM) Mod. Duration Eff. Maturity UTI Banking & PSU Debt Fund Growth ₹23.2843
↑ 0.01 ₹1,227 1.6 3 5.5 7 7.8 7.69% 9M 14D 10M 2D HDFC Banking and PSU Debt Fund Growth ₹24.3309
↑ 0.01 ₹5,215 2.2 3 5 7 7.5 7.78% 3Y 7D 4Y 1M 2D ICICI Prudential Banking and PSU Debt Fund Growth ₹34.7588
↑ 0.01 ₹8,943 2.2 3.1 5.6 7.2 7.6 7.9% 3Y 2M 16D 5Y 9M 29D Kotak Banking and PSU Debt fund Growth ₹69.3868
↑ 0.01 ₹5,009 2.1 3 5.4 7.2 7.7 7.77% 2Y 9M 22D 3Y 6M 18D Aditya Birla Sun Life Banking & PSU Debt Fund Growth ₹386.914
↑ 0.02 ₹8,820 1.9 2.9 4.9 7 7.3 7.73% 2Y 6M 29D 3Y 9M 18D Note: Returns up to 1 year are on absolute basis & more than 1 year are on CAGR basis. as on 13 Jul 26 Research Highlights & Commentary of 5 Funds showcased
Commentary UTI Banking & PSU Debt Fund HDFC Banking and PSU Debt Fund ICICI Prudential Banking and PSU Debt Fund Kotak Banking and PSU Debt fund Aditya Birla Sun Life Banking & PSU Debt Fund Point 1 Bottom quartile AUM (₹1,227 Cr). Lower mid AUM (₹5,215 Cr). Highest AUM (₹8,943 Cr). Bottom quartile AUM (₹5,009 Cr). Upper mid AUM (₹8,820 Cr). Point 2 Established history (12+ yrs). Established history (12+ yrs). Established history (16+ yrs). Oldest track record among peers (27 yrs). Established history (18+ yrs). Point 3 Top rated. Rating: 5★ (upper mid). Rating: 4★ (lower mid). Rating: 4★ (bottom quartile). Rating: 4★ (bottom quartile). Point 4 Risk profile: Moderate. Risk profile: Moderately Low. Risk profile: Moderate. Risk profile: Moderately Low. Risk profile: Moderate. Point 5 1Y return: 5.50% (upper mid). 1Y return: 5.05% (bottom quartile). 1Y return: 5.58% (top quartile). 1Y return: 5.44% (lower mid). 1Y return: 4.85% (bottom quartile). Point 6 1M return: 0.76% (bottom quartile). 1M return: 0.93% (lower mid). 1M return: 1.00% (top quartile). 1M return: 0.84% (bottom quartile). 1M return: 0.93% (upper mid). Point 7 Sharpe: -1.01 (top quartile). Sharpe: -1.58 (bottom quartile). Sharpe: -1.19 (upper mid). Sharpe: -1.38 (lower mid). Sharpe: -1.66 (bottom quartile). Point 8 Information ratio: 0.00 (top quartile). Information ratio: 0.00 (upper mid). Information ratio: 0.00 (lower mid). Information ratio: 0.00 (bottom quartile). Information ratio: 0.00 (bottom quartile). Point 9 Yield to maturity (debt): 7.69% (bottom quartile). Yield to maturity (debt): 7.78% (upper mid). Yield to maturity (debt): 7.90% (top quartile). Yield to maturity (debt): 7.77% (lower mid). Yield to maturity (debt): 7.73% (bottom quartile). Point 10 Modified duration: 0.79 yrs (top quartile). Modified duration: 3.02 yrs (bottom quartile). Modified duration: 3.21 yrs (bottom quartile). Modified duration: 2.81 yrs (lower mid). Modified duration: 2.58 yrs (upper mid). UTI Banking & PSU Debt Fund
HDFC Banking and PSU Debt Fund
ICICI Prudential Banking and PSU Debt Fund
Kotak Banking and PSU Debt fund
Aditya Birla Sun Life Banking & PSU Debt Fund
शीर्ष 5 क्रेडिट जोखीम म्युच्युअल फंड
शीर्षस्थानीउधारीची जोखीम एयूएम/निव्वळ मालमत्ता > 500 कोटी असलेले निधी.Fund NAV Net Assets (Cr) 3 MO (%) 6 MO (%) 1 YR (%) 3 YR (%) 2024 (%) Debt Yield (YTM) Mod. Duration Eff. Maturity SBI Credit Risk Fund Growth ₹49.1928
↑ 0.00 ₹2,142 2.6 4.5 7.2 7.8 7.9 8.7% 2Y 22D 2Y 8M 23D HDFC Credit Risk Debt Fund Growth ₹25.8139
↓ -0.01 ₹7,523 2.2 3.8 6.8 7.6 8 8.8% 2Y 2M 23D 3Y 5M 23D Kotak Credit Risk Fund Growth ₹31.6367
↓ -0.03 ₹761 1.9 3.2 6.9 7.7 9.1 8.95% 1Y 11M 5D 2Y 11M 5D Nippon India Credit Risk Fund Growth ₹37.775
↑ 0.01 ₹1,410 2.2 4 7.1 8.2 8.9 9.12% 2Y 11D 2Y 5M 5D ICICI Prudential Regular Savings Fund Growth ₹34.4992
↓ -0.02 ₹6,005 2.2 3.8 7.9 8.4 9.5 8.93% 2Y 14D 3Y 1M 10D Note: Returns up to 1 year are on absolute basis & more than 1 year are on CAGR basis. as on 13 Jul 26 Research Highlights & Commentary of 5 Funds showcased
Commentary SBI Credit Risk Fund HDFC Credit Risk Debt Fund Kotak Credit Risk Fund Nippon India Credit Risk Fund ICICI Prudential Regular Savings Fund Point 1 Lower mid AUM (₹2,142 Cr). Highest AUM (₹7,523 Cr). Bottom quartile AUM (₹761 Cr). Bottom quartile AUM (₹1,410 Cr). Upper mid AUM (₹6,005 Cr). Point 2 Oldest track record among peers (22 yrs). Established history (12+ yrs). Established history (16+ yrs). Established history (21+ yrs). Established history (15+ yrs). Point 3 Top rated. Rating: 4★ (upper mid). Rating: 3★ (lower mid). Rating: 2★ (bottom quartile). Rating: 1★ (bottom quartile). Point 4 Risk profile: Moderate. Risk profile: Moderate. Risk profile: Moderately Low. Risk profile: Moderate. Risk profile: Moderate. Point 5 1Y return: 7.21% (upper mid). 1Y return: 6.80% (bottom quartile). 1Y return: 6.88% (bottom quartile). 1Y return: 7.14% (lower mid). 1Y return: 7.94% (top quartile). Point 6 1M return: 1.19% (top quartile). 1M return: 1.08% (bottom quartile). 1M return: 1.16% (lower mid). 1M return: 0.81% (bottom quartile). 1M return: 1.17% (upper mid). Point 7 Sharpe: 0.42 (lower mid). Sharpe: -0.11 (bottom quartile). Sharpe: 0.01 (bottom quartile). Sharpe: 0.69 (upper mid). Sharpe: 0.95 (top quartile). Point 8 Information ratio: 0.00 (top quartile). Information ratio: 0.00 (upper mid). Information ratio: 0.00 (lower mid). Information ratio: 0.00 (bottom quartile). Information ratio: 0.00 (bottom quartile). Point 9 Yield to maturity (debt): 8.70% (bottom quartile). Yield to maturity (debt): 8.80% (bottom quartile). Yield to maturity (debt): 8.95% (upper mid). Yield to maturity (debt): 9.12% (top quartile). Yield to maturity (debt): 8.93% (lower mid). Point 10 Modified duration: 2.06 yrs (bottom quartile). Modified duration: 2.23 yrs (bottom quartile). Modified duration: 1.93 yrs (top quartile). Modified duration: 2.03 yrs (upper mid). Modified duration: 2.04 yrs (lower mid). SBI Credit Risk Fund
HDFC Credit Risk Debt Fund
Kotak Credit Risk Fund
Nippon India Credit Risk Fund
ICICI Prudential Regular Savings Fund
शीर्ष 5 डायनॅमिक बाँड म्युच्युअल फंड
शीर्षस्थानीडायनॅमिक बाँड एयूएम/निव्वळ मालमत्ता > 500 कोटी असलेले निधी.Fund NAV Net Assets (Cr) 3 MO (%) 6 MO (%) 1 YR (%) 3 YR (%) 2024 (%) Debt Yield (YTM) Mod. Duration Eff. Maturity SBI Dynamic Bond Fund Growth ₹37.427
↑ 0.00 ₹3,771 2.1 3.6 4.6 6.7 5.5 7.82% 3Y 7M 13D 5Y 4M 24D Bandhan Dynamic Bond Fund Growth ₹36.0084
↓ -0.03 ₹2,026 4.1 5.8 6.1 7.1 3.4 7.71% 7Y 11M 23D 21Y 3M 14D Axis Dynamic Bond Fund Growth ₹31.5313
↓ -0.01 ₹1,026 3 4.3 5.9 7.4 7.1 7.28% 5Y 11D 10Y 8M 23D Aditya Birla Sun Life Dynamic Bond Fund Growth ₹49.0199
↑ 0.00 ₹1,459 2.8 3.7 5.2 7.3 7 8.58% 4Y 6M 25D 8Y 2M 19D HDFC Dynamic Debt Fund Growth ₹93.2338
↓ -0.06 ₹527 3.1 3.5 3.7 6.4 4.7 7.53% 7Y 4M 24D 19Y 8M 26D Note: Returns up to 1 year are on absolute basis & more than 1 year are on CAGR basis. as on 13 Jul 26 Research Highlights & Commentary of 5 Funds showcased
Commentary SBI Dynamic Bond Fund Bandhan Dynamic Bond Fund Axis Dynamic Bond Fund Aditya Birla Sun Life Dynamic Bond Fund HDFC Dynamic Debt Fund Point 1 Highest AUM (₹3,771 Cr). Upper mid AUM (₹2,026 Cr). Bottom quartile AUM (₹1,026 Cr). Lower mid AUM (₹1,459 Cr). Bottom quartile AUM (₹527 Cr). Point 2 Established history (22+ yrs). Established history (17+ yrs). Established history (15+ yrs). Established history (21+ yrs). Oldest track record among peers (29 yrs). Point 3 Top rated. Rating: 3★ (upper mid). Rating: 3★ (lower mid). Rating: 3★ (bottom quartile). Rating: 3★ (bottom quartile). Point 4 Risk profile: Moderate. Risk profile: Moderate. Risk profile: Moderate. Risk profile: Moderate. Risk profile: Moderate. Point 5 1Y return: 4.57% (bottom quartile). 1Y return: 6.11% (top quartile). 1Y return: 5.85% (upper mid). 1Y return: 5.19% (lower mid). 1Y return: 3.66% (bottom quartile). Point 6 1M return: 0.99% (bottom quartile). 1M return: 2.44% (top quartile). 1M return: 1.67% (lower mid). 1M return: 1.43% (bottom quartile). 1M return: 2.05% (upper mid). Point 7 Sharpe: -1.69 (bottom quartile). Sharpe: -1.10 (upper mid). Sharpe: -1.09 (top quartile). Sharpe: -1.52 (bottom quartile). Sharpe: -1.49 (lower mid). Point 8 Information ratio: 0.00 (top quartile). Information ratio: 0.00 (upper mid). Information ratio: 0.00 (lower mid). Information ratio: 0.00 (bottom quartile). Information ratio: 0.00 (bottom quartile). Point 9 Yield to maturity (debt): 7.82% (upper mid). Yield to maturity (debt): 7.71% (lower mid). Yield to maturity (debt): 7.28% (bottom quartile). Yield to maturity (debt): 8.58% (top quartile). Yield to maturity (debt): 7.53% (bottom quartile). Point 10 Modified duration: 3.62 yrs (top quartile). Modified duration: 7.98 yrs (bottom quartile). Modified duration: 5.03 yrs (lower mid). Modified duration: 4.57 yrs (upper mid). Modified duration: 7.40 yrs (bottom quartile). SBI Dynamic Bond Fund
Bandhan Dynamic Bond Fund
Axis Dynamic Bond Fund
Aditya Birla Sun Life Dynamic Bond Fund
HDFC Dynamic Debt Fund
शीर्ष 5 कॉर्पोरेट बाँड म्युच्युअल फंड
शीर्षस्थानीकॉर्पोरेट बाँड एयूएम/निव्वळ मालमत्ता > 500 कोटी असलेले निधी.Fund NAV Net Assets (Cr) 3 MO (%) 6 MO (%) 1 YR (%) 3 YR (%) 2024 (%) Debt Yield (YTM) Mod. Duration Eff. Maturity Aditya Birla Sun Life Corporate Bond Fund Growth ₹119.432
↑ 0.03 ₹24,390 2.4 3.1 5.1 7.3 7.4 7.72% 3Y 11M 8D 6Y 6M 29D HDFC Corporate Bond Fund Growth ₹34.3926
↑ 0.01 ₹31,067 2.5 3 5 7.3 7.3 7.79% 4Y 18D 6Y 11M 12D ICICI Prudential Corporate Bond Fund Growth ₹31.8394
↑ 0.00 ₹31,740 2.3 3.4 6 7.6 8 7.91% 3Y 4M 10D 5Y 8M 23D Kotak Corporate Bond Fund Standard Growth ₹3,997.77
↑ 0.67 ₹15,990 2 2.9 5.2 7.3 7.8 7.99% 2Y 6M 29D 4Y Nippon India Prime Debt Fund Growth ₹63.5503
↑ 0.01 ₹9,393 2.1 3.1 5.1 7.4 7.8 7.9% 2Y 4M 6D 2Y 10M 13D Note: Returns up to 1 year are on absolute basis & more than 1 year are on CAGR basis. as on 13 Jul 26 Research Highlights & Commentary of 5 Funds showcased
Commentary Aditya Birla Sun Life Corporate Bond Fund HDFC Corporate Bond Fund ICICI Prudential Corporate Bond Fund Kotak Corporate Bond Fund Standard Nippon India Prime Debt Fund Point 1 Lower mid AUM (₹24,390 Cr). Upper mid AUM (₹31,067 Cr). Highest AUM (₹31,740 Cr). Bottom quartile AUM (₹15,990 Cr). Bottom quartile AUM (₹9,393 Cr). Point 2 Oldest track record among peers (29 yrs). Established history (16+ yrs). Established history (16+ yrs). Established history (18+ yrs). Established history (25+ yrs). Point 3 Top rated. Rating: 5★ (upper mid). Rating: 4★ (lower mid). Rating: 4★ (bottom quartile). Rating: 4★ (bottom quartile). Point 4 Risk profile: Moderately Low. Risk profile: Moderately Low. Risk profile: Moderately Low. Risk profile: Moderately Low. Risk profile: Moderately Low. Point 5 1Y return: 5.10% (bottom quartile). 1Y return: 4.97% (bottom quartile). 1Y return: 6.05% (top quartile). 1Y return: 5.16% (upper mid). 1Y return: 5.11% (lower mid). Point 6 1M return: 1.28% (top quartile). 1M return: 1.25% (upper mid). 1M return: 1.11% (lower mid). 1M return: 0.96% (bottom quartile). 1M return: 0.98% (bottom quartile). Point 7 Sharpe: -1.30 (upper mid). Sharpe: -1.52 (bottom quartile). Sharpe: -0.83 (top quartile). Sharpe: -1.42 (lower mid). Sharpe: -1.43 (bottom quartile). Point 8 Information ratio: 0.00 (top quartile). Information ratio: 0.00 (upper mid). Information ratio: 0.00 (lower mid). Information ratio: 0.00 (bottom quartile). Information ratio: 0.00 (bottom quartile). Point 9 Yield to maturity (debt): 7.72% (bottom quartile). Yield to maturity (debt): 7.79% (bottom quartile). Yield to maturity (debt): 7.91% (upper mid). Yield to maturity (debt): 7.99% (top quartile). Yield to maturity (debt): 7.90% (lower mid). Point 10 Modified duration: 3.94 yrs (bottom quartile). Modified duration: 4.05 yrs (bottom quartile). Modified duration: 3.36 yrs (lower mid). Modified duration: 2.58 yrs (upper mid). Modified duration: 2.35 yrs (top quartile). Aditya Birla Sun Life Corporate Bond Fund
HDFC Corporate Bond Fund
ICICI Prudential Corporate Bond Fund
Kotak Corporate Bond Fund Standard
Nippon India Prime Debt Fund
शीर्ष 5 गिल्ट म्युच्युअल फंड
शीर्षस्थानी (Erstwhile DHFL Pramerica Credit Opportunities Fund) The investment objective of the Scheme is to generate income and capital appreciation by investing predominantly in corporate debt. There can be no assurance that the investment objective of the Scheme will be realized. Research Highlights for PGIM India Credit Risk Fund Below is the key information for PGIM India Credit Risk Fund Returns up to 1 year are on (Erstwhile Axis Fixed Income Opportunities Fund) To generate stable returns by investing in debt & money market instruments across the yield curve & credit spectrum. However, there is no assurance or guarantee that the investment objective of the Scheme will be achieved. The Scheme does not assure or guarantee any returns Research Highlights for Axis Credit Risk Fund Below is the key information for Axis Credit Risk Fund Returns up to 1 year are on The objective of the Scheme is to generate income through investment primarily in low duration debt & money market securities. There is no assurance or guarantee that the investment objective of the scheme will be achieved. Research Highlights for PGIM India Low Duration Fund Below is the key information for PGIM India Low Duration Fund Returns up to 1 year are on (Erstwhile DHFL Pramerica Insta Cash Plus Fund) To generate steady returns along with high liquidity by investing in a portfolio of short-term, high quality money market and debt instruments. Research Highlights for PGIM India Insta Cash Fund Below is the key information for PGIM India Insta Cash Fund Returns up to 1 year are on To provide a high level of liquidity with returns commensurate with low risk through a portfolio of money market and debt securities with maturity of up to 91days. However, there can be no assurance that the investment objective of the scheme will be achieved. Research Highlights for Indiabulls Liquid Fund Below is the key information for Indiabulls Liquid Fund Returns up to 1 year are on लागू आहे एयूएम/निव्वळ मालमत्ता > 500 कोटी असलेले निधी.Fund NAV Net Assets (Cr) 3 MO (%) 6 MO (%) 1 YR (%) 3 YR (%) 2024 (%) Debt Yield (YTM) Mod. Duration Eff. Maturity ICICI Prudential Gilt Fund Growth ₹108.545
↓ -0.09 ₹8,608 3.6 3.9 4.8 7.3 6.8 7.71% 9Y 4M 10D 21Y 7M 6D UTI Gilt Fund Growth ₹65.8071
↑ 0.00 ₹544 1.8 3.7 4.2 6.7 5.1 6.4% 3Y 2M 16D 7Y 11M 19D SBI Magnum Constant Maturity Fund Growth ₹66.7905
↓ -0.06 ₹1,665 3.2 3 4 7 6.7 7.23% 6Y 9M 14D 9Y 6M 11D SBI Magnum Gilt Fund Growth ₹68.4888
↓ -0.01 ₹8,695 2.7 3.3 3.4 6.4 4.5 6.89% 5Y 10M 28D 10Y 1M 20D Nippon India Gilt Securities Fund Growth ₹39.3112
↓ -0.04 ₹1,637 3.4 3.7 3 6.1 3.7 7.45% 8Y 7M 28D 21Y 3M 14D Note: Returns up to 1 year are on absolute basis & more than 1 year are on CAGR basis. as on 13 Jul 26 Research Highlights & Commentary of 5 Funds showcased
Commentary ICICI Prudential Gilt Fund UTI Gilt Fund SBI Magnum Constant Maturity Fund SBI Magnum Gilt Fund Nippon India Gilt Securities Fund Point 1 Upper mid AUM (₹8,608 Cr). Bottom quartile AUM (₹544 Cr). Lower mid AUM (₹1,665 Cr). Highest AUM (₹8,695 Cr). Bottom quartile AUM (₹1,637 Cr). Point 2 Oldest track record among peers (26 yrs). Established history (24+ yrs). Established history (25+ yrs). Established history (25+ yrs). Established history (17+ yrs). Point 3 Top rated. Rating: 4★ (upper mid). Rating: 4★ (lower mid). Rating: 4★ (bottom quartile). Rating: 4★ (bottom quartile). Point 4 Risk profile: Moderate. Risk profile: Moderate. Risk profile: Moderately Low. Risk profile: Moderate. Risk profile: Moderate. Point 5 1Y return: 4.75% (top quartile). 1Y return: 4.20% (upper mid). 1Y return: 3.99% (lower mid). 1Y return: 3.37% (bottom quartile). 1Y return: 2.96% (bottom quartile). Point 6 1M return: 2.33% (upper mid). 1M return: 0.99% (bottom quartile). 1M return: 1.74% (lower mid). 1M return: 1.33% (bottom quartile). 1M return: 2.38% (top quartile). Point 7 Sharpe: -1.15 (upper mid). Sharpe: -0.91 (top quartile). Sharpe: -1.46 (lower mid). Sharpe: -1.55 (bottom quartile). Sharpe: -1.60 (bottom quartile). Point 8 Information ratio: 0.00 (top quartile). Information ratio: 0.00 (upper mid). Information ratio: 0.00 (lower mid). Information ratio: 0.00 (bottom quartile). Information ratio: 0.00 (bottom quartile). Point 9 Yield to maturity (debt): 7.71% (top quartile). Yield to maturity (debt): 6.40% (bottom quartile). Yield to maturity (debt): 7.23% (lower mid). Yield to maturity (debt): 6.89% (bottom quartile). Yield to maturity (debt): 7.45% (upper mid). Point 10 Modified duration: 9.36 yrs (bottom quartile). Modified duration: 3.21 yrs (top quartile). Modified duration: 6.79 yrs (lower mid). Modified duration: 5.91 yrs (upper mid). Modified duration: 8.66 yrs (bottom quartile). ICICI Prudential Gilt Fund
UTI Gilt Fund
SBI Magnum Constant Maturity Fund
SBI Magnum Gilt Fund
Nippon India Gilt Securities Fund
1. PGIM India Credit Risk Fund
PGIM India Credit Risk Fund
Growth Launch Date 29 Sep 14 NAV (21 Jan 22) ₹15.5876 ↑ 0.00 (0.01 %) Net Assets (Cr) ₹39 on 31 Dec 21 Category Debt - Credit Risk AMC Pramerica Asset Managers Private Limited Rating ☆☆☆☆☆ Risk Moderate Expense Ratio 1.85 Sharpe Ratio 1.73 Information Ratio 0 Alpha Ratio 0 Min Investment 5,000 Min SIP Investment 1,000 Exit Load 0-1 Years (1%),1 Years and above(NIL) Yield to Maturity 5.01% Effective Maturity 7 Months 2 Days Modified Duration 6 Months 14 Days Growth of 10,000 investment over the years.
Date Value 30 Jun 21 ₹10,000 Returns for PGIM India Credit Risk Fund
absolute basis & more than 1 year are on CAGR (Compound Annual Growth Rate) basis. as on 21 Jan 22 Duration Returns 1 Month 0.3% 3 Month 0.6% 6 Month 4.4% 1 Year 8.4% 3 Year 3% 5 Year 4.2% 10 Year 15 Year Since launch 6.3% Historical performance (Yearly) on absolute basis
Year Returns 2024 2023 2022 2021 2020 2019 2018 2017 2016 2015 Fund Manager information for PGIM India Credit Risk Fund
Name Since Tenure Data below for PGIM India Credit Risk Fund as on 31 Dec 21
Asset Allocation
Asset Class Value Debt Sector Allocation
Sector Value Credit Quality
Rating Value Top Securities Holdings / Portfolio
Name Holding Value Quantity 2. Axis Credit Risk Fund
Axis Credit Risk Fund
Growth Launch Date 15 Jul 14 NAV (13 Jul 26) ₹23.1972 ↑ 0.00 (0.00 %) Net Assets (Cr) ₹354 on 31 May 26 Category Debt - Credit Risk AMC Axis Asset Management Company Limited Rating ☆☆☆☆☆ Risk Moderate Expense Ratio 1.57 Sharpe Ratio 0.68 Information Ratio 0 Alpha Ratio 0 Min Investment 5,000 Min SIP Investment 1,000 Exit Load 0-12 Months (1%),12 Months and above(NIL) Yield to Maturity 8.63% Effective Maturity 2 Years 5 Months 23 Days Modified Duration 2 Years 1 Month 28 Days Growth of 10,000 investment over the years.
Date Value 30 Jun 21 ₹10,000 30 Jun 22 ₹10,361 30 Jun 23 ₹11,079 30 Jun 24 ₹11,871 30 Jun 25 ₹12,950 30 Jun 26 ₹13,972 Returns for Axis Credit Risk Fund
absolute basis & more than 1 year are on CAGR (Compound Annual Growth Rate) basis. as on 21 Jan 22 Duration Returns 1 Month 1.1% 3 Month 2.5% 6 Month 4.1% 1 Year 7.8% 3 Year 8% 5 Year 6.9% 10 Year 15 Year Since launch 7.3% Historical performance (Yearly) on absolute basis
Year Returns 2024 8.7% 2023 8% 2022 7% 2021 4% 2020 6% 2019 8.2% 2018 4.4% 2017 5.9% 2016 6.4% 2015 9.8% Fund Manager information for Axis Credit Risk Fund
Name Since Tenure Devang Shah 15 Jul 14 11.97 Yr. Akhil Thakker 9 Nov 21 4.64 Yr. Data below for Axis Credit Risk Fund as on 31 May 26
Asset Allocation
Asset Class Value Cash 6.06% Equity 7.7% Debt 85.73% Other 0.51% Debt Sector Allocation
Sector Value Corporate 76.29% Government 9.44% Cash Equivalent 6.06% Credit Quality
Rating Value A 18.98% AA 63.6% AAA 17.42% Top Securities Holdings / Portfolio
Name Holding Value Quantity Jubilant Bevco Limited
Debentures | -5% ₹17 Cr 1,500 Jtpm Metal TRaders Limited
Debentures | -4% ₹16 Cr 1,500 Narayana Hrudayalaya Limited
Debentures | -4% ₹15 Cr 1,500 Infopark Properties Limited
Debentures | -4% ₹15 Cr 1,500 Aditya Birla Digital Fashion Ventures Limited
Debentures | -4% ₹15 Cr 1,500 Altius Telecom Infrastructure Trust
Debentures | -4% ₹15 Cr 1,500 Vedanta Limited
Debentures | -3% ₹12 Cr 1,200 GMR Airports Limited
Debentures | -3% ₹10 Cr 1,000 GMR Hyderabad International Airport Ltd
Debentures | -3% ₹10 Cr 1,000 Jsw Kalinga Steel Limited
Debentures | -3% ₹10 Cr 1,000 3. PGIM India Low Duration Fund
PGIM India Low Duration Fund
Growth Launch Date 22 Jun 07 NAV (29 Sep 23) ₹26.0337 ↑ 0.01 (0.06 %) Net Assets (Cr) ₹104 on 31 Aug 23 Category Debt - Low Duration AMC Pramerica Asset Managers Private Limited Rating ☆☆☆☆☆ Risk Moderate Expense Ratio 1.18 Sharpe Ratio -1.66 Information Ratio 0 Alpha Ratio 0 Min Investment 5,000 Min SIP Investment 1,000 Exit Load NIL Yield to Maturity 7.34% Effective Maturity 7 Months 17 Days Modified Duration 6 Months 11 Days Growth of 10,000 investment over the years.
Date Value 30 Jun 21 ₹10,000 30 Jun 22 ₹10,290 30 Jun 23 ₹10,897 Returns for PGIM India Low Duration Fund
absolute basis & more than 1 year are on CAGR (Compound Annual Growth Rate) basis. as on 21 Jan 22 Duration Returns 1 Month 0.5% 3 Month 1.5% 6 Month 3.3% 1 Year 6.3% 3 Year 4.5% 5 Year 1.3% 10 Year 15 Year Since launch 6.1% Historical performance (Yearly) on absolute basis
Year Returns 2024 2023 2022 2021 2020 2019 2018 2017 2016 2015 Fund Manager information for PGIM India Low Duration Fund
Name Since Tenure Data below for PGIM India Low Duration Fund as on 31 Aug 23
Asset Allocation
Asset Class Value Debt Sector Allocation
Sector Value Credit Quality
Rating Value Top Securities Holdings / Portfolio
Name Holding Value Quantity 4. PGIM India Insta Cash Fund
PGIM India Insta Cash Fund
Growth Launch Date 5 Sep 07 NAV (13 Jul 26) ₹362.138 ↑ 0.05 (0.01 %) Net Assets (Cr) ₹612 on 31 May 26 Category Debt - Liquid Fund AMC Pramerica Asset Managers Private Limited Rating ☆☆☆☆☆ Risk Low Expense Ratio 0.25 Sharpe Ratio 2.23 Information Ratio 0.62 Alpha Ratio -0.03 Min Investment 5,000 Min SIP Investment 1,000 Exit Load NIL Yield to Maturity 6.57% Effective Maturity 1 Month 10 Days Modified Duration 1 Month 10 Days Growth of 10,000 investment over the years.
Date Value 30 Jun 21 ₹10,000 30 Jun 22 ₹10,356 30 Jun 23 ₹11,018 30 Jun 24 ₹11,815 30 Jun 25 ₹12,665 30 Jun 26 ₹13,462 Returns for PGIM India Insta Cash Fund
absolute basis & more than 1 year are on CAGR (Compound Annual Growth Rate) basis. as on 21 Jan 22 Duration Returns 1 Month 0.6% 3 Month 1.6% 6 Month 3.3% 1 Year 6.3% 3 Year 6.9% 5 Year 6.1% 10 Year 15 Year Since launch 7.1% Historical performance (Yearly) on absolute basis
Year Returns 2024 6.5% 2023 7.3% 2022 7% 2021 4.8% 2020 3.3% 2019 4.2% 2018 6.7% 2017 7.4% 2016 6.7% 2015 7.7% Fund Manager information for PGIM India Insta Cash Fund
Name Since Tenure Puneet Pal 16 Jul 22 3.96 Yr. Akhil Dhar 25 Feb 26 0.34 Yr. Data below for PGIM India Insta Cash Fund as on 31 May 26
Asset Allocation
Asset Class Value Cash 93.34% Debt 6.36% Other 0.3% Debt Sector Allocation
Sector Value Cash Equivalent 80.48% Government 9.72% Corporate 9.5% Credit Quality
Rating Value AAA 100% Top Securities Holdings / Portfolio
Name Holding Value Quantity Clearing Corporation Of India Ltd.
CBLO/Reverse Repo | -12% ₹96 Cr Bajaj Housing Finance Limited
Debentures | -7% ₹55 Cr 5,500,000
↑ 5,500,000 Net Receivables / (Payables)
Net Current Assets | -6% ₹50 Cr Small Industries Development Bank Of India
Debentures | -6% ₹50 Cr 5,000,000
↑ 5,000,000 Indian Bank
Domestic Bonds | -6% ₹49 Cr 5,000,000
↑ 5,000,000 Housing And Urban Development Corporation Limited
Debentures | -6% ₹47 Cr 4,700,000 Aditya Birla Money Ltd.
Commercial Paper | -5% ₹39 Cr 4,000,000
↑ 4,000,000 Icici Securities Limited
Commercial Paper | -4% ₹34 Cr 3,500,000
↑ 3,500,000 India (Republic of)
- | -3% ₹27 Cr 2,700,000 Rec Limited
Debentures | -3% ₹25 Cr 2,500,000
↑ 2,500,000 5. Indiabulls Liquid Fund
Indiabulls Liquid Fund
Growth Launch Date 27 Oct 11 NAV (13 Jul 26) ₹2,689.55 ↑ 0.44 (0.02 %) Net Assets (Cr) ₹262 on 31 May 26 Category Debt - Liquid Fund AMC Indiabulls Asset Management Company Ltd. Rating ☆☆☆☆☆ Risk Low Expense Ratio 0.2 Sharpe Ratio 2.32 Information Ratio 0.76 Alpha Ratio 0.04 Min Investment 500 Min SIP Investment 500 Exit Load NIL Yield to Maturity 6.13% Effective Maturity 1 Month 1 Day Modified Duration 1 Month 1 Day Growth of 10,000 investment over the years.
Date Value 30 Jun 21 ₹10,000 30 Jun 22 ₹10,329 30 Jun 23 ₹10,957 30 Jun 24 ₹11,753 30 Jun 25 ₹12,601 30 Jun 26 ₹13,392 Returns for Indiabulls Liquid Fund
absolute basis & more than 1 year are on CAGR (Compound Annual Growth Rate) basis. as on 21 Jan 22 Duration Returns 1 Month 0.6% 3 Month 1.6% 6 Month 3.3% 1 Year 6.3% 3 Year 6.9% 5 Year 6% 10 Year 15 Year Since launch 7% Historical performance (Yearly) on absolute basis
Year Returns 2024 6.6% 2023 7.4% 2022 6.8% 2021 4.6% 2020 3.1% 2019 3.9% 2018 6.6% 2017 7.3% 2016 6.7% 2015 7.8% Fund Manager information for Indiabulls Liquid Fund
Name Since Tenure Kaustubh Sule 11 May 23 3.14 Yr. Wilfred Gonsalves 4 May 26 0.16 Yr. Data below for Indiabulls Liquid Fund as on 31 May 26
Asset Allocation
Asset Class Value Cash 99.71% Debt 0.29% Debt Sector Allocation
Sector Value Cash Equivalent 70.54% Corporate 26.3% Government 3.16% Credit Quality
Rating Value AAA 99.65% Top Securities Holdings / Portfolio
Name Holding Value Quantity Reverse Repo 16-Jun-26
CBLO/Reverse Repo | -18% ₹44 Cr Canara Bank
Domestic Bonds | -10% ₹25 Cr 2,500,000 HDFC Bank Limited
Certificate of Deposit | -10% ₹25 Cr 2,500,000 Hindustan Petroleum Corp Ltd.
Commercial Paper | -10% ₹24 Cr 2,400,000
↑ 2,400,000 Union Bank Of India
Certificate of Deposit | -10% ₹24 Cr 2,400,000
↑ 2,400,000 Bajaj Finance Ltd.
Commercial Paper | -9% ₹22 Cr 2,200,000
↑ 2,200,000 Kotak Mahindra Prime Limited
Commercial Paper | -8% ₹20 Cr 2,000,000
↑ 2,000,000 Punjab National Bank
Debentures | -6% ₹15 Cr 1,500,000
↑ 1,500,000 Axis Bank Limited
Certificate of Deposit | -6% ₹15 Cr 1,500,000
↑ 1,500,000 Small Industries Development Bank of India
Commercial Paper | -6% ₹15 Cr 1,500,000
↑ 1,500,000
सर्वोत्तम डेट म्युच्युअल फंडाचे मूल्यांकन कसे करावे
तुम्हाला गुंतवण्यासाठी इच्छित असलेले सर्वोत्तम डेट फंड निवडण्यासाठी, काही महत्त्वाच्या मापदंडांचा विचार करण्याची आवश्यकता आहे जसे की सरासरी मॅच्युरिटी, क्रेडिट क्वॉलिटी, एयूएम, एक्पेन्स रेशो, टॅक्स इम्लिप्शन इ. -
1. सरासरी परिपक्वता/कालावधी
डेट फंड्समध्ये सरासरी मॅच्युरिटी हा एक आवश्यक पॅरामीटर आहे ज्याकडे गुंतवणूकदारांकडून दुर्लक्ष केले जाते, जे गुंतवणुकीच्या जोखमींचा विचार न करता दीर्घ कालावधीसाठी गुंतवणूक करतात. गुंतवणूकदारांनी त्यांची डेट फंड गुंतवणूक त्याच्या मॅच्युरिटी कालावधीच्या आधारे ठरवणे आवश्यक आहे, डेट फंडाच्या मॅच्युरिटी कालावधीशी गुंतवणुकीचा कालावधी जुळणे हा तुम्ही अनावश्यक जोखीम पत्करणार नाही याची खात्री करण्याचा एक चांगला मार्ग आहे. अशाप्रकारे, डेट फंडामध्ये इष्टतम जोखीम परतावा मिळविण्यासाठी, गुंतवणूक करण्यापूर्वी, डेट फंडाची सरासरी परिपक्वता जाणून घेणे उचित आहे. सरासरी मॅच्युरिटी (कालावधी हा एक समान घटक आहे) पाहणे महत्त्वाचे आहे, उदाहरणार्थ, लिक्विड फंडाची सरासरी मॅच्युरिटी काही दिवसांपासून कदाचित एक महिन्याची असू शकते, याचा अर्थ असा होईल की गुंतवणूकदारांसाठी हा एक उत्तम पर्याय आहे. काही दिवस पैसे गुंतवायचे. त्याचप्रमाणे, जर तुम्ही एक वर्षाची कालमर्यादा पहात असालगुंतवणूक योजना मग, अल्पकालीन कर्ज निधी आदर्श असू शकतो.
2. व्याजदर परिस्थिती
व्याजदर आणि त्यातील चढ-उतार यामुळे प्रभावित होणाऱ्या डेट फंडांमध्ये बाजारातील वातावरण समजून घेणे खूप महत्त्वाचे आहे. जेव्हा अर्थव्यवस्थेत व्याजदर वाढतो तेव्हा रोख्यांची किंमत कमी होते आणि उलट. तसेच, ज्या काळात व्याजदर वाढतात त्या काळात, जुन्या रोख्यांपेक्षा जास्त उत्पन्न असलेले नवीन रोखे बाजारात जारी केले जातात, ज्यामुळे ते जुने रोखे कमी मूल्याचे बनतात. त्यामुळे, बाजारातील नवीन बाँड्सकडे गुंतवणूकदार अधिक आकर्षित होतात आणि जुन्या बाँड्सची पुनर्मूल्यांकन देखील होते. जर एखाद्या डेट फंडाला अशा "जुन्या बाँड्स" चे एक्सपोजर येत असेल तर जेव्हा व्याजदर वाढतात,नाही कर्ज निधीवर नकारात्मक परिणाम होईल. शिवाय, डेट फंड व्याजदरातील चढउतारांना सामोरे जात असल्याने, ते फंड पोर्टफोलिओमधील अंतर्निहित रोख्यांच्या किमतींना त्रास देतात. उदाहरणार्थ, वाढत्या व्याजदराच्या काळात दीर्घकालीन कर्ज निधीला जास्त धोका असतो. या काळात अल्प-मुदतीची गुंतवणूक योजना बनवल्याने तुमच्या व्याजदरातील जोखीम कमी होईल.
जर एखाद्याला व्याजदरांचे चांगले ज्ञान असेल आणि त्याला त्याचे निरीक्षण करता आले तर त्याचा फायदाही घेता येईल. घसरलेल्या व्याजदराच्या बाजारात, दीर्घकालीन कर्ज निधी हा एक चांगला पर्याय असेल. तथापि, वाढत्या व्याजदराच्या काळात अल्प मुदतीच्या फंडांसारख्या कमी सरासरी परिपक्वता असलेल्या फंडांमध्ये असणे शहाणपणाचे ठरेल.अल्ट्रा शॉर्ट टर्म फंड किंवा लिक्विड फंड देखील.
3. वर्तमान उत्पन्न किंवा पोर्टफोलिओ उत्पन्न
उत्पन्न हे पोर्टफोलिओमधील बाँड्सद्वारे व्युत्पन्न केलेल्या व्याज उत्पन्नाचे मोजमाप आहे. कर्ज किंवा रोख्यांमध्ये गुंतवणूक करणारे फंड ज्यांचे प्रमाण जास्त आहेकूपन दर (किंवा उत्पन्न) एकूण पोर्टफोलिओ उत्पन्न जास्त असेल. परिपक्वतेपर्यंत उत्पन्न (ytmडेट म्युच्युअल फंडाचे ) फंडाचे चालू उत्पन्न दर्शवते. YTM च्या आधारे कर्ज निधीची तुलना करताना, एखाद्याने हे तथ्य देखील पाहिले पाहिजे की अतिरिक्त उत्पन्न कसे निर्माण केले जात आहे. हे कमी पोर्टफोलिओ गुणवत्तेच्या किंमतीवर आहे का? चांगल्या दर्जाच्या नसलेल्या साधनांमध्ये गुंतवणूक करण्याचे स्वतःचे प्रश्न आहेत. तुम्ही डेट फंडात गुंतवणूक करू इच्छित नाही ज्यामध्ये असे रोखे किंवा रोखे असतीलडीफॉल्ट नंतर. म्हणून, नेहमी पोर्टफोलिओ उत्पन्न पहा आणि क्रेडिट गुणवत्तेसह ते संतुलित करा.
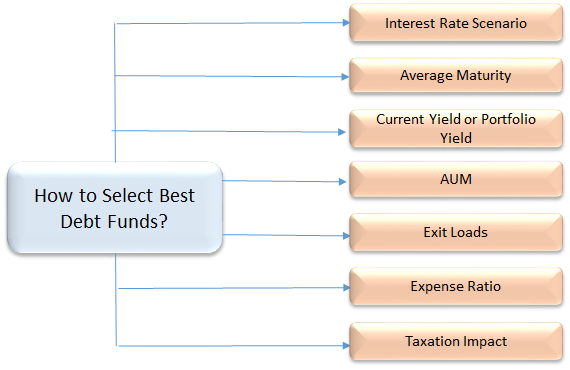
4. पोर्टफोलिओची क्रेडिट गुणवत्ता
सर्वोत्तम डेट फंडांमध्ये गुंतवणूक करण्यासाठी, बॉण्ड्स आणि डेट सिक्युरिटीजची क्रेडिट गुणवत्ता तपासणे हे एक आवश्यक पॅरामीटर आहे. रोखे परत देण्याच्या क्षमतेवर आधारित विविध एजन्सीद्वारे क्रेडिट रेटिंग नियुक्त केले जातात. AAA रेटिंग असलेले बाँड हे सर्वोत्तम क्रेडिट रेटिंग मानले जाते आणि ते सुरक्षित आणि सुरक्षित गुंतवणूक देखील सूचित करते. जर एखाद्याला खरोखरच सुरक्षितता हवी असेल आणि सर्वोत्तम डेट फंड निवडण्यासाठी हे सर्वोत्कृष्ट मापदंड मानत असेल, तर अत्यंत उच्च-गुणवत्तेची कर्ज साधने (AAA किंवा AA+) असलेल्या फंडात प्रवेश करणे हा इच्छित पर्याय असू शकतो.
5. व्यवस्थापन अंतर्गत मालमत्ता (AUM)
सर्वोत्कृष्ट कर्ज निधी निवडताना विचारात घेण्याचे हे सर्वात महत्त्वाचे पॅरामीटर आहे. AUM ही सर्व गुंतवणूकदारांनी विशिष्ट योजनेत गुंतवलेली एकूण रक्कम असते. पासून, बहुतेकम्युच्युअल फंडएकूण AUM डेट फंडांमध्ये गुंतवले जाते, गुंतवणूकदारांनी योजना मालमत्ता निवडणे आवश्यक आहे ज्यात लक्षणीय AUM आहे. कॉर्पोरेट्समध्ये मोठ्या प्रमाणावर एक्सपोजर असलेल्या फंडात असणे धोकादायक असू शकते, कारण त्यांचे पैसे काढणे मोठे असू शकते ज्यामुळे एकूण फंडाच्या कामगिरीवर परिणाम होऊ शकतो.
6. खर्चाचे प्रमाण
डेट फंडांमध्ये विचारात घेतलेला महत्त्वाचा घटक म्हणजे त्याचे खर्चाचे प्रमाण. उच्च खर्चाचे प्रमाण फंडाच्या कामगिरीवर मोठा प्रभाव निर्माण करते. उदाहरणार्थ, लिक्विड फंडांमध्ये सर्वात कमी खर्चाचे प्रमाण असते जे 50 bps पर्यंत असते (BPS हे व्याजदर मोजण्याचे एकक असते ज्यामध्ये एक bps 1% च्या 1/100 व्या बरोबर असते) तर इतर डेट फंड 150 bps पर्यंत आकारू शकतात. त्यामुळे एका डेट म्युच्युअल फंडामधून निवड करण्यासाठी, व्यवस्थापन शुल्क किंवा फंड चालविण्याचा खर्च विचारात घेणे महत्त्वाचे आहे.
7. कर आकारणी प्रभाव
डेट फंड इंडेक्सेशन लाभांसह दीर्घकालीन भांडवली नफ्याचा (3 वर्षांपेक्षा जास्त) लाभ देतात. आणि अल्पकालीन भांडवली नफ्यावर (3 वर्षांपेक्षा कमी) 30% कर आकारला जातो.
गुंतवणूकदार म्हणून विचारात घेण्यासारख्या गोष्टी
1. निधीची उद्दिष्टे
विविध प्रकारच्या सिक्युरिटीजचा वैविध्यपूर्ण पोर्टफोलिओ राखून इष्टतम परतावा मिळविण्याचे डेट फंडाचे उद्दिष्ट आहे. तुम्ही त्यांच्याकडून अंदाजानुसार कामगिरी करण्याची अपेक्षा करू शकता. या कारणास्तव, डेट फंड पुराणमतवादी गुंतवणूकदारांमध्ये लोकप्रिय आहेत.
2. निधीचे प्रकार
डेट फंड पुढे विविध श्रेणींमध्ये विभागले गेले आहेत जसे की लिक्विड फंड,मासिक उत्पन्न योजना (एमआयपी), निश्चित परिपक्वता योजना (एफएमपी),डायनॅमिक बाँड फंड, इन्कम फंड, क्रेडिट संधी फंड, GILT फंड, शॉर्ट टर्म फंड आणि अल्ट्रा शॉर्ट टर्म फंड.
3. जोखीम
डेट फंड मुळात व्याजदर जोखीम, क्रेडिट जोखीम आणितरलता धोका एकूण व्याजदराच्या हालचालींमुळे निधी मूल्यात चढ-उतार होऊ शकतात. जारीकर्त्याद्वारे व्याज आणि मुद्दल भरण्यात डिफॉल्ट होण्याचा धोका आहे. जेव्हा निधी व्यवस्थापक मागणीच्या अभावामुळे अंतर्निहित सुरक्षा विकू शकत नाही तेव्हा तरलतेचा धोका उद्भवतो.
4. खर्च
डेट फंड तुमचे पैसे व्यवस्थापित करण्यासाठी खर्चाचे प्रमाण आकारतात. आता पर्यंतसेबी खर्च गुणोत्तराची वरची मर्यादा 2.25% असणे अनिवार्य केले आहे (नियमानुसार वेळोवेळी बदलू शकते.).
5. गुंतवणूक होरायझन
लिक्विड फंडांसाठी 3 महिने ते 1 वर्षाची गुंतवणूक योग्य असेल. जर तुमच्याकडे 2 ते 3 वर्षांचा क्षितिज जास्त असेल, तर तुम्ही शॉर्ट टर्म बाँड फंडांसाठी जाऊ शकता.
6. आर्थिक उद्दिष्टे
अतिरिक्त उत्पन्न मिळवणे किंवा तरलतेच्या उद्देशाने विविध उद्दिष्टे साध्य करण्यासाठी डेट फंडाचा वापर केला जाऊ शकतो.
सर्वोत्तम डेट फंड्समध्ये ऑनलाइन गुंतवणूक कशी करावी?
Fincash.com वर आजीवन मोफत गुंतवणूक खाते उघडा.
तुमची नोंदणी आणि KYC प्रक्रिया पूर्ण करा
दस्तऐवज अपलोड करा (PAN, आधार इ.).आणि, तुम्ही गुंतवणूक करण्यास तयार आहात!
निष्कर्ष
डेट फंड हा तुमचा पैसा गुंतवण्याचा आणि तुमच्याशी जुळणारे संबंधित उत्पादन निवडून नियमितपणे उत्पन्न मिळवण्याचा सर्वोत्तम मार्ग आहे.जोखीम प्रोफाइल. त्यामुळे, स्थिर उत्पन्न मिळवू पाहणारे गुंतवणूकदार किंवा डेट मार्केटचा फायदा घेऊ पाहणारे, 2022 - 2023 साठी वरील सर्वोत्कृष्ट कर्ज निधीचा विचार करू शकतात आणि गुंतवणूक सुरू करू शकतात!_
येथे प्रदान केलेली माहिती अचूक असल्याची खात्री करण्यासाठी सर्व प्रयत्न केले गेले आहेत. तथापि, डेटाच्या अचूकतेबद्दल कोणतीही हमी दिली जात नाही. कृपया कोणतीही गुंतवणूक करण्यापूर्वी योजना माहिती दस्तऐवजासह सत्यापित करा.
You Might Also Like


AMFI Registration No. 112358 | CIN: U74999MH2016PTC282153
Shepard Technologies Pvt. Ltd. (with ARN code 112358) makes no warranties or representations, express or implied, on products offered through the platform. It accepts no liability for any damages or losses, however caused, in connection with the use of, or on the reliance of its product or related services. Terms and conditions of the website are applicable.
©2026 Shepard Technologies Private Limited. All Rights Reserved
The article is nice and informative but it could be in more simple words because lot of people have much less knowledge in such sector