गुंतवणुकीसाठी सर्वोत्तम इंडेक्स म्युच्युअल फंड 2022
इंडेक्स फंड म्युच्युअल फंड योजनांचा संदर्भ घ्या ज्यांचा पोर्टफोलिओ वापरून तयार केला जातोबाजार आधार म्हणून निर्देशांक. दुसऱ्या शब्दांत, इंडेक्स फंडाची कामगिरी विशिष्ट निर्देशांकाच्या कामगिरीवर अवलंबून असते. या योजना निष्क्रीयपणे व्यवस्थापित केल्या जातात. या फंडांमध्ये समभाग समान प्रमाणात असतात कारण ते विशिष्ट निर्देशांकात असतात.
भारतात, अनेक योजना निफ्टी किंवा सेन्सेक्स यांचा पोर्टफोलिओ तयार करण्यासाठी आधार म्हणून वापरतात. उदाहरणार्थ, जर निफ्टी पोर्टफोलिओमध्ये SBI चे शेअर्स असतील ज्यांचे प्रमाण १२% असेल तर; निफ्टी इंडेक्स फंडात 12% इक्विटी शेअर्स असतील.
ते निष्क्रीयपणे विशिष्ट निर्देशांकाच्या कामगिरीचा मागोवा घेतात. सक्रियपणे व्यवस्थापित फंडांच्या विपरीत, इंडेक्स फंड हे बाजाराला मागे टाकण्यासाठी नसतात, परंतु निर्देशांकाच्या कामगिरीची नक्कल करतात. जेव्हा एगुंतवणूकदार इंडेक्स फंडामध्ये गुंतवणूक करण्याची योजना आखत आहे, त्यांनी फंडाच्या ट्रॅकिंग त्रुटीकडे लक्ष दिले पाहिजे. ट्रॅकिंग एरर हे ट्रॅक करत असलेल्या बेंचमार्कमधून फंड रिटर्नचे विचलन मोजते. हा इंडेक्स फंडाचा परतावा आणि त्याचा बेंचमार्क परतावा यातील फरक आहे. ट्रॅकिंग एरर जितकी कमी तितकी फंडाची कामगिरी चांगली.
भारतात इंडेक्स फंडात गुंतवणूक का करावी?
काहीगुंतवणुकीचे फायदे इंडेक्स फंडांमध्ये हे आहेत:
1. विविधीकरण
इंडेक्स हा वेगवेगळ्या स्टॉक्स आणि सिक्युरिटीजचा संग्रह असतो. ते गुंतवणूकदारांना विविधीकरण देतात ज्याचा मुख्य हेतू आहेमालमत्ता वाटप. हे सुनिश्चित करते की गुंतवणूकदाराची सर्व अंडी एकाच टोपलीत नाहीत.
2. कमी खर्च
इतर म्युच्युअल फंड योजनांच्या तुलनेत इंडेक्स फंडाचा ऑपरेटिंग खर्च कमी असतो. याठिकाणी, फंड मॅनेजर्सकडे कंपन्यांचे सखोल संशोधन करण्यासाठी संशोधन विश्लेषकांची वेगळी टीम असण्याची गरज नाही, ज्यासाठी एक महत्त्वपूर्ण रक्कम खर्च केली जाते. इंडेक्स फंडांमध्ये, व्यवस्थापकाला फक्त निर्देशांकाची प्रतिकृती तयार करण्याची आवश्यकता असते. त्यामुळे इंडेक्स फंडाच्या बाबतीत खर्चाचे प्रमाण कमी असते.
3. कमी व्यवस्थापकीय प्रभाव
फंड फक्त विशिष्ट निर्देशांकाच्या हालचालीचे अनुसरण करत असल्याने, व्यवस्थापकाला कोणत्या स्टॉकमध्ये गुंतवणूक करायची हे निवडण्याची गरज नाही. व्यवस्थापकाची स्वतःची शैली असल्याने हा एक प्लस पॉइंट आहेगुंतवणूक (जे काही वेळा बाजाराशी सुसंगत नसते) मध्ये रेंगाळत नाही.
इंडेक्स म्युच्युअल फंडाचा प्रकार
सेन्सेक्स किंवा निफ्टीमधील कंपनीचे वेटेज हे तिच्या फ्रीवर अवलंबून असतेतरंगणे बाजार भांडवल. निर्देशांकाच्या एकूण बाजार भांडवलाची ही टक्केवारी आहे. तर, जर एखाद्या कंपनीचे बाजार भांडवल रु१ कोटी, तर इंडेक्सचे जर रु 200 कोटी असतील तर त्याच्या स्टॉकचे वेटेज 0.5% आहे.
1. सेन्सेक्स इंडेक्स फंड
हे इंडेक्स फंड बीएसई सेन्सेक्सचा बेचमार्क इंडेक्स म्हणून मागोवा घेतात आणि वर चर्चा केल्याप्रमाणे वेटेज लॉगिनवर आधारित बीएसई सेन्सेक्सवर 30 कंपन्यांमध्ये गुंतवणूक करतात. याम्युच्युअल फंडाचे प्रकार ETF चे समर्थन आहे (एक्सचेंज ट्रेडेड फंड) एक्स्चेंजवर व्यवहार केला.
2. निफ्टी इंडेक्स फंड
हे इंडेक्स फंड NSE NIFTY 50 ला बेकमार्क इंडेक्स म्हणून ट्रॅक करतात आणि वर चर्चा केल्याप्रमाणे वेटेज लॉगिनवर आधारित निफ्टी 50 वर 50 कंपन्यांमध्ये गुंतवणूक करतात. या प्रकारच्याम्युच्युअल फंड ETF च्या (Exchange Traded Funds) द्वारे समर्थित आहेत.
Talk to our investment specialist
3. निफ्टी ज्युनियर इंडेक्स फंड
हे इंडेक्स फंड NSE NIFTY Junior 50 ला बेचमार्क इंडेक्स म्हणून ट्रॅक करतात आणि वर चर्चा केल्याप्रमाणे वेटेज लॉगिनवर आधारित NSE NIFTY Junior 50 वर 50 कंपन्यांमध्ये गुंतवणूक करतात. या प्रकारच्या म्युच्युअल फंडांना ETF च्या (Exchange Traded Funds) द्वारे समर्थन दिले जाते.
आर्थिक वर्ष 22 - 23 मध्ये टॉप 9 सर्वोत्तम कामगिरी करणारे इंडेक्स फंड
Fund NAV Net Assets (Cr) 3 MO (%) 6 MO (%) 1 YR (%) 3 YR (%) 5 YR (%) 2025 (%) Nippon India Index Fund - Sensex Plan Growth ₹39.649
↑ 0.42 ₹894 0.5 -6.8 -6.3 6.6 8.8 9.8 LIC MF Index Fund Sensex Growth ₹145.162
↑ 1.54 ₹88 0.3 -7 -6.7 6 8.3 9.1 Franklin India Index Fund Nifty Plan Growth ₹196.122
↑ 2.00 ₹713 1.1 -5.4 -3.9 8.3 9.6 11.3 IDBI Nifty Index Fund Growth ₹36.2111
↓ -0.02 ₹208 9.1 11.9 16.2 20.3 11.7 Nippon India Index Fund - Nifty Plan Growth ₹41.2957
↑ 0.42 ₹3,662 1.1 -5.3 -3.8 8.5 9.6 11.4 ICICI Prudential Nifty Next 50 Index Fund Growth ₹63.5409
↑ 0.79 ₹9,242 6.9 5.7 5.7 18.2 13.2 2.1 IDBI Nifty Junior Index Fund Growth ₹53.8192
↑ 0.67 ₹106 7.3 6.1 6 18.1 13.2 2 LIC MF Index Fund Nifty Growth ₹133.767
↑ 1.36 ₹356 0.9 -5.6 -4.5 7.8 9.1 10.7 Bandhan Nifty Fund Growth ₹52.3043
↑ 0.53 ₹2,627 1.1 -5.4 -4.1 8.3 9.7 11.2 Note: Returns up to 1 year are on absolute basis & more than 1 year are on CAGR basis. as on 10 Jul 26 Research Highlights & Commentary of 9 Funds showcased
Commentary Nippon India Index Fund - Sensex Plan LIC MF Index Fund Sensex Franklin India Index Fund Nifty Plan IDBI Nifty Index Fund Nippon India Index Fund - Nifty Plan ICICI Prudential Nifty Next 50 Index Fund IDBI Nifty Junior Index Fund LIC MF Index Fund Nifty Bandhan Nifty Fund Point 1 Upper mid AUM (₹894 Cr). Bottom quartile AUM (₹88 Cr). Lower mid AUM (₹713 Cr). Bottom quartile AUM (₹208 Cr). Top quartile AUM (₹3,662 Cr). Highest AUM (₹9,242 Cr). Bottom quartile AUM (₹106 Cr). Lower mid AUM (₹356 Cr). Upper mid AUM (₹2,627 Cr). Point 2 Established history (15+ yrs). Established history (23+ yrs). Oldest track record among peers (25 yrs). Established history (16+ yrs). Established history (15+ yrs). Established history (16+ yrs). Established history (15+ yrs). Established history (23+ yrs). Established history (16+ yrs). Point 3 Rating: 2★ (upper mid). Rating: 1★ (lower mid). Rating: 1★ (lower mid). Rating: 1★ (bottom quartile). Rating: 1★ (bottom quartile). Top rated. Rating: 5★ (top quartile). Rating: 1★ (bottom quartile). Rating: 2★ (upper mid). Point 4 Risk profile: Moderately High. Risk profile: Moderately High. Risk profile: Moderately High. Risk profile: Moderately High. Risk profile: Moderately High. Risk profile: Moderately High. Risk profile: Moderately High. Risk profile: Moderately High. Risk profile: Moderately High. Point 5 5Y return: 8.81% (bottom quartile). 5Y return: 8.31% (bottom quartile). 5Y return: 9.60% (lower mid). 5Y return: 11.74% (upper mid). 5Y return: 9.57% (lower mid). 5Y return: 13.20% (top quartile). 5Y return: 13.18% (top quartile). 5Y return: 9.14% (bottom quartile). 5Y return: 9.66% (upper mid). Point 6 3Y return: 6.58% (bottom quartile). 3Y return: 5.99% (bottom quartile). 3Y return: 8.33% (lower mid). 3Y return: 20.28% (top quartile). 3Y return: 8.45% (upper mid). 3Y return: 18.17% (top quartile). 3Y return: 18.13% (upper mid). 3Y return: 7.82% (bottom quartile). 3Y return: 8.29% (lower mid). Point 7 1Y return: -6.25% (bottom quartile). 1Y return: -6.74% (bottom quartile). 1Y return: -3.95% (lower mid). 1Y return: 16.16% (top quartile). 1Y return: -3.85% (upper mid). 1Y return: 5.72% (upper mid). 1Y return: 6.04% (top quartile). 1Y return: -4.47% (bottom quartile). 1Y return: -4.06% (lower mid). Point 8 1M return: 5.12% (top quartile). 1M return: 5.07% (top quartile). 1M return: 4.56% (bottom quartile). 1M return: 3.68% (bottom quartile). 1M return: 4.58% (lower mid). 1M return: 4.58% (upper mid). 1M return: 5.05% (upper mid). 1M return: 4.51% (bottom quartile). 1M return: 4.56% (lower mid). Point 9 Alpha: -0.53 (top quartile). Alpha: -1.14 (bottom quartile). Alpha: -0.58 (upper mid). Alpha: -1.03 (bottom quartile). Alpha: -0.46 (top quartile). Alpha: -0.79 (lower mid). Alpha: -0.76 (lower mid). Alpha: -1.10 (bottom quartile). Alpha: -0.66 (upper mid). Point 10 Sharpe: -0.75 (bottom quartile). Sharpe: -0.79 (bottom quartile). Sharpe: -0.54 (lower mid). Sharpe: 1.04 (top quartile). Sharpe: -0.53 (upper mid). Sharpe: 0.15 (top quartile). Sharpe: 0.15 (upper mid). Sharpe: -0.57 (bottom quartile). Sharpe: -0.54 (lower mid). Nippon India Index Fund - Sensex Plan
LIC MF Index Fund Sensex
Franklin India Index Fund Nifty Plan
IDBI Nifty Index Fund
Nippon India Index Fund - Nifty Plan
ICICI Prudential Nifty Next 50 Index Fund
IDBI Nifty Junior Index Fund
LIC MF Index Fund Nifty
Bandhan Nifty Fund
*कमीत कमी असलेल्या इंडेक्स म्युच्युअल फंडांची यादी खाली दिली आहे15 कोटी किंवा निव्वळ मालमत्तेमध्ये अधिक.
The primary investment objective of the scheme is to replicate the composition of the Sensex, with a view to generate returns that are commensurate with the performance of the Sensex, subject to tracking errors. Research Highlights for Nippon India Index Fund - Sensex Plan Below is the key information for Nippon India Index Fund - Sensex Plan Returns up to 1 year are on The main investment objective of the fund is to generate returns commensurate with the performance of the index either Nifty / Sensex based on the plans by investing in the respective index stocks subject to tracking errors. Research Highlights for LIC MF Index Fund Sensex Below is the key information for LIC MF Index Fund Sensex Returns up to 1 year are on The Investment Objective of the Scheme is to invest in companies whose securities are included in the Nifty and subject to tracking errors, endeavouring to attain results commensurate with the Nifty 50 under NSENifty Plan Research Highlights for Franklin India Index Fund Nifty Plan Below is the key information for Franklin India Index Fund Nifty Plan Returns up to 1 year are on The investment objective of the scheme is to invest in the stocks and equity related instruments comprising the S&P CNX Nifty Index in the same weights as these stocks represented in the Index with the intent to replicate the performance of the Total Returns Index of S&P CNX Nifty index. The scheme will adopt a passive investment strategy and will seek to achieve the investment objective by minimizing the tracking error between the S&P CNX Nifty index (Total Returns Index) and the scheme. Research Highlights for IDBI Nifty Index Fund Below is the key information for IDBI Nifty Index Fund Returns up to 1 year are on The primary investment objective of the scheme is to replicate the composition of the Nifty 50, with a view to generate returns that are commensurate with the
performance of the Nifty 50, subject to tracking errors. Research Highlights for Nippon India Index Fund - Nifty Plan Below is the key information for Nippon India Index Fund - Nifty Plan Returns up to 1 year are on The fund's objective is to invest in companies whose securities are included in Nifty Junior Index and to endeavor to achieve the returns of the above index as closely as possible, though subject to tracking error. The fund intends to track only 90-95% of the Index i.e. it will always keep cash balance between 5-10% of the Net Asset to meet the redemption and other liquidity requirements. However, as and when the liquidity in the Index improves the fund intends to track up to 100% of the Index. The fund will not seek to outperform the CNX Nifty Junior. The objective is that the performance of the NAV of the fund should closely track the performance of the CNX Nifty Junior over the same period subject to tracking error. Research Highlights for ICICI Prudential Nifty Next 50 Index Fund Below is the key information for ICICI Prudential Nifty Next 50 Index Fund Returns up to 1 year are on The investment objective of the scheme is to invest in the stocks and equity related instruments comprising the CNX Nifty Junior Index in the same weights as these stocks represented in the Index with the intent to replicate the performance of the Total Returns Index of CNX Nifty Junior Index. The scheme will adopt a passive investment strategy and will seek to achieve the investment objective by minimizing the tracking error between the CNX Nifty Junior Index (Total Returns Index) and the scheme. Research Highlights for IDBI Nifty Junior Index Fund Below is the key information for IDBI Nifty Junior Index Fund Returns up to 1 year are on The main investment objective of the fund is to generate returns commensurate with the performance of the index either Nifty / Sensex based on the plans by investing in the respective index stocks subject to tracking errors. Research Highlights for LIC MF Index Fund Nifty Below is the key information for LIC MF Index Fund Nifty Returns up to 1 year are on The investment objective of the scheme is to replicate the Nifty 50 by investing in securities of the Nifty 50 in the same proportion / weightage. However, there is no assurance or guarantee that the objectives of the scheme will be realized
and the scheme does not assure or guarantee any returns . Research Highlights for Bandhan Nifty Fund Below is the key information for Bandhan Nifty Fund Returns up to 1 year are on 1. Nippon India Index Fund - Sensex Plan
Nippon India Index Fund - Sensex Plan
Growth Launch Date 28 Sep 10 NAV (10 Jul 26) ₹39.649 ↑ 0.42 (1.08 %) Net Assets (Cr) ₹894 on 31 May 26 Category Others - Index Fund AMC Nippon Life Asset Management Ltd. Rating ☆☆ Risk Moderately High Expense Ratio 0.49 Sharpe Ratio -0.75 Information Ratio -10.31 Alpha Ratio -0.53 Min Investment 5,000 Min SIP Investment 100 Exit Load 0-7 Days (0.25%),7 Days and above(NIL) Growth of 10,000 investment over the years.
Date Value 30 Jun 21 ₹10,000 30 Jun 22 ₹10,171 30 Jun 23 ₹12,464 30 Jun 24 ₹15,326 30 Jun 25 ₹16,320 30 Jun 26 ₹15,012 Returns for Nippon India Index Fund - Sensex Plan
absolute basis & more than 1 year are on CAGR (Compound Annual Growth Rate) basis. as on 10 Jul 26 Duration Returns 1 Month 5.1% 3 Month 0.5% 6 Month -6.8% 1 Year -6.3% 3 Year 6.6% 5 Year 8.8% 10 Year 15 Year Since launch 9.1% Historical performance (Yearly) on absolute basis
Year Returns 2025 9.8% 2024 8.9% 2023 19.5% 2022 5% 2021 22.4% 2020 16.6% 2019 14.2% 2018 6.2% 2017 27.9% 2016 2% Fund Manager information for Nippon India Index Fund - Sensex Plan
Name Since Tenure Himanshu Mange 23 Dec 23 2.52 Yr. Data below for Nippon India Index Fund - Sensex Plan as on 31 May 26
Asset Allocation
Asset Class Value Cash 0.27% Equity 99.73% Top Securities Holdings / Portfolio
Name Holding Value Quantity HDFC Bank Ltd (Financial Services)
Equity, Since 31 Oct 10 | 50018013% ₹114 Cr 1,537,021
↑ 3,637 ICICI Bank Ltd (Financial Services)
Equity, Since 31 Oct 10 | 53217410% ₹91 Cr 722,048
↑ 1,708 Reliance Industries Ltd (Energy)
Equity, Since 31 Oct 10 | 50032510% ₹90 Cr 682,564
↑ 1,615 Bharti Airtel Ltd (Communication Services)
Equity, Since 31 Oct 10 | 5324546% ₹53 Cr 287,608
↑ 680 Larsen & Toubro Ltd (Industrials)
Equity, Since 29 Feb 12 | 5005105% ₹48 Cr 117,953
↑ 279 Infosys Ltd (Technology)
Equity, Since 31 Oct 10 | 5002095% ₹41 Cr 351,825
↑ 832 State Bank of India (Financial Services)
Equity, Since 31 Oct 10 | 5001125% ₹40 Cr 419,024
↑ 991 Axis Bank Ltd (Financial Services)
Equity, Since 31 Dec 13 | 5322154% ₹37 Cr 288,348
↑ 682 Kotak Mahindra Bank Ltd (Financial Services)
Equity, Since 30 Jun 17 | 5002473% ₹29 Cr 742,489
↑ 1,756 ITC Ltd (Consumer Defensive)
Equity, Since 29 Feb 12 | 5008753% ₹28 Cr 973,220
↑ 2,302 2. LIC MF Index Fund Sensex
LIC MF Index Fund Sensex
Growth Launch Date 14 Nov 02 NAV (10 Jul 26) ₹145.162 ↑ 1.54 (1.07 %) Net Assets (Cr) ₹88 on 31 May 26 Category Others - Index Fund AMC LIC Mutual Fund Asset Mgmt Co Ltd Rating ☆ Risk Moderately High Expense Ratio 0.98 Sharpe Ratio -0.79 Information Ratio -10.4 Alpha Ratio -1.14 Min Investment 5,000 Min SIP Investment 1,000 Exit Load 0-1 Months (1%),1 Months and above(NIL) Growth of 10,000 investment over the years.
Date Value 30 Jun 21 ₹10,000 30 Jun 22 ₹10,116 30 Jun 23 ₹12,384 30 Jun 24 ₹15,150 30 Jun 25 ₹16,034 30 Jun 26 ₹14,674 Returns for LIC MF Index Fund Sensex
absolute basis & more than 1 year are on CAGR (Compound Annual Growth Rate) basis. as on 10 Jul 26 Duration Returns 1 Month 5.1% 3 Month 0.3% 6 Month -7% 1 Year -6.7% 3 Year 6% 5 Year 8.3% 10 Year 15 Year Since launch 12.4% Historical performance (Yearly) on absolute basis
Year Returns 2025 9.1% 2024 8.2% 2023 19% 2022 4.6% 2021 21.9% 2020 15.9% 2019 14.6% 2018 5.6% 2017 27.4% 2016 1.6% Fund Manager information for LIC MF Index Fund Sensex
Name Since Tenure Nikhil Kapoor 7 Apr 26 0.23 Yr. Data below for LIC MF Index Fund Sensex as on 31 May 26
Asset Allocation
Asset Class Value Cash 0.36% Equity 99.64% Top Securities Holdings / Portfolio
Name Holding Value Quantity HDFC Bank Ltd (Financial Services)
Equity, Since 31 Mar 09 | 50018013% ₹11 Cr 151,997
↓ -235 ICICI Bank Ltd (Financial Services)
Equity, Since 30 Apr 09 | 53217410% ₹9 Cr 71,275
↓ -286 Reliance Industries Ltd (Energy)
Equity, Since 31 Mar 09 | 50032510% ₹9 Cr 67,436
↓ -271 Bharti Airtel Ltd (Communication Services)
Equity, Since 30 Apr 09 | 5324546% ₹5 Cr 28,348
↓ -113 Larsen & Toubro Ltd (Industrials)
Equity, Since 31 Mar 09 | 5005105% ₹5 Cr 11,642
↓ -46 Infosys Ltd (Technology)
Equity, Since 31 Mar 09 | 5002095% ₹4 Cr 34,713
↓ -139 State Bank of India (Financial Services)
Equity, Since 31 Mar 09 | 5001125% ₹4 Cr 41,357
↓ -166 Axis Bank Ltd (Financial Services)
Equity, Since 31 Dec 13 | 5322154% ₹4 Cr 28,461
↑ 17 Kotak Mahindra Bank Ltd (Financial Services)
Equity, Since 30 Jun 17 | 5002473% ₹3 Cr 73,400
↑ 202 ITC Ltd (Consumer Defensive)
Equity, Since 30 Sep 11 | 5008753% ₹3 Cr 95,862
↓ -385 3. Franklin India Index Fund Nifty Plan
Franklin India Index Fund Nifty Plan
Growth Launch Date 4 Aug 00 NAV (10 Jul 26) ₹196.122 ↑ 2.00 (1.03 %) Net Assets (Cr) ₹713 on 31 May 26 Category Others - Index Fund AMC Franklin Templeton Asst Mgmt(IND)Pvt Ltd Rating ☆ Risk Moderately High Expense Ratio 0.63 Sharpe Ratio -0.54 Information Ratio -3.4 Alpha Ratio -0.58 Min Investment 5,000 Min SIP Investment 500 Exit Load 0-30 Days (1%),30 Days and above(NIL) Growth of 10,000 investment over the years.
Date Value 30 Jun 21 ₹10,000 30 Jun 22 ₹10,092 30 Jun 23 ₹12,307 30 Jun 24 ₹15,457 30 Jun 25 ₹16,532 30 Jun 26 ₹15,553 Returns for Franklin India Index Fund Nifty Plan
absolute basis & more than 1 year are on CAGR (Compound Annual Growth Rate) basis. as on 10 Jul 26 Duration Returns 1 Month 4.6% 3 Month 1.1% 6 Month -5.4% 1 Year -3.9% 3 Year 8.3% 5 Year 9.6% 10 Year 15 Year Since launch 12.2% Historical performance (Yearly) on absolute basis
Year Returns 2025 11.3% 2024 9.5% 2023 20.2% 2022 4.9% 2021 24.3% 2020 14.7% 2019 12% 2018 3.2% 2017 28.3% 2016 3.3% Fund Manager information for Franklin India Index Fund Nifty Plan
Name Since Tenure Sandeep Manam 18 Oct 21 4.7 Yr. Shyam Sriram 26 Sep 24 1.76 Yr. Data below for Franklin India Index Fund Nifty Plan as on 31 May 26
Asset Allocation
Asset Class Value Cash 0.6% Equity 99.4% Top Securities Holdings / Portfolio
Name Holding Value Quantity HDFC Bank Ltd (Financial Services)
Equity, Since 31 Jan 03 | HDFCBANK10% ₹75 Cr 1,004,869
↓ -2,666 ICICI Bank Ltd (Financial Services)
Equity, Since 31 Jan 10 | ICICIBANK8% ₹59 Cr 469,406
↑ 2,383 Reliance Industries Ltd (Energy)
Equity, Since 31 Jan 03 | RELIANCE8% ₹59 Cr 443,481
↓ -12,887 Bharti Airtel Ltd (Communication Services)
Equity, Since 31 Mar 04 | BHARTIARTL5% ₹37 Cr 201,531
↓ -5,063 Larsen & Toubro Ltd (Industrials)
Equity, Since 30 Jun 12 | LT4% ₹31 Cr 77,091
↓ -615 Infosys Ltd (Technology)
Equity, Since 29 Feb 12 | INFY4% ₹27 Cr 230,206
↑ 874 State Bank of India (Financial Services)
Equity, Since 31 Jan 03 | SBIN4% ₹26 Cr 272,466
↑ 1,842 Axis Bank Ltd (Financial Services)
Equity, Since 30 Jun 09 | AXISBANK3% ₹24 Cr 188,390
↑ 2,818 Kotak Mahindra Bank Ltd (Financial Services)
Equity, Since 31 Mar 12 | KOTAKBANK3% ₹19 Cr 483,381
↓ -7,265 ITC Ltd (Consumer Defensive)
Equity, Since 31 Mar 11 | ITC3% ₹18 Cr 632,841
↓ -8,822 4. IDBI Nifty Index Fund
IDBI Nifty Index Fund
Growth Launch Date 25 Jun 10 NAV (28 Jul 23) ₹36.2111 ↓ -0.02 (-0.06 %) Net Assets (Cr) ₹208 on 30 Jun 23 Category Others - Index Fund AMC IDBI Asset Management Limited Rating ☆ Risk Moderately High Expense Ratio 0.9 Sharpe Ratio 1.04 Information Ratio -3.93 Alpha Ratio -1.03 Min Investment 5,000 Min SIP Investment 500 Exit Load NIL Growth of 10,000 investment over the years.
Date Value 30 Jun 21 ₹10,000 30 Jun 22 ₹10,081 30 Jun 23 ₹12,264 Returns for IDBI Nifty Index Fund
absolute basis & more than 1 year are on CAGR (Compound Annual Growth Rate) basis. as on 10 Jul 26 Duration Returns 1 Month 3.7% 3 Month 9.1% 6 Month 11.9% 1 Year 16.2% 3 Year 20.3% 5 Year 11.7% 10 Year 15 Year Since launch 10.3% Historical performance (Yearly) on absolute basis
Year Returns 2025 2024 2023 2022 2021 2020 2019 2018 2017 2016 Fund Manager information for IDBI Nifty Index Fund
Name Since Tenure Data below for IDBI Nifty Index Fund as on 30 Jun 23
Asset Allocation
Asset Class Value Top Securities Holdings / Portfolio
Name Holding Value Quantity 5. Nippon India Index Fund - Nifty Plan
Nippon India Index Fund - Nifty Plan
Growth Launch Date 28 Sep 10 NAV (10 Jul 26) ₹41.2957 ↑ 0.42 (1.03 %) Net Assets (Cr) ₹3,662 on 31 May 26 Category Others - Index Fund AMC Nippon Life Asset Management Ltd. Rating ☆ Risk Moderately High Expense Ratio 0.49 Sharpe Ratio -0.53 Information Ratio -10.13 Alpha Ratio -0.46 Min Investment 5,000 Min SIP Investment 100 Exit Load 0-7 Days (0.25%),7 Days and above(NIL) Growth of 10,000 investment over the years.
Date Value 30 Jun 21 ₹10,000 30 Jun 22 ₹10,045 30 Jun 23 ₹12,253 30 Jun 24 ₹15,420 30 Jun 25 ₹16,495 30 Jun 26 ₹15,534 Returns for Nippon India Index Fund - Nifty Plan
absolute basis & more than 1 year are on CAGR (Compound Annual Growth Rate) basis. as on 10 Jul 26 Duration Returns 1 Month 4.6% 3 Month 1.1% 6 Month -5.3% 1 Year -3.8% 3 Year 8.5% 5 Year 9.6% 10 Year 15 Year Since launch 9.4% Historical performance (Yearly) on absolute basis
Year Returns 2025 11.4% 2024 9.4% 2023 20.5% 2022 4.6% 2021 24% 2020 14.3% 2019 12.3% 2018 3.5% 2017 29% 2016 2.5% Fund Manager information for Nippon India Index Fund - Nifty Plan
Name Since Tenure Himanshu Mange 23 Dec 23 2.52 Yr. Data below for Nippon India Index Fund - Nifty Plan as on 31 May 26
Asset Allocation
Asset Class Value Cash 0.26% Equity 99.74% Top Securities Holdings / Portfolio
Name Holding Value Quantity HDFC Bank Ltd (Financial Services)
Equity, Since 31 Oct 10 | HDFCBANK11% ₹386 Cr 5,180,098
↑ 79,336 ICICI Bank Ltd (Financial Services)
Equity, Since 31 Oct 10 | ICICIBANK8% ₹304 Cr 2,419,785
↑ 37,060 Reliance Industries Ltd (Energy)
Equity, Since 31 Oct 10 | RELIANCE8% ₹302 Cr 2,286,145
↑ 35,014 Bharti Airtel Ltd (Communication Services)
Equity, Since 31 Oct 10 | BHARTIARTL5% ₹190 Cr 1,038,893
↑ 15,911 Larsen & Toubro Ltd (Industrials)
Equity, Since 29 Feb 12 | LT4% ₹162 Cr 397,403
↑ 6,086 Infosys Ltd (Technology)
Equity, Since 31 Oct 10 | INFY4% ₹138 Cr 1,186,712
↑ 18,175 State Bank of India (Financial Services)
Equity, Since 31 Oct 10 | SBIN4% ₹135 Cr 1,404,563
↑ 21,511 Axis Bank Ltd (Financial Services)
Equity, Since 31 Oct 10 | AXISBANK3% ₹125 Cr 971,148
↑ 14,874 Kotak Mahindra Bank Ltd (Financial Services)
Equity, Since 31 Aug 11 | KOTAKBANK3% ₹96 Cr 2,491,826
↑ 38,163 ITC Ltd (Consumer Defensive)
Equity, Since 29 Feb 12 | ITC3% ₹94 Cr 3,262,294
↑ 49,963 6. ICICI Prudential Nifty Next 50 Index Fund
ICICI Prudential Nifty Next 50 Index Fund
Growth Launch Date 25 Jun 10 NAV (10 Jul 26) ₹63.5409 ↑ 0.79 (1.26 %) Net Assets (Cr) ₹9,242 on 31 May 26 Category Others - Index Fund AMC ICICI Prudential Asset Management Company Limited Rating ☆☆☆☆☆ Risk Moderately High Expense Ratio 0.66 Sharpe Ratio 0.15 Information Ratio -6.85 Alpha Ratio -0.79 Min Investment 5,000 Min SIP Investment 100 Exit Load 0-7 Days (0.25%),7 Days and above(NIL) Growth of 10,000 investment over the years.
Date Value 30 Jun 21 ₹10,000 30 Jun 22 ₹9,510 30 Jun 23 ₹11,382 30 Jun 24 ₹18,604 30 Jun 25 ₹17,902 30 Jun 26 ₹18,597 Returns for ICICI Prudential Nifty Next 50 Index Fund
absolute basis & more than 1 year are on CAGR (Compound Annual Growth Rate) basis. as on 10 Jul 26 Duration Returns 1 Month 4.6% 3 Month 6.9% 6 Month 5.7% 1 Year 5.7% 3 Year 18.2% 5 Year 13.2% 10 Year 15 Year Since launch 12.2% Historical performance (Yearly) on absolute basis
Year Returns 2025 2.1% 2024 27.2% 2023 26.3% 2022 0.1% 2021 29.5% 2020 14.3% 2019 0.6% 2018 -8.8% 2017 45.7% 2016 7.6% Fund Manager information for ICICI Prudential Nifty Next 50 Index Fund
Name Since Tenure Nishit Patel 18 Jan 21 5.45 Yr. Ajaykumar Solanki 1 Feb 24 2.41 Yr. Ashwini Bharucha 18 Dec 24 1.53 Yr. Venus Ahuja 1 Nov 25 0.66 Yr. Data below for ICICI Prudential Nifty Next 50 Index Fund as on 31 May 26
Asset Allocation
Asset Class Value Cash 0.07% Equity 99.93% Top Securities Holdings / Portfolio
Name Holding Value Quantity Adani Power Ltd (Utilities)
Equity, Since 31 Mar 24 | ADANIPOWER4% ₹369 Cr 15,181,411
↑ 272,205 Divi's Laboratories Ltd (Healthcare)
Equity, Since 30 Sep 24 | DIVISLAB3% ₹311 Cr 466,418
↑ 8,355 Hindustan Aeronautics Ltd Ordinary Shares (Industrials)
Equity, Since 30 Sep 22 | HAL3% ₹300 Cr 696,353
↑ 12,477 Cummins India Ltd (Industrials)
Equity, Since 31 Mar 26 | CUMMINSIND3% ₹292 Cr 495,784
↑ 8,881 Tata Motors Ltd (Consumer Cyclical)
Equity, Since 31 Mar 26 | TMCV3% ₹291 Cr 7,671,014
↑ 137,540 TVS Motor Co Ltd (Consumer Cyclical)
Equity, Since 30 Sep 23 | TVSMOTOR3% ₹289 Cr 861,974
↑ 15,450 Varun Beverages Ltd (Consumer Defensive)
Equity, Since 31 Mar 23 | VBL3% ₹265 Cr 5,023,317
↑ 90,063 Tata Power Co Ltd (Utilities)
Equity, Since 31 Aug 22 | TATAPOWER3% ₹259 Cr 6,144,616
↑ 110,170 Cholamandalam Investment and Finance Co Ltd (Financial Services)
Equity, Since 30 Sep 21 | CHOLAFIN3% ₹242 Cr 1,571,915
↑ 28,179 Samvardhana Motherson International Ltd (Consumer Cyclical)
Equity, Since 30 Sep 22 | MOTHERSON3% ₹237 Cr 16,244,413
↑ 291,267 7. IDBI Nifty Junior Index Fund
IDBI Nifty Junior Index Fund
Growth Launch Date 20 Sep 10 NAV (10 Jul 26) ₹53.8192 ↑ 0.67 (1.26 %) Net Assets (Cr) ₹106 on 31 May 26 Category Others - Index Fund AMC IDBI Asset Management Limited Rating ☆☆☆☆☆ Risk Moderately High Expense Ratio 0.86 Sharpe Ratio 0.15 Information Ratio -6.97 Alpha Ratio -0.76 Min Investment 5,000 Min SIP Investment 500 Exit Load NIL Growth of 10,000 investment over the years.
Date Value 30 Jun 21 ₹10,000 30 Jun 22 ₹9,521 30 Jun 23 ₹11,387 30 Jun 24 ₹18,511 30 Jun 25 ₹17,834 30 Jun 26 ₹18,584 Returns for IDBI Nifty Junior Index Fund
absolute basis & more than 1 year are on CAGR (Compound Annual Growth Rate) basis. as on 10 Jul 26 Duration Returns 1 Month 5% 3 Month 7.3% 6 Month 6.1% 1 Year 6% 3 Year 18.1% 5 Year 13.2% 10 Year 15 Year Since launch 11.2% Historical performance (Yearly) on absolute basis
Year Returns 2025 2% 2024 26.9% 2023 25.7% 2022 0.4% 2021 29.6% 2020 13.7% 2019 0.5% 2018 -9.3% 2017 43.6% 2016 6.9% Fund Manager information for IDBI Nifty Junior Index Fund
Name Since Tenure Nikhil Kapoor 7 Apr 26 0.23 Yr. Data below for IDBI Nifty Junior Index Fund as on 31 May 26
Asset Allocation
Asset Class Value Cash 0.35% Equity 99.65% Top Securities Holdings / Portfolio
Name Holding Value Quantity Adani Power Ltd (Utilities)
Equity, Since 31 Mar 24 | ADANIPOWER4% ₹4 Cr 174,021 Divi's Laboratories Ltd (Healthcare)
Equity, Since 30 Sep 24 | DIVISLAB3% ₹4 Cr 5,345 Hindustan Aeronautics Ltd Ordinary Shares (Industrials)
Equity, Since 30 Sep 22 | HAL3% ₹3 Cr 7,973 Cummins India Ltd (Industrials)
Equity, Since 31 Mar 26 | CUMMINSIND3% ₹3 Cr 5,713
↑ 594 TVS Motor Co Ltd (Consumer Cyclical)
Equity, Since 30 Sep 23 | TVSMOTOR3% ₹3 Cr 9,868 Tata Motors Ltd (Consumer Cyclical)
Equity, Since 31 Mar 26 | TMCV3% ₹3 Cr 86,902 Varun Beverages Ltd (Consumer Defensive)
Equity, Since 31 Mar 23 | VBL3% ₹3 Cr 57,515 Tata Power Co Ltd (Utilities)
Equity, Since 31 Aug 22 | TATAPOWER3% ₹3 Cr 70,407 Cholamandalam Investment and Finance Co Ltd (Financial Services)
Equity, Since 30 Sep 21 | CHOLAFIN3% ₹3 Cr 17,996 Samvardhana Motherson International Ltd (Consumer Cyclical)
Equity, Since 30 Sep 22 | MOTHERSON3% ₹3 Cr 185,953 8. LIC MF Index Fund Nifty
LIC MF Index Fund Nifty
Growth Launch Date 14 Nov 02 NAV (10 Jul 26) ₹133.767 ↑ 1.36 (1.03 %) Net Assets (Cr) ₹356 on 31 May 26 Category Others - Index Fund AMC LIC Mutual Fund Asset Mgmt Co Ltd Rating ☆ Risk Moderately High Expense Ratio 0.94 Sharpe Ratio -0.57 Information Ratio -16.8 Alpha Ratio -1.1 Min Investment 5,000 Min SIP Investment 1,000 Exit Load 0-1 Months (1%),1 Months and above(NIL) Growth of 10,000 investment over the years.
Date Value 30 Jun 21 ₹10,000 30 Jun 22 ₹10,054 30 Jun 23 ₹12,230 30 Jun 24 ₹15,306 30 Jun 25 ₹16,282 30 Jun 26 ₹15,236 Returns for LIC MF Index Fund Nifty
absolute basis & more than 1 year are on CAGR (Compound Annual Growth Rate) basis. as on 10 Jul 26 Duration Returns 1 Month 4.5% 3 Month 0.9% 6 Month -5.6% 1 Year -4.5% 3 Year 7.8% 5 Year 9.1% 10 Year 15 Year Since launch 12% Historical performance (Yearly) on absolute basis
Year Returns 2025 10.7% 2024 8.8% 2023 19.8% 2022 4.7% 2021 23.8% 2020 14.7% 2019 12.6% 2018 2.6% 2017 28.6% 2016 2.7% Fund Manager information for LIC MF Index Fund Nifty
Name Since Tenure Nikhil Kapoor 7 Apr 26 0.23 Yr. Data below for LIC MF Index Fund Nifty as on 31 May 26
Asset Allocation
Asset Class Value Cash 0.6% Equity 99.4% Top Securities Holdings / Portfolio
Name Holding Value Quantity HDFC Bank Ltd (Financial Services)
Equity, Since 30 Apr 09 | HDFCBANK10% ₹37 Cr 501,238
↑ 798 ICICI Bank Ltd (Financial Services)
Equity, Since 30 Apr 09 | ICICIBANK8% ₹29 Cr 234,183 Reliance Industries Ltd (Energy)
Equity, Since 31 Mar 12 | RELIANCE8% ₹29 Cr 221,418 Bharti Airtel Ltd (Communication Services)
Equity, Since 30 Apr 09 | BHARTIARTL5% ₹18 Cr 100,622 Larsen & Toubro Ltd (Industrials)
Equity, Since 30 Apr 09 | LT4% ₹16 Cr 38,533
↑ 172 Infosys Ltd (Technology)
Equity, Since 31 Jan 03 | INFY4% ₹13 Cr 114,791 State Bank of India (Financial Services)
Equity, Since 30 Apr 09 | SBIN4% ₹13 Cr 135,980
↑ 369 Axis Bank Ltd (Financial Services)
Equity, Since 31 Mar 09 | AXISBANK3% ₹12 Cr 94,227
↑ 595 Kotak Mahindra Bank Ltd (Financial Services)
Equity, Since 30 Apr 10 | KOTAKBANK3% ₹9 Cr 240,440 ITC Ltd (Consumer Defensive)
Equity, Since 31 Jan 03 | ITC3% ₹9 Cr 314,792 9. Bandhan Nifty Fund
Bandhan Nifty Fund
Growth Launch Date 30 Apr 10 NAV (10 Jul 26) ₹52.3043 ↑ 0.53 (1.03 %) Net Assets (Cr) ₹2,627 on 31 May 26 Category Others - Index Fund AMC IDFC Asset Management Company Limited Rating ☆☆ Risk Moderately High Expense Ratio 0.6 Sharpe Ratio -0.54 Information Ratio -11.8 Alpha Ratio -0.66 Min Investment 100 Min SIP Investment 1,000 Exit Load 0-7 Days (1%),7 Days and above(NIL) Growth of 10,000 investment over the years.
Date Value 30 Jun 21 ₹10,000 30 Jun 22 ₹10,119 30 Jun 23 ₹12,357 30 Jun 24 ₹15,552 30 Jun 25 ₹16,597 30 Jun 26 ₹15,596 Returns for Bandhan Nifty Fund
absolute basis & more than 1 year are on CAGR (Compound Annual Growth Rate) basis. as on 10 Jul 26 Duration Returns 1 Month 4.6% 3 Month 1.1% 6 Month -5.4% 1 Year -4.1% 3 Year 8.3% 5 Year 9.7% 10 Year 15 Year Since launch 10.8% Historical performance (Yearly) on absolute basis
Year Returns 2025 11.2% 2024 9.2% 2023 20.5% 2022 5.4% 2021 24.4% 2020 16.2% 2019 12.9% 2018 4.4% 2017 29.5% 2016 3.9% Fund Manager information for Bandhan Nifty Fund
Name Since Tenure Abhishek Jain 8 Mar 25 1.31 Yr. Mayuresh Nagvekar 17 Feb 26 0.36 Yr. Data below for Bandhan Nifty Fund as on 31 May 26
Asset Allocation
Asset Class Value Cash 0.21% Equity 99.79% Top Securities Holdings / Portfolio
Name Holding Value Quantity HDFC Bank Ltd (Financial Services)
Equity, Since 30 Apr 10 | HDFCBANK11% ₹277 Cr 3,717,009
↑ 27,059 ICICI Bank Ltd (Financial Services)
Equity, Since 30 Apr 10 | ICICIBANK8% ₹218 Cr 1,736,331
↑ 12,640 Reliance Industries Ltd (Energy)
Equity, Since 30 Apr 10 | RELIANCE8% ₹217 Cr 1,640,437
↑ 11,943 Bharti Airtel Ltd (Communication Services)
Equity, Since 30 Apr 10 | BHARTIARTL5% ₹136 Cr 745,464
↑ 5,427 Larsen & Toubro Ltd (Industrials)
Equity, Since 29 Feb 12 | LT4% ₹116 Cr 285,159
↑ 2,076 Infosys Ltd (Technology)
Equity, Since 30 Apr 10 | INFY4% ₹99 Cr 851,532
↑ 6,199 State Bank of India (Financial Services)
Equity, Since 31 Aug 11 | SBIN4% ₹97 Cr 1,007,852
↑ 7,337 Axis Bank Ltd (Financial Services)
Equity, Since 30 Apr 10 | AXISBANK3% ₹90 Cr 696,853
↑ 5,073 Kotak Mahindra Bank Ltd (Financial Services)
Equity, Since 31 Mar 12 | KOTAKBANK3% ₹69 Cr 1,788,024
↑ 13,016 ITC Ltd (Consumer Defensive)
Equity, Since 29 Feb 12 | ITC3% ₹67 Cr 2,340,878
↑ 17,041
निष्क्रिय इंडेक्स फंड चांगले का आहेत?
असोसिएशन ऑफ म्युच्युअल फंड इन इंडिया (AMFI) ने सांगितले की इंडेक्स फंडांनी एयूएम गोळा केलेरु. 7717 कोटी नोव्हेंबर 2019 रोजी. निष्क्रिय लार्ज-कॅप ईटीएफ सक्रियपणे व्यवस्थापित केलेल्या तुलनेत 11.53% परतावा देतातलार्ज कॅप फंड ज्याने 10.19% ऑफर केले.
सोने ETFs वर उभा राहिलारु. 5,540.40 कोटी नोव्हेंबर 2019 पर्यंत. हे रु.च्या तुलनेत येते. डिसेंबर 2018 मध्ये 4,571 कोटी. इतर ETF चे AUM रु. होते. रु.च्या तुलनेत 1,63,923.66 कोटी. 2018 च्या अखेरीस 1,07,363 कोटी.
लार्ज कॅप ईटीएफ
2019 च्या मोठ्या भागाने लार्ज-कॅप योजना रिटर्न चार्टच्या शीर्षस्थानी असल्याचे साक्षीदार आहे. 2020 मध्येही, टॉप 15 लार्ज-कॅप योजनांपैकी नऊ योजना आहेतनिष्क्रिय निधी.
पॅसिव्ह फंड्स - कोरोनाव्हायरस साथीच्या आजारामध्ये सुरक्षित स्वर्ग
जगभरातील सध्याच्या परिस्थितीमुळे, वित्तीय बाजारांना गंभीर चिंतेच्या समस्यांचा सामना करावा लागत आहे. भूतकाळात गुंतवणूकदार जोखीम पत्करण्यास तयार होते, परंतु आजच्या परिस्थितीमुळे बहुसंख्य गुंतवणूकदारांना धोका पत्करावा लागला आहे.सुरक्षित आश्रयस्थान. याचा अर्थ ते अशा गुंतवणुकीच्या शोधात आहेत ज्यातून जास्त परतावा मिळेल किंवा किमान स्थिर परतावा मिळेल.
अनेक गुंतवणूकदार आता एक्स्चेंज-ट्रेडेड फंड किंवा इंडेक्स फंड यासारख्या निष्क्रिय पद्धतींद्वारे गुंतवणूक करण्याचा विचार करत आहेत. AMFI नुसार, इंडेक्स फंडातील आवक सार्वकालिक उच्चांकाचा सामना करत आहेरु. 2076.5 कोटी मार्च 2020 मध्ये.
निष्क्रिय निधी विरुद्ध सक्रिय निधी
ते ज्या प्रकारे कार्य करतात आणि गुंतवणूकदारावर परिणाम करतात त्यामध्ये विशिष्ट फरक आहेत.
टॅब्युलर निष्क्रिय निधी आणि सक्रिय निधीमध्ये फरक करते:
| निष्क्रिय निधी | सक्रिय निधी |
|---|---|
| त्यांच्याकडे निधी व्यवस्थापकांचा सक्रिय सहभाग नाही | बाजारातील कामगिरीच्या आधारे विविध सिक्युरिटीजमधील निधी निवडण्यासाठी फंड व्यवस्थापक बरेच उद्योग संशोधन करतात आणि त्यानुसार पावले उचलतात. |
| कमी खर्चिक | गुंतवणुकीसाठी एखादे काम ठेवले जात असल्याने ते महाग असू शकते |
| कमी खर्चाचे प्रमाण असल्यामुळे लोकप्रिय | उच्च खर्च गुणोत्तरामुळे कमी लोकप्रिय असू शकते |
इंडेक्स फंडातील गुंतवणुकीचे धोके
इंडेक्स म्युच्युअल फंडांची लवचिकता नाही
एक मोठा तोटा म्हणजे लवचिकता नसणे. फंड फक्त निर्देशांकाचा मागोवा घेत असल्याने, ते उच्च परतावा मिळवण्याची संधी गमावू शकतात जी बाजारातील विसंगती आणि निर्देशांकाशी संबंधित नसलेल्या आश्चर्यांमुळे उद्भवू शकतात. सामान्यतः, मूल्य समभागांना निर्देशांकाचा भाग बनणे फार कठीण जाते.
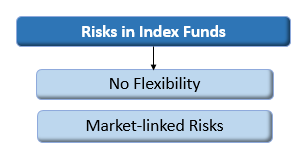
इंडेक्स म्युच्युअल फंडावरील बाजारातील जोखीम
त्यांचा बाजाराशी थेट संबंध आहे. म्हणून, जेव्हा शेअर बाजार एकंदरीत घसरतो, तेव्हा इंडेक्स म्युच्युअल फंडाचे मूल्यही कमी होते.
काही तोटे असूनही, ज्या गुंतवणूकदारांना गुंतवणूक करायची आहे त्यांच्यासाठी टॉप इंडेक्स फंड फायदेशीर ठरू शकतात.इक्विटी कमीतकमी जोखमीसहघटक. तज्ञांच्या म्हणण्यानुसार, गुंतवणूकदारांना त्यांच्या गुंतवणुकीचा सर्वोत्तम फायदा घेण्यासाठी त्यांच्या गुंतवणूक पोर्टफोलिओमध्ये 5-6% इंडेक्स फंड समाविष्ट करण्याची सूचना केली जाते.
इंडेक्स म्युच्युअल फंडात ऑनलाइन गुंतवणूक कशी करावी?
Fincash.com वर आजीवन मोफत गुंतवणूक खाते उघडा.
तुमची नोंदणी आणि KYC प्रक्रिया पूर्ण करा
दस्तऐवज अपलोड करा (PAN, आधार इ.).आणि, तुम्ही गुंतवणूक करण्यास तयार आहात!
वारंवार विचारले जाणारे प्रश्न
1. तुम्ही इंडेक्स म्युच्युअल फंडात गुंतवणूक का करावी?
अ: जर तुम्हाला दीर्घकालीन गुंतवणूक करायची असेल तर तुम्ही इंडेक्स फंडाचा विचार करू शकता. या फंडांचे पोर्टफोलिओ NSE आणि SENSEX च्या रचना आणि वर्तनाचा मागोवा घेऊन तयार केले जातात. हे पोर्टफोलिओ दीर्घ कालावधीतील समभागांच्या कामगिरीचे आणि समभागांचे मूल्यमापन करून विकसित केले जात असल्याने, तुमची गुंतवणूक कामगिरी न होण्याची शक्यता कमी केली जाते. म्हणूनच, इंडेक्स म्युच्युअल फंडामध्ये गुंतवणूक करण्याचा सल्ला दिला जातो, विशेषतः जर तुम्ही जोखीम कमी करू इच्छित असाल.
2. विशिष्ट इंडेक्स MF कसा निवडावा?
अ: तुम्ही इंडेक्स म्युच्युअल फंडाचा दीर्घकालीन कामगिरीवर आधारित वैयक्तिक पोर्टफोलिओ निवडावा. काही अधिक विश्वासार्ह फंड म्हणजे SBI, LICI, ICICI प्रुडेन्शियल UTI आणि इतर तत्सम इंडेक्स फंड बेंचमार्किंगसाठी आधार म्हणून वापरले जातात.
3. इंडेक्स फंडात गुंतवणूक करण्याचा मुख्य फायदा काय आहे?
अ: इंडेक्स फंड निष्क्रीयपणे व्यवस्थापित केले जातात. अशा प्रकारे, इंडेक्स फंडांचे एकूण खर्चाचे प्रमाण किंवा TER सक्रियपणे व्यवस्थापित फंडांपेक्षा कमी आहे. याचा अर्थ तुमची गुंतवणूक कमी असेल आणि तुम्ही अपेक्षित असलेला खर्च तितका कमी असू शकतो०.२% ते ०.५% तुमच्या गुंतवणुकीचे. इंडेक्स फंडात गुंतवणुकीचा मुख्य फायदा म्हणजे कमी TER.
4. SBI निफ्टी इंडेक्स फंडाकडून किती अपेक्षा ठेवायची?
अ: SBI निफ्टी इंडेक्स फंड निष्क्रीयपणे व्यवस्थापित केला जातो आणि वाढीचा दर दर्शवितो१५.१९% निफ्टी 50 विरुद्ध, ज्याचा वाढीचा दर आहे१५.५%. त्यामुळे तुम्ही एसबीआय निफ्टी इंडेक्स फंडमध्ये 10 वर्षांची गुंतवणूक केल्यास, तुम्हाला अपेक्षित असेल८५.७७% तुमच्या गुंतवणुकीवर परतावा.
5. तुम्ही ICICI प्रुडेन्शियल निफ्टी इंडेक्स फंडात गुंतवणूक केल्यास तुम्ही काय अपेक्षा करू शकता?
अ: ICICI प्रुडेन्शियल निफ्टी इंडेक्स फंडाची श्रेणी सरासरी आहे१६.७८%. समजा, जर तुम्ही 5 वर्षांसाठी गुंतवणूक केली, तर तुम्ही पूर्ण परताव्याची अपेक्षा करू शकता४५.८८%.
6. इंडेक्स फंड वैविध्य कसे जोडतात?
अ: इंडेक्स फंड्समध्ये प्रामुख्याने टॉप कंपन्यांचा समावेश असतो ज्यांचे स्टॉक बेंचमार्क म्हणून वापरले जातात. याव्यतिरिक्त, एकाच पोर्टफोलिओमध्ये, तुमच्याकडे अनेक आघाडीच्या कंपन्या असतील, याचा अर्थ तुमची गुंतवणूक गमावण्याची शक्यता कमी होईल. या ऑटो डायव्हर्सिफिकेशनमुळे गुंतवणुकदाराची गुंतवणूक गमावण्याचा धोका आपोआप कमी होतो.
7. तुम्ही इंडेक्स फंडात गुंतवणूक करण्याचा कधी विचार करावा?
अ: जेव्हा तुम्ही तुमची गुंतवणूक किमान 5 वर्षे ठेवण्यास तयार असाल तेव्हा तुम्ही इंडेक्स फंडमध्ये गुंतवणूक करावी.
8. सर्वोत्तम इंडेक्स फंड निवडण्याचा काही मार्ग आहे का?
अ: जर तुम्ही नवशिक्या असाल तर तुम्ही फंड मॅनेजरशी चर्चा करावी. ते तुम्हाला योग्य निधीचा निर्णय घेण्यास मदत करतात. याव्यतिरिक्त, तुम्ही गुंतवणुकीच्या कालावधीचा देखील विचार केला पाहिजे.
9. इंडेक्स फंड्समध्ये गुंतवणूक करण्यास योग्य कोण आहे?
अ: ज्या व्यक्तींना जास्त धोका पत्करायचा नसतोम्युच्युअल फंडात गुंतवणूक इंडेक्स फंडात गुंतवणूक करण्याचा विचार करू शकता. हे फंड गुंतवणुकदारांना खात्रीशीर परताव्याची खात्री देत नाहीत तर गुंतवणूकदाराकडून मोठ्या गुंतवणुकीचीही आवश्यकता नसते.
येथे प्रदान केलेली माहिती अचूक असल्याची खात्री करण्यासाठी सर्व प्रयत्न केले गेले आहेत. तथापि, डेटाच्या अचूकतेबद्दल कोणतीही हमी दिली जात नाही. कृपया कोणतीही गुंतवणूक करण्यापूर्वी योजना माहिती दस्तऐवजासह सत्यापित करा.


AMFI Registration No. 112358 | CIN: U74999MH2016PTC282153
Shepard Technologies Pvt. Ltd. (with ARN code 112358) makes no warranties or representations, express or implied, on products offered through the platform. It accepts no liability for any damages or losses, however caused, in connection with the use of, or on the reliance of its product or related services. Terms and conditions of the website are applicable.
©2026 Shepard Technologies Private Limited. All Rights Reserved
Quite detailed review which helps in deciding which is a better performing index fund