SIP 2022 - 2023 साठी भारतातील सर्वोत्तम म्युच्युअल फंड
एक पद्धतशीरगुंतवणूक योजना (SIP) हा सर्वात प्रभावी मार्ग मानला जातोम्युच्युअल फंडात गुंतवणूक करा, विशेषतः लांब साठी -मुदत योजना. दीर्घकालीन बचत योजना लागू करण्यासाठी गुंतवणूकदारांना दर महिन्याच्या एका विशिष्ट तारखेला युनिट खरेदी करण्याची परवानगी देते. गुंतवणूकदारांना सोयीस्कर वाटण्याचे एक कारण आहेगुंतवणूक SIP मध्ये ते देतात लवचिकता. गुंतवणूकदार करू शकतातSIP मध्ये गुंतवणूक करा एकतर मासिक, त्रैमासिक किंवा साप्ताहिक वरआधार, त्यांच्या सोयीनुसार. ते कसे साध्य करू शकतात याबद्दल अधिक जाणून घेऊयाआर्थिक उद्दिष्टे पद्धतशीर गुंतवणूक योजनांसह, कसेसिप कॅल्क्युलेटर सोबत गुंतवणुकीसाठी उपयुक्त आहेसर्वोत्तम म्युच्युअल फंड SIP साठी भारतात.
SIP- आर्थिक उद्दिष्टे साध्य करण्याचा इष्टतम मार्ग
SIP ची रचना अशा प्रकारे केली आहे की एखादी व्यक्ती त्यांच्या गुंतवणुकीची पूर्व-नियोजन करू शकते आणि त्यांच्या आर्थिक उद्दिष्टांनुसार गुंतवणूक करू शकते. परंतु, एसआयपीद्वारे उद्दिष्टे साध्य करण्यासाठी दीर्घकाळ गुंतवणूक करावी लागते. साधारणपणे, SIP चा वापर मोठ्या प्रमाणावर लक्ष्यांच्या नियोजनासाठी केला जातो जसे-
Talk to our investment specialist
- कार खरेदी करणे
- घर खरेदी करणे
- लग्न
- मुलाचे शिक्षण
- आंतरराष्ट्रीय सहलीसाठी बचत करा
- सेवानिवृत्ती
- वैद्यकीय आणीबाणी इ.
किमान INR 500 आणि INR 1000 एवढ्या रकमेतून कोणीही SIP मध्ये गुंतवणूक करण्यास सुरुवात करू शकते. एकदा का तुम्ही SIP मध्ये गुंतवणूक करायला सुरुवात केली की तुमचे पैसे स्टॉकच्या संपर्कात आल्याने दररोज जाऊ लागतात.बाजार. म्हणूनच मार्ग म्हणून SIPs ला प्राधान्य दिले जातेइक्विटी फंड. शिवाय, ऐतिहासिकदृष्ट्या, इक्विटी स्टॉकमधील गुंतवणुकीने इतर सर्व मालमत्ता वर्गांमध्ये प्रभावी परतावा दिला आहे, जर गुंतवणूक शिस्तीने आणि दीर्घकालीन क्षितिजासह केली गेली असेल.
इक्विटीमधील एसआयपी बाजाराच्या वेळेचा धोका टाळण्यास आणि गुंतवणुकीच्या खर्चाची सरासरी काढून संपत्ती निर्माण करण्यास मदत करते. आणखी काही पाहूSIP चे फायदे जे दीर्घकालीन उद्दिष्टे साध्य करण्यात मदत करते:
कंपाउंडिंगची शक्ती- जेव्हा तुम्ही फक्त मुद्दलावर व्याज मिळवता तेव्हा साधे व्याज असते. चक्रवाढ व्याजाच्या बाबतीत, व्याजाची रक्कम मुद्दलामध्ये जोडली जाते आणि व्याज नवीन मुद्दल (जुने मुद्दल अधिक नफा) वर मोजले जाते. ही प्रक्रिया प्रत्येक वेळी चालू राहते. मध्ये SIP पासूनम्युच्युअल फंड हप्त्यांमध्ये आहेत, ते चक्रवाढ आहेत, जे सुरुवातीला गुंतवलेल्या रकमेमध्ये अधिक जोडतात.
जोखीम कमी करणे- एसआयपी दीर्घ कालावधीसाठी पसरलेली असते हे लक्षात घेता, शेअर बाजारातील सर्व कालावधी, चढ-उतार आणि सर्वात महत्त्वाचे म्हणजे मंदीचा समावेश होतो. मंदीच्या काळात, जेव्हा बहुतेक गुंतवणूकदारांना भीती वाटते तेव्हा, गुंतवणूकदार “कमी” खरेदी करतात याची खात्री करून SIP हप्ते चालू राहतात.
SIP ची सोय- सुविधा हा SIP चा सर्वात मोठा फायदा आहे. वापरकर्त्यास एकदाच साइन-अप करावे लागेल आणि कागदपत्रांमधून जावे लागेल. एकदा पूर्ण झाल्यानंतर, त्यानंतरच्या गुंतवणुकीसाठी डेबिट आपोआप होतात आणिगुंतवणूकदार फक्त गुंतवणुकीचे निरीक्षण करावे लागेल.
SIP 2022 - 2023 साठी भारतातील सर्वोत्तम म्युच्युअल फंड
SIP साठी सर्वोत्तम लार्ज कॅप फंड
Fund NAV Net Assets (Cr) Min SIP Investment 3 MO (%) 6 MO (%) 1 YR (%) 3 YR (%) 5 YR (%) 2025 (%) Invesco India Largecap Fund Growth ₹71.54
↑ 0.69 ₹1,749 100 5.8 2.3 1.9 13.9 12.8 5.5 Nippon India Large Cap Fund Growth ₹90.1145
↑ 0.90 ₹51,660 100 2.3 -2.5 -1.3 13.1 15.2 9.2 ICICI Prudential Bluechip Fund Growth ₹109.1
↑ 1.11 ₹76,297 100 1.6 -4.1 -1.9 13.1 13.5 11.3 Bandhan Large Cap Fund Growth ₹78.237
↑ 0.91 ₹2,001 100 4.2 -1.2 1.4 12.9 12 8.2 DSP TOP 100 Equity Growth ₹461.24
↑ 5.38 ₹7,175 500 1.5 -3.8 -3.5 12.8 10.7 8.4 Note: Returns up to 1 year are on absolute basis & more than 1 year are on CAGR basis. as on 10 Jul 26 Research Highlights & Commentary of 5 Funds showcased
Commentary Invesco India Largecap Fund Nippon India Large Cap Fund ICICI Prudential Bluechip Fund Bandhan Large Cap Fund DSP TOP 100 Equity Point 1 Bottom quartile AUM (₹1,749 Cr). Upper mid AUM (₹51,660 Cr). Highest AUM (₹76,297 Cr). Bottom quartile AUM (₹2,001 Cr). Lower mid AUM (₹7,175 Cr). Point 2 Established history (16+ yrs). Established history (18+ yrs). Established history (18+ yrs). Established history (20+ yrs). Oldest track record among peers (23 yrs). Point 3 Rating: 3★ (lower mid). Top rated. Rating: 4★ (upper mid). Rating: 2★ (bottom quartile). Rating: 2★ (bottom quartile). Point 4 Risk profile: Moderately High. Risk profile: Moderately High. Risk profile: Moderately High. Risk profile: Moderately High. Risk profile: Moderately High. Point 5 5Y return: 12.75% (lower mid). 5Y return: 15.24% (top quartile). 5Y return: 13.52% (upper mid). 5Y return: 12.03% (bottom quartile). 5Y return: 10.74% (bottom quartile). Point 6 3Y return: 13.87% (top quartile). 3Y return: 13.13% (upper mid). 3Y return: 13.12% (lower mid). 3Y return: 12.87% (bottom quartile). 3Y return: 12.76% (bottom quartile). Point 7 1Y return: 1.88% (top quartile). 1Y return: -1.27% (lower mid). 1Y return: -1.91% (bottom quartile). 1Y return: 1.41% (upper mid). 1Y return: -3.52% (bottom quartile). Point 8 Alpha: 1.94 (upper mid). Alpha: 0.46 (lower mid). Alpha: -1.97 (bottom quartile). Alpha: 1.95 (top quartile). Alpha: -4.25 (bottom quartile). Point 9 Sharpe: -0.24 (top quartile). Sharpe: -0.35 (lower mid). Sharpe: -0.48 (bottom quartile). Sharpe: -0.26 (upper mid). Sharpe: -0.67 (bottom quartile). Point 10 Information ratio: 0.75 (lower mid). Information ratio: 1.03 (top quartile). Information ratio: 0.90 (upper mid). Information ratio: 0.66 (bottom quartile). Information ratio: 0.56 (bottom quartile). Invesco India Largecap Fund
Nippon India Large Cap Fund
ICICI Prudential Bluechip Fund
Bandhan Large Cap Fund
DSP TOP 100 Equity
SIP साठी सर्वोत्तम मल्टी कॅप फंड
Fund NAV Net Assets (Cr) Min SIP Investment 3 MO (%) 6 MO (%) 1 YR (%) 3 YR (%) 5 YR (%) 2025 (%) Aditya Birla Sun Life Manufacturing Equity Fund Growth ₹37.41
↑ 0.39 ₹1,198 1,000 11.1 14 16.3 20.6 14 3.5 Motilal Oswal Multicap 35 Fund Growth ₹59.7947
↑ 0.79 ₹12,937 500 7.9 -1 -4.9 19 12.1 -5.6 Mahindra Badhat Yojana Growth ₹38.2508
↑ 0.49 ₹6,643 500 9 6.7 6.2 18.3 16.1 3.4 ICICI Prudential Multicap Fund Growth ₹852.27
↑ 8.91 ₹17,676 100 8.1 7.8 6.1 17.8 16.1 5.7 BNP Paribas Multi Cap Fund Growth ₹73.5154
↓ -0.01 ₹588 300 -4.6 -2.6 19.3 17.3 13.6 Note: Returns up to 1 year are on absolute basis & more than 1 year are on CAGR basis. as on 10 Jul 26 Research Highlights & Commentary of 5 Funds showcased
Commentary Aditya Birla Sun Life Manufacturing Equity Fund Motilal Oswal Multicap 35 Fund Mahindra Badhat Yojana ICICI Prudential Multicap Fund BNP Paribas Multi Cap Fund Point 1 Bottom quartile AUM (₹1,198 Cr). Upper mid AUM (₹12,937 Cr). Lower mid AUM (₹6,643 Cr). Highest AUM (₹17,676 Cr). Bottom quartile AUM (₹588 Cr). Point 2 Established history (11+ yrs). Established history (12+ yrs). Established history (9+ yrs). Oldest track record among peers (31 yrs). Established history (20+ yrs). Point 3 Not Rated. Top rated. Not Rated. Rating: 3★ (lower mid). Rating: 4★ (upper mid). Point 4 Risk profile: High. Risk profile: Moderately High. Risk profile: Moderately High. Risk profile: Moderately High. Risk profile: Moderately High. Point 5 5Y return: 14.02% (lower mid). 5Y return: 12.07% (bottom quartile). 5Y return: 16.14% (top quartile). 5Y return: 16.07% (upper mid). 5Y return: 13.57% (bottom quartile). Point 6 3Y return: 20.56% (top quartile). 3Y return: 19.00% (upper mid). 3Y return: 18.33% (lower mid). 3Y return: 17.81% (bottom quartile). 3Y return: 17.28% (bottom quartile). Point 7 1Y return: 16.32% (upper mid). 1Y return: -4.86% (bottom quartile). 1Y return: 6.22% (lower mid). 1Y return: 6.14% (bottom quartile). 1Y return: 19.34% (top quartile). Point 8 Alpha: 0.00 (lower mid). Alpha: -5.87 (bottom quartile). Alpha: 4.99 (upper mid). Alpha: 5.38 (top quartile). Alpha: 0.00 (bottom quartile). Point 9 Sharpe: 0.59 (upper mid). Sharpe: -0.52 (bottom quartile). Sharpe: 0.15 (bottom quartile). Sharpe: 0.15 (lower mid). Sharpe: 2.86 (top quartile). Point 10 Information ratio: 0.00 (bottom quartile). Information ratio: 0.47 (lower mid). Information ratio: 0.65 (upper mid). Information ratio: 0.79 (top quartile). Information ratio: 0.00 (bottom quartile). Aditya Birla Sun Life Manufacturing Equity Fund
Motilal Oswal Multicap 35 Fund
Mahindra Badhat Yojana
ICICI Prudential Multicap Fund
BNP Paribas Multi Cap Fund
SIP साठी सर्वोत्तम मिड कॅप फंड
Fund NAV Net Assets (Cr) Min SIP Investment 3 MO (%) 6 MO (%) 1 YR (%) 3 YR (%) 5 YR (%) 2025 (%) ICICI Prudential MidCap Fund Growth ₹338.57
↑ 3.82 ₹7,789 100 6.9 9.5 12.4 23.7 17.8 11.1 BNP Paribas Mid Cap Fund Growth ₹112.262
↑ 1.57 ₹2,461 300 8.3 8.3 11.1 19.7 15.9 2.5 TATA Mid Cap Growth Fund Growth ₹465.117
↑ 6.90 ₹5,732 150 7.6 4.3 6.9 19 16.1 5.8 Aditya Birla Sun Life Midcap Fund Growth ₹842.37
↑ 11.15 ₹6,398 1,000 10.2 6.5 6.1 18.4 15.5 4.4 Note: Returns up to 1 year are on absolute basis & more than 1 year are on CAGR basis. as on 10 Jul 26 Research Highlights & Commentary of 4 Funds showcased
Commentary ICICI Prudential MidCap Fund BNP Paribas Mid Cap Fund TATA Mid Cap Growth Fund Aditya Birla Sun Life Midcap Fund Point 1 Highest AUM (₹7,789 Cr). Bottom quartile AUM (₹2,461 Cr). Lower mid AUM (₹5,732 Cr). Upper mid AUM (₹6,398 Cr). Point 2 Established history (21+ yrs). Established history (20+ yrs). Oldest track record among peers (32 yrs). Established history (23+ yrs). Point 3 Rating: 2★ (lower mid). Top rated. Rating: 2★ (bottom quartile). Rating: 3★ (upper mid). Point 4 Risk profile: Moderately High. Risk profile: High. Risk profile: Moderately High. Risk profile: Moderately High. Point 5 5Y return: 17.85% (top quartile). 5Y return: 15.88% (lower mid). 5Y return: 16.06% (upper mid). 5Y return: 15.54% (bottom quartile). Point 6 3Y return: 23.74% (top quartile). 3Y return: 19.74% (upper mid). 3Y return: 18.98% (lower mid). 3Y return: 18.38% (bottom quartile). Point 7 1Y return: 12.38% (top quartile). 1Y return: 11.08% (upper mid). 1Y return: 6.94% (lower mid). 1Y return: 6.07% (bottom quartile). Point 8 Alpha: 9.08 (top quartile). Alpha: 2.64 (upper mid). Alpha: 0.38 (lower mid). Alpha: -1.82 (bottom quartile). Point 9 Sharpe: 0.61 (top quartile). Sharpe: 0.34 (upper mid). Sharpe: 0.20 (lower mid). Sharpe: 0.09 (bottom quartile). Point 10 Information ratio: 0.84 (top quartile). Information ratio: -0.33 (upper mid). Information ratio: -0.87 (bottom quartile). Information ratio: -0.78 (lower mid). ICICI Prudential MidCap Fund
BNP Paribas Mid Cap Fund
TATA Mid Cap Growth Fund
Aditya Birla Sun Life Midcap Fund
SIP साठी सर्वोत्तम स्मॉल कॅप फंड
Fund NAV Net Assets (Cr) Min SIP Investment 3 MO (%) 6 MO (%) 1 YR (%) 3 YR (%) 5 YR (%) 2025 (%) Sundaram Small Cap Fund Growth ₹293.804
↑ 4.25 ₹3,681 100 16.1 14.1 11.5 19.4 17.4 0.4 DSP Small Cap Fund Growth ₹222.601
↑ 2.22 ₹18,358 500 14.6 15.8 9.8 19.2 18.1 -2.8 IDBI Small Cap Fund Growth ₹33.8829
↑ 0.34 ₹695 500 17.8 19.4 9.4 18.3 18 -13.4 Nippon India Small Cap Fund Growth ₹181.682
↑ 2.43 ₹74,604 100 13 12.2 4.7 18.1 19.7 -4.7 Aditya Birla Sun Life Small Cap Fund Growth ₹96.2577
↑ 1.14 ₹5,453 1,000 15.6 15.6 9.8 16.9 13.1 -3.7 Note: Returns up to 1 year are on absolute basis & more than 1 year are on CAGR basis. as on 10 Jul 26 Research Highlights & Commentary of 5 Funds showcased
Commentary Sundaram Small Cap Fund DSP Small Cap Fund IDBI Small Cap Fund Nippon India Small Cap Fund Aditya Birla Sun Life Small Cap Fund Point 1 Bottom quartile AUM (₹3,681 Cr). Upper mid AUM (₹18,358 Cr). Bottom quartile AUM (₹695 Cr). Highest AUM (₹74,604 Cr). Lower mid AUM (₹5,453 Cr). Point 2 Oldest track record among peers (21 yrs). Established history (19+ yrs). Established history (9+ yrs). Established history (15+ yrs). Established history (19+ yrs). Point 3 Rating: 3★ (bottom quartile). Rating: 4★ (upper mid). Not Rated. Rating: 4★ (lower mid). Top rated. Point 4 Risk profile: Moderately High. Risk profile: Moderately High. Risk profile: Moderately High. Risk profile: Moderately High. Risk profile: Moderately High. Point 5 5Y return: 17.42% (bottom quartile). 5Y return: 18.08% (upper mid). 5Y return: 17.95% (lower mid). 5Y return: 19.67% (top quartile). 5Y return: 13.06% (bottom quartile). Point 6 3Y return: 19.36% (top quartile). 3Y return: 19.22% (upper mid). 3Y return: 18.29% (lower mid). 3Y return: 18.13% (bottom quartile). 3Y return: 16.93% (bottom quartile). Point 7 1Y return: 11.49% (top quartile). 1Y return: 9.76% (lower mid). 1Y return: 9.38% (bottom quartile). 1Y return: 4.70% (bottom quartile). 1Y return: 9.77% (upper mid). Point 8 Alpha: 7.77 (top quartile). Alpha: 0.00 (bottom quartile). Alpha: 5.40 (upper mid). Alpha: 2.35 (lower mid). Alpha: 0.00 (bottom quartile). Point 9 Sharpe: 0.26 (top quartile). Sharpe: 0.13 (bottom quartile). Sharpe: 0.17 (lower mid). Sharpe: 0.05 (bottom quartile). Sharpe: 0.23 (upper mid). Point 10 Information ratio: -0.16 (lower mid). Information ratio: 0.00 (top quartile). Information ratio: -0.35 (bottom quartile). Information ratio: -0.24 (bottom quartile). Information ratio: 0.00 (upper mid). Sundaram Small Cap Fund
DSP Small Cap Fund
IDBI Small Cap Fund
Nippon India Small Cap Fund
Aditya Birla Sun Life Small Cap Fund
SIP साठी सर्वोत्तम ELSS (टॅक्स सेव्हिंग म्युच्युअल फंड).
Fund NAV Net Assets (Cr) Min SIP Investment 3 MO (%) 6 MO (%) 1 YR (%) 3 YR (%) 5 YR (%) 2025 (%) Motilal Oswal Long Term Equity Fund Growth ₹55.5536
↑ 0.66 ₹4,663 500 9 12.4 4.7 21.9 17.5 -9.1 IDBI Equity Advantage Fund Growth ₹43.39
↑ 0.04 ₹485 500 9.7 15.1 16.9 20.8 10 HDFC Long Term Advantage Fund Growth ₹595.168
↑ 0.28 ₹1,318 500 1.2 15.4 35.5 20.6 17.4 SBI Magnum Tax Gain Fund Growth ₹439.96
↑ 4.96 ₹30,955 500 4.1 -0.9 -1 17.4 16.8 6.6 Baroda Pioneer ELSS 96 Growth ₹68.6676
↑ 0.33 ₹210 500 -6.1 -3.5 17.6 16.7 11.6 Note: Returns up to 1 year are on absolute basis & more than 1 year are on CAGR basis. as on 10 Jul 26 Research Highlights & Commentary of 5 Funds showcased
Commentary Motilal Oswal Long Term Equity Fund IDBI Equity Advantage Fund HDFC Long Term Advantage Fund SBI Magnum Tax Gain Fund Baroda Pioneer ELSS 96 Point 1 Upper mid AUM (₹4,663 Cr). Bottom quartile AUM (₹485 Cr). Lower mid AUM (₹1,318 Cr). Highest AUM (₹30,955 Cr). Bottom quartile AUM (₹210 Cr). Point 2 Established history (11+ yrs). Established history (12+ yrs). Oldest track record among peers (25 yrs). Established history (19+ yrs). Established history (11+ yrs). Point 3 Not Rated. Top rated. Rating: 3★ (upper mid). Rating: 2★ (lower mid). Not Rated. Point 4 Risk profile: Moderately High. Risk profile: Moderately High. Risk profile: Moderately High. Risk profile: Moderately High. Risk profile: Moderately High. Point 5 5Y return: 17.49% (top quartile). 5Y return: 9.97% (bottom quartile). 5Y return: 17.39% (upper mid). 5Y return: 16.82% (lower mid). 5Y return: 11.62% (bottom quartile). Point 6 3Y return: 21.88% (top quartile). 3Y return: 20.84% (upper mid). 3Y return: 20.64% (lower mid). 3Y return: 17.41% (bottom quartile). 3Y return: 16.70% (bottom quartile). Point 7 1Y return: 4.69% (bottom quartile). 1Y return: 16.92% (lower mid). 1Y return: 35.51% (top quartile). 1Y return: -0.96% (bottom quartile). 1Y return: 17.56% (upper mid). Point 8 Alpha: 3.21 (upper mid). Alpha: 1.78 (lower mid). Alpha: 1.75 (bottom quartile). Alpha: -2.25 (bottom quartile). Alpha: 5.69 (top quartile). Point 9 Sharpe: -0.02 (bottom quartile). Sharpe: 1.21 (lower mid). Sharpe: 2.27 (upper mid). Sharpe: -0.36 (bottom quartile). Sharpe: 2.51 (top quartile). Point 10 Information ratio: 0.73 (upper mid). Information ratio: -1.13 (bottom quartile). Information ratio: -0.15 (bottom quartile). Information ratio: 1.38 (top quartile). Information ratio: -0.09 (lower mid). Motilal Oswal Long Term Equity Fund
IDBI Equity Advantage Fund
HDFC Long Term Advantage Fund
SBI Magnum Tax Gain Fund
Baroda Pioneer ELSS 96
SIP साठी सर्वोत्तम सेक्टर फंड
Fund NAV Net Assets (Cr) Min SIP Investment 3 MO (%) 6 MO (%) 1 YR (%) 3 YR (%) 5 YR (%) 2025 (%) DSP Natural Resources and New Energy Fund Growth ₹105.124
↑ 0.39 ₹2,457 500 -2.5 5.9 16.8 20.3 15.5 17.5 BOI AXA Manufacturing and Infrastructure Fund Growth ₹66.54
↑ 0.59 ₹789 1,000 11.7 14 15.3 24.4 21.1 7.8 UTI Healthcare Fund Growth ₹330.241
↑ 1.85 ₹1,217 500 17.9 17.1 15 26 14.6 -3.1 SBI Healthcare Opportunities Fund Growth ₹496.754
↑ 7.59 ₹4,566 500 18.4 17.9 14.2 24.2 16.4 -3.5 DSP India T.I.G.E.R Fund Growth ₹362.845
↑ 3.72 ₹6,019 500 11.9 17.3 13.1 24.8 22.9 -2.5 Note: Returns up to 1 year are on absolute basis & more than 1 year are on CAGR basis. as on 9 Jul 26 Research Highlights & Commentary of 5 Funds showcased
Commentary DSP Natural Resources and New Energy Fund BOI AXA Manufacturing and Infrastructure Fund UTI Healthcare Fund SBI Healthcare Opportunities Fund DSP India T.I.G.E.R Fund Point 1 Lower mid AUM (₹2,457 Cr). Bottom quartile AUM (₹789 Cr). Bottom quartile AUM (₹1,217 Cr). Upper mid AUM (₹4,566 Cr). Highest AUM (₹6,019 Cr). Point 2 Established history (18+ yrs). Established history (16+ yrs). Oldest track record among peers (27 yrs). Established history (21+ yrs). Established history (22+ yrs). Point 3 Top rated. Not Rated. Rating: 1★ (bottom quartile). Rating: 2★ (lower mid). Rating: 4★ (upper mid). Point 4 Risk profile: High. Risk profile: High. Risk profile: High. Risk profile: High. Risk profile: High. Point 5 5Y return: 15.52% (bottom quartile). 5Y return: 21.15% (upper mid). 5Y return: 14.56% (bottom quartile). 5Y return: 16.38% (lower mid). 5Y return: 22.91% (top quartile). Point 6 3Y return: 20.26% (bottom quartile). 3Y return: 24.44% (lower mid). 3Y return: 25.99% (top quartile). 3Y return: 24.17% (bottom quartile). 3Y return: 24.76% (upper mid). Point 7 1Y return: 16.80% (top quartile). 1Y return: 15.26% (upper mid). 1Y return: 14.95% (lower mid). 1Y return: 14.24% (bottom quartile). 1Y return: 13.06% (bottom quartile). Point 8 Alpha: 0.00 (upper mid). Alpha: 0.00 (lower mid). Alpha: 0.91 (top quartile). Alpha: -0.04 (bottom quartile). Alpha: 0.00 (bottom quartile). Point 9 Sharpe: 1.33 (top quartile). Sharpe: 0.60 (upper mid). Sharpe: 0.42 (bottom quartile). Sharpe: 0.36 (bottom quartile). Sharpe: 0.48 (lower mid). Point 10 Information ratio: 0.00 (upper mid). Information ratio: 0.00 (lower mid). Information ratio: 0.08 (top quartile). Information ratio: -0.40 (bottom quartile). Information ratio: 0.00 (bottom quartile). DSP Natural Resources and New Energy Fund
BOI AXA Manufacturing and Infrastructure Fund
UTI Healthcare Fund
SBI Healthcare Opportunities Fund
DSP India T.I.G.E.R Fund
एसआयपीसाठी सर्वोत्तम केंद्रित निधी
Fund NAV Net Assets (Cr) Min SIP Investment 3 MO (%) 6 MO (%) 1 YR (%) 3 YR (%) 5 YR (%) 2025 (%) ICICI Prudential Focused Equity Fund Growth ₹96.12
↑ 0.99 ₹16,147 100 6 -1.1 4.3 18.7 17 15.4 Sundaram Select Focus Fund Growth ₹264.968
↓ -1.18 ₹1,354 100 -5 8.5 24.5 17 17.3 HDFC Focused 30 Fund Growth ₹233.327
↑ 2.14 ₹26,082 300 3.3 -1.9 1.2 16.9 18.9 10.9 SBI Focused Equity Fund Growth ₹388.854
↑ 1.37 ₹46,623 500 8.4 2.8 8.7 15.8 12.8 15.7 DSP Focus Fund Growth ₹55.643
↑ 0.65 ₹2,478 500 6.5 -0.1 1.1 15.4 11.2 7.3 Note: Returns up to 1 year are on absolute basis & more than 1 year are on CAGR basis. as on 10 Jul 26 Research Highlights & Commentary of 5 Funds showcased
Commentary ICICI Prudential Focused Equity Fund Sundaram Select Focus Fund HDFC Focused 30 Fund SBI Focused Equity Fund DSP Focus Fund Point 1 Lower mid AUM (₹16,147 Cr). Bottom quartile AUM (₹1,354 Cr). Upper mid AUM (₹26,082 Cr). Highest AUM (₹46,623 Cr). Bottom quartile AUM (₹2,478 Cr). Point 2 Established history (17+ yrs). Oldest track record among peers (23 yrs). Established history (21+ yrs). Established history (21+ yrs). Established history (16+ yrs). Point 3 Rating: 2★ (bottom quartile). Top rated. Rating: 3★ (upper mid). Rating: 2★ (bottom quartile). Rating: 3★ (lower mid). Point 4 Risk profile: Moderately High. Risk profile: Moderately High. Risk profile: Moderately High. Risk profile: Moderately High. Risk profile: Moderately High. Point 5 5Y return: 16.98% (lower mid). 5Y return: 17.29% (upper mid). 5Y return: 18.87% (top quartile). 5Y return: 12.77% (bottom quartile). 5Y return: 11.20% (bottom quartile). Point 6 3Y return: 18.72% (top quartile). 3Y return: 17.03% (upper mid). 3Y return: 16.86% (lower mid). 3Y return: 15.85% (bottom quartile). 3Y return: 15.36% (bottom quartile). Point 7 1Y return: 4.26% (lower mid). 1Y return: 24.49% (top quartile). 1Y return: 1.16% (bottom quartile). 1Y return: 8.66% (upper mid). 1Y return: 1.12% (bottom quartile). Point 8 Alpha: -0.18 (upper mid). Alpha: -5.62 (bottom quartile). Alpha: -3.45 (lower mid). Alpha: 12.40 (top quartile). Alpha: -4.56 (bottom quartile). Point 9 Sharpe: -0.23 (lower mid). Sharpe: 1.85 (top quartile). Sharpe: -0.41 (bottom quartile). Sharpe: 0.41 (upper mid). Sharpe: -0.47 (bottom quartile). Point 10 Information ratio: 1.19 (top quartile). Information ratio: -0.52 (bottom quartile). Information ratio: 0.53 (lower mid). Information ratio: 0.58 (upper mid). Information ratio: 0.17 (bottom quartile). ICICI Prudential Focused Equity Fund
Sundaram Select Focus Fund
HDFC Focused 30 Fund
SBI Focused Equity Fund
DSP Focus Fund
एसआयपीसाठी सर्वोत्तम मूल्य निधी
Fund NAV Net Assets (Cr) Min SIP Investment 3 MO (%) 6 MO (%) 1 YR (%) 3 YR (%) 5 YR (%) 2025 (%) Aditya Birla Sun Life Pure Value Fund Growth ₹136.064
↑ 1.69 ₹6,530 1,000 9.2 6.7 7.6 17.6 15 2.6 HDFC Capital Builder Value Fund Growth ₹784.089
↑ 8.93 ₹7,314 300 6.9 2.7 4.1 17.2 15.2 8.6 Nippon India Value Fund Growth ₹226.177
↑ 2.26 ₹8,821 100 3.9 -1.3 -1.1 16.9 15.5 4.2 ICICI Prudential Value Discovery Fund Growth ₹464.99
↑ 4.92 ₹58,954 100 0.7 -5.4 -1.7 15.2 16.7 13.8 UTI Value Opportunities Fund Growth ₹167.409
↑ 1.86 ₹9,258 500 3.9 -2.6 -2 14.8 12.7 7 Note: Returns up to 1 year are on absolute basis & more than 1 year are on CAGR basis. as on 10 Jul 26 Research Highlights & Commentary of 5 Funds showcased
Commentary Aditya Birla Sun Life Pure Value Fund HDFC Capital Builder Value Fund Nippon India Value Fund ICICI Prudential Value Discovery Fund UTI Value Opportunities Fund Point 1 Bottom quartile AUM (₹6,530 Cr). Bottom quartile AUM (₹7,314 Cr). Lower mid AUM (₹8,821 Cr). Highest AUM (₹58,954 Cr). Upper mid AUM (₹9,258 Cr). Point 2 Established history (18+ yrs). Oldest track record among peers (32 yrs). Established history (21+ yrs). Established history (21+ yrs). Established history (20+ yrs). Point 3 Top rated. Rating: 3★ (upper mid). Not Rated. Rating: 2★ (lower mid). Rating: 1★ (bottom quartile). Point 4 Risk profile: Moderately High. Risk profile: Moderately High. Risk profile: Moderately High. Risk profile: Moderately High. Risk profile: Moderately High. Point 5 5Y return: 15.02% (bottom quartile). 5Y return: 15.18% (lower mid). 5Y return: 15.49% (upper mid). 5Y return: 16.68% (top quartile). 5Y return: 12.75% (bottom quartile). Point 6 3Y return: 17.61% (top quartile). 3Y return: 17.16% (upper mid). 3Y return: 16.91% (lower mid). 3Y return: 15.24% (bottom quartile). 3Y return: 14.83% (bottom quartile). Point 7 1Y return: 7.59% (top quartile). 1Y return: 4.14% (upper mid). 1Y return: -1.08% (lower mid). 1Y return: -1.70% (bottom quartile). 1Y return: -2.01% (bottom quartile). Point 8 Alpha: 6.66 (top quartile). Alpha: 2.21 (upper mid). Alpha: -1.04 (lower mid). Alpha: -3.74 (bottom quartile). Alpha: -3.31 (bottom quartile). Point 9 Sharpe: 0.14 (top quartile). Sharpe: -0.08 (upper mid). Sharpe: -0.26 (lower mid). Sharpe: -0.47 (bottom quartile). Sharpe: -0.40 (bottom quartile). Point 10 Information ratio: 0.75 (lower mid). Information ratio: 1.34 (top quartile). Information ratio: 1.30 (upper mid). Information ratio: 0.46 (bottom quartile). Information ratio: 0.24 (bottom quartile). Aditya Birla Sun Life Pure Value Fund
HDFC Capital Builder Value Fund
Nippon India Value Fund
ICICI Prudential Value Discovery Fund
UTI Value Opportunities Fund
एसआयपी कॅल्क्युलेटर
एसआयपी कॅल्क्युलेटर हे म्युच्युअल फंडामध्ये गुंतवणूक करताना गुंतवणूकदार वापरू शकतो अशा कार्यक्षम साधनांपैकी एक आहे. एखाद्याला कार/घर, सेवानिवृत्तीची योजना, मुलाचे उच्च शिक्षण किंवा इतर कोणतीही मालमत्ता खरेदी करण्यासाठी गुंतवणूक करायची असेल, त्यासाठी SIP कॅल्क्युलेटरचा वापर केला जाऊ शकतो. विशिष्ट आर्थिक उद्दिष्ट गाठण्यासाठी गुंतवणुकीसाठी आवश्यक असलेल्या गुंतवणुकीची रक्कम आणि कालावधीची गणना करण्यात हे मदत करते. तर, सामान्य प्रश्न जसे की "कितीSIP मध्ये गुंतवणूक करा किंवा तोपर्यंत मी गुंतवणूक कशी करावी", हे कॅल्क्युलेटर वापरून निराकरण करते.
एसआयपी कॅल्क्युलेटर वापरताना, विशिष्ट व्हेरिएबल्स भरावे लागतील, ज्यामध्ये समाविष्ट आहे (चित्र खाली दिलेले आहे)-
- इच्छित गुंतवणूक कालावधी
- अंदाजे मासिक SIP रक्कम
- अपेक्षितमहागाई पुढील वर्षांसाठी दर (वार्षिक).
- गुंतवणुकीवर दीर्घकालीन वाढीचा दर
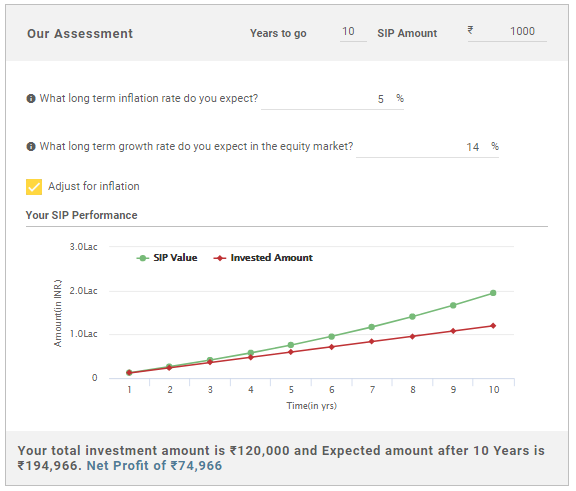
एकदा तुम्ही वर नमूद केलेली सर्व माहिती फीड केल्यावर, कॅल्क्युलेटर तुम्हाला नमूद केलेल्या वर्षांच्या संख्येनंतर तुम्हाला मिळणारी रक्कम (तुमचा SIP परतावा) देईल. तुमचा निव्वळ नफा देखील हायलाइट केला जाईल जेणेकरून तुम्ही त्यानुसार तुमच्या ध्येयपूर्तीचा अंदाज लावू शकता.
सर्वोत्तम म्युच्युअल फंडात गुंतवणूक कशी करावी?
Fincash.com वर आजीवन मोफत गुंतवणूक खाते उघडा.
तुमची नोंदणी आणि KYC प्रक्रिया पूर्ण करा
दस्तऐवज अपलोड करा (PAN, आधार इ.).आणि, तुम्ही गुंतवणूक करण्यास तयार आहात!
येथे प्रदान केलेली माहिती अचूक असल्याची खात्री करण्यासाठी सर्व प्रयत्न केले गेले आहेत. तथापि, डेटाच्या अचूकतेबद्दल कोणतीही हमी दिली जात नाही. कृपया कोणतीही गुंतवणूक करण्यापूर्वी योजना माहिती दस्तऐवजासह सत्यापित करा.


AMFI Registration No. 112358 | CIN: U74999MH2016PTC282153
Shepard Technologies Pvt. Ltd. (with ARN code 112358) makes no warranties or representations, express or implied, on products offered through the platform. It accepts no liability for any damages or losses, however caused, in connection with the use of, or on the reliance of its product or related services. Terms and conditions of the website are applicable.
©2026 Shepard Technologies Private Limited. All Rights Reserved