ਨਿਵੇਸ਼ ਕਰਨ ਲਈ ਚੋਟੀ ਦੇ 5 ਸਰਬੋਤਮ ਇਕੁਇਟੀ SIP ਫੰਡ
ਜੇਕਰ ਤੁਸੀਂ ਚਾਹੁੰਦੇ ਹੋ ਕਿ ਤੁਹਾਡੇ ਨਿਵੇਸ਼ਾਂ ਨੂੰ ਸਭ ਵਿੱਚ ਪਸੰਦ ਕੀਤਾ ਜਾਵੇਬਜ਼ਾਰ ਹਾਲਾਤ, ਫਿਰ ਆਪਣੇ ਨਿਵੇਸ਼ ਨੂੰ ਲੈSIP ਤਰੀਕਾ! ਸਿਸਟਮੈਟਿਕ ਇਨਵੈਸਟਮੈਂਟ ਪਲਾਨ (SIPs) ਨੂੰ ਸਭ ਤੋਂ ਪ੍ਰਭਾਵਸ਼ਾਲੀ ਢੰਗ ਮੰਨਿਆ ਜਾਂਦਾ ਹੈਮਿਉਚੁਅਲ ਫੰਡਾਂ ਵਿੱਚ ਨਿਵੇਸ਼ ਕਰਨਾ. ਅਤੇ ਜੇਕਰ ਤੁਸੀਂ ਇਕੁਇਟੀ ਵਿੱਚ ਨਿਵੇਸ਼ ਕਰਨ ਦੀ ਯੋਜਨਾ ਬਣਾ ਰਹੇ ਹੋ, ਤਾਂ SIPs ਤਰਸਯੋਗ ਰਿਟਰਨ ਬਣਾਉਣ ਦਾ ਸਭ ਤੋਂ ਵਧੀਆ ਤਰੀਕਾ ਹੈ। ਸਰਬੋਤਮ ਇਕੁਇਟੀ SIP ਫੰਡ ਤੁਹਾਨੂੰ ਲੰਬੇ ਸਮੇਂ ਵਿੱਚ ਪੂਰਾ ਕਰਨ ਲਈ ਲੋੜੀਂਦੇ ਰਿਟਰਨ ਦੇ ਸਕਦੇ ਹਨਵਿੱਤੀ ਟੀਚੇ. ਤਾਂ, ਆਓ ਦੇਖੀਏ ਕਿ SIP ਕਿਵੇਂ ਕੰਮ ਕਰਦੀ ਹੈ, ਦੇ ਲਾਭSIP ਨਿਵੇਸ਼ਦੀ ਮਹੱਤਵਪੂਰਨ ਵਰਤੋਂsip ਕੈਲਕੁਲੇਟਰ ਇਕੁਇਟੀ ਨਿਵੇਸ਼ਾਂ ਲਈ ਵਧੀਆ ਪ੍ਰਦਰਸ਼ਨ ਕਰਨ ਵਾਲੇ SIP ਫੰਡਾਂ ਦੇ ਨਾਲ।
Talk to our investment specialist
ਇਕੁਇਟੀ ਮਿਉਚੁਅਲ ਫੰਡਾਂ ਲਈ ਪ੍ਰਣਾਲੀਗਤ ਨਿਵੇਸ਼
ਆਦਰਸ਼ਕ ਤੌਰ 'ਤੇ, ਜਦੋਂ ਨਿਵੇਸ਼ਕ ਇਕੁਇਟੀ ਵਿੱਚ ਨਿਵੇਸ਼ ਕਰਨ ਦੀ ਯੋਜਨਾ ਬਣਾਉਂਦੇ ਹਨ, ਤਾਂ ਉਹ ਅਕਸਰ ਰਿਟਰਨ ਦੀ ਸਥਿਰਤਾ ਬਾਰੇ ਸ਼ੱਕ ਕਰਦੇ ਹਨ। ਇਹ ਇਸ ਲਈ ਹੈ ਕਿਉਂਕਿ ਉਹ ਮਾਰਕੀਟ ਨਾਲ ਜੁੜੇ ਹੋਏ ਹਨ ਅਤੇ ਅਕਸਰ ਅਸਥਿਰਤਾ ਦਾ ਸਾਹਮਣਾ ਕਰਦੇ ਹਨ. ਇਸ ਤਰ੍ਹਾਂ, ਅਜਿਹੀ ਅਸਥਿਰਤਾ ਨੂੰ ਸੰਤੁਲਿਤ ਕਰਨ ਅਤੇ ਲੰਬੇ ਸਮੇਂ ਦੇ ਸਥਿਰ ਰਿਟਰਨ ਨੂੰ ਯਕੀਨੀ ਬਣਾਉਣ ਲਈ, ਇਕੁਇਟੀ ਨਿਵੇਸ਼ਾਂ ਵਿੱਚ SIPs ਦੀ ਬਹੁਤ ਜ਼ਿਆਦਾ ਸਿਫ਼ਾਰਸ਼ ਕੀਤੀ ਜਾਂਦੀ ਹੈ। ਇਤਿਹਾਸਕ ਤੌਰ 'ਤੇ, ਖਰਾਬ ਮਾਰਕੀਟ ਪੜਾਅ ਵਿੱਚ, ਇਹ ਦੇਖਿਆ ਗਿਆ ਹੈ ਕਿ ਜਿਨ੍ਹਾਂ ਨਿਵੇਸ਼ਕਾਂ ਨੇ SIP ਰੂਟ ਲਿਆ ਸੀ, ਉਨ੍ਹਾਂ ਨੇ ਇੱਕਮੁਸ਼ਤ ਰੂਟ ਲੈਣ ਵਾਲਿਆਂ ਨਾਲੋਂ ਵਧੇਰੇ ਸਥਿਰ ਰਿਟਰਨ ਕਮਾਏ ਹਨ। SIP ਦਾ ਨਿਵੇਸ਼ ਸਮੇਂ ਦੇ ਨਾਲ ਫੈਲਿਆ ਹੋਇਆ ਹੈ, ਇੱਕਮੁਸ਼ਤ ਨਿਵੇਸ਼ ਦੇ ਉਲਟ ਜੋ ਇੱਕ ਵਾਰ ਵਿੱਚ ਹੁੰਦਾ ਹੈ। ਇਸ ਲਈ, SIP ਵਿੱਚ ਤੁਹਾਡਾ ਪੈਸਾ ਹਰ ਦਿਨ ਵਧਣਾ ਸ਼ੁਰੂ ਹੁੰਦਾ ਹੈ (ਸਟਾਕ ਮਾਰਕੀਟ ਵਿੱਚ ਨਿਵੇਸ਼ ਕੀਤਾ ਜਾ ਰਿਹਾ ਹੈ)।
ਇੱਕ ਯੋਜਨਾਬੱਧਨਿਵੇਸ਼ ਯੋਜਨਾ ਨੂੰ ਲੰਬੇ ਸਮੇਂ ਦੇ ਵਿੱਤੀ ਟੀਚਿਆਂ ਨੂੰ ਪ੍ਰਾਪਤ ਕਰਨ ਲਈ ਵੀ ਵਿਆਪਕ ਤੌਰ 'ਤੇ ਮੰਨਿਆ ਜਾਂਦਾ ਹੈਰਿਟਾਇਰਮੈਂਟ ਦੀ ਯੋਜਨਾਬੰਦੀ, ਬੱਚੇ ਦੀ ਸਿੱਖਿਆ, ਘਰ/ਕਾਰ ਜਾਂ ਕੋਈ ਹੋਰ ਜਾਇਦਾਦ ਦੀ ਖਰੀਦਦਾਰੀ। ਇਸ ਤੋਂ ਪਹਿਲਾਂ ਕਿ ਅਸੀਂ ਕੁਝ ਹੋਰ ਦੇਖੀਏਨਿਵੇਸ਼ ਦੇ ਲਾਭ ਇੱਕ SIP ਵਿੱਚ, ਆਓ ਨਿਵੇਸ਼ ਕਰਨ ਲਈ ਕੁਝ ਵਧੀਆ ਇਕੁਇਟੀ SIP ਫੰਡਾਂ ਦੀ ਜਾਂਚ ਕਰੀਏ।
ਇਕੁਇਟੀ ਫੰਡ 2022 ਲਈ ਵਧੀਆ SIP ਯੋਜਨਾਵਾਂ
ਵਧੀਆ ਲਾਰਜ ਕੈਪ ਇਕੁਇਟੀ SIP ਫੰਡ
Fund NAV Net Assets (Cr) Min SIP Investment 3 MO (%) 6 MO (%) 1 YR (%) 3 YR (%) 5 YR (%) 2024 (%) JM Core 11 Fund Growth ₹20.2837
↑ 0.17 ₹286 500 6.5 6.1 4.7 12.9 14.1 -1.9 SBI Bluechip Fund Growth ₹94.1437
↑ 0.18 ₹55,064 500 3.2 -0.2 2.1 9.5 10.8 9.7 Indiabulls Blue Chip Fund Growth ₹43.37
↑ 0.34 ₹132 500 3.7 0.8 1.8 10.4 10.2 7.5 Nippon India Large Cap Fund Growth ₹90.5135
↑ 0.23 ₹53,227 100 2.1 -0.8 0.4 11.9 14.9 9.2 Aditya Birla Sun Life Frontline Equity Fund Growth ₹524.9
↑ 1.77 ₹29,029 100 3.9 -1.1 0 10.4 10.9 9.4 Note: Returns up to 1 year are on absolute basis & more than 1 year are on CAGR basis. as on 31 Jul 26 Research Highlights & Commentary of 5 Funds showcased
Commentary JM Core 11 Fund SBI Bluechip Fund Indiabulls Blue Chip Fund Nippon India Large Cap Fund Aditya Birla Sun Life Frontline Equity Fund Point 1 Bottom quartile AUM (₹286 Cr). Highest AUM (₹55,064 Cr). Bottom quartile AUM (₹132 Cr). Upper mid AUM (₹53,227 Cr). Lower mid AUM (₹29,029 Cr). Point 2 Established history (18+ yrs). Established history (20+ yrs). Established history (14+ yrs). Established history (18+ yrs). Oldest track record among peers (23 yrs). Point 3 Top rated. Rating: 4★ (upper mid). Rating: 4★ (lower mid). Rating: 4★ (bottom quartile). Rating: 4★ (bottom quartile). Point 4 Risk profile: High. Risk profile: Moderately High. Risk profile: Moderately High. Risk profile: Moderately High. Risk profile: Moderately High. Point 5 5Y return: 14.15% (upper mid). 5Y return: 10.84% (bottom quartile). 5Y return: 10.24% (bottom quartile). 5Y return: 14.95% (top quartile). 5Y return: 10.91% (lower mid). Point 6 3Y return: 12.88% (top quartile). 3Y return: 9.55% (bottom quartile). 3Y return: 10.44% (lower mid). 3Y return: 11.92% (upper mid). 3Y return: 10.37% (bottom quartile). Point 7 1Y return: 4.68% (top quartile). 1Y return: 2.09% (upper mid). 1Y return: 1.81% (lower mid). 1Y return: 0.41% (bottom quartile). 1Y return: 0.00% (bottom quartile). Point 8 Alpha: 2.17 (upper mid). Alpha: 3.45 (top quartile). Alpha: 1.28 (lower mid). Alpha: 1.07 (bottom quartile). Alpha: -2.27 (bottom quartile). Point 9 Sharpe: -0.23 (top quartile). Sharpe: -0.28 (upper mid). Sharpe: -0.39 (lower mid). Sharpe: -0.43 (bottom quartile). Sharpe: -0.61 (bottom quartile). Point 10 Information ratio: 0.15 (upper mid). Information ratio: -0.05 (bottom quartile). Information ratio: 0.06 (lower mid). Information ratio: 0.98 (top quartile). Information ratio: -0.10 (bottom quartile). JM Core 11 Fund
SBI Bluechip Fund
Indiabulls Blue Chip Fund
Nippon India Large Cap Fund
Aditya Birla Sun Life Frontline Equity Fund
ਵਧੀਆ ਲਾਰਜ ਅਤੇ ਮਿਡ ਕੈਪ ਇਕੁਇਟੀ SIP ਫੰਡ
Fund NAV Net Assets (Cr) Min SIP Investment 3 MO (%) 6 MO (%) 1 YR (%) 3 YR (%) 5 YR (%) 2024 (%) Invesco India Growth Opportunities Fund Growth ₹109.74
↑ 0.18 ₹11,164 100 11.6 15.6 8.8 22.8 17.2 4.7 Kotak Equity Opportunities Fund Growth ₹354.938
↑ 1.80 ₹31,263 1,000 4 1.6 4.4 13.9 14 5.6 DSP Equity Opportunities Fund Growth ₹624.745
↑ 0.37 ₹17,906 500 3.4 -1.1 2.2 14.6 12.4 7.1 Aditya Birla Sun Life Equity Advantage Fund Growth ₹946.82
↑ 3.57 ₹5,784 1,000 5.5 5.6 6.1 11.7 8.8 3.5 Bandhan Core Equity Fund Growth ₹140.111
↑ 0.12 ₹18,783 100 2 3.5 5.6 18.1 16.6 7.5 Note: Returns up to 1 year are on absolute basis & more than 1 year are on CAGR basis. as on 31 Jul 26 Research Highlights & Commentary of 5 Funds showcased
Commentary Invesco India Growth Opportunities Fund Kotak Equity Opportunities Fund DSP Equity Opportunities Fund Aditya Birla Sun Life Equity Advantage Fund Bandhan Core Equity Fund Point 1 Bottom quartile AUM (₹11,164 Cr). Highest AUM (₹31,263 Cr). Lower mid AUM (₹17,906 Cr). Bottom quartile AUM (₹5,784 Cr). Upper mid AUM (₹18,783 Cr). Point 2 Established history (18+ yrs). Established history (21+ yrs). Established history (26+ yrs). Oldest track record among peers (31 yrs). Established history (20+ yrs). Point 3 Top rated. Rating: 5★ (upper mid). Rating: 5★ (lower mid). Rating: 4★ (bottom quartile). Rating: 4★ (bottom quartile). Point 4 Risk profile: Moderately High. Risk profile: Moderately High. Risk profile: Moderately High. Risk profile: Moderately High. Risk profile: Moderately High. Point 5 5Y return: 17.20% (top quartile). 5Y return: 14.03% (lower mid). 5Y return: 12.42% (bottom quartile). 5Y return: 8.76% (bottom quartile). 5Y return: 16.57% (upper mid). Point 6 3Y return: 22.84% (top quartile). 3Y return: 13.95% (bottom quartile). 3Y return: 14.61% (lower mid). 3Y return: 11.73% (bottom quartile). 3Y return: 18.14% (upper mid). Point 7 1Y return: 8.75% (top quartile). 1Y return: 4.42% (bottom quartile). 1Y return: 2.24% (bottom quartile). 1Y return: 6.15% (upper mid). 1Y return: 5.62% (lower mid). Point 8 Alpha: 6.78 (top quartile). Alpha: 0.20 (lower mid). Alpha: -2.56 (bottom quartile). Alpha: 0.16 (bottom quartile). Alpha: 2.69 (upper mid). Point 9 Sharpe: 0.12 (top quartile). Sharpe: -0.19 (lower mid). Sharpe: -0.35 (bottom quartile). Sharpe: -0.19 (bottom quartile). Sharpe: -0.05 (upper mid). Point 10 Information ratio: 1.15 (upper mid). Information ratio: -0.05 (bottom quartile). Information ratio: 0.20 (lower mid). Information ratio: -0.96 (bottom quartile). Information ratio: 1.42 (top quartile). Invesco India Growth Opportunities Fund
Kotak Equity Opportunities Fund
DSP Equity Opportunities Fund
Aditya Birla Sun Life Equity Advantage Fund
Bandhan Core Equity Fund
ਸਰਬੋਤਮ ਮਿਡ ਕੈਪ ਇਕੁਇਟੀ SIP ਫੰਡ
Fund NAV Net Assets (Cr) Min SIP Investment 3 MO (%) 6 MO (%) 1 YR (%) 3 YR (%) 5 YR (%) 2024 (%) Sundaram Mid Cap Fund Growth ₹1,509.38
↑ 3.96 ₹14,026 100 6.6 8.4 10 20.3 17.9 4.1 Kotak Emerging Equity Scheme Growth ₹145.925
↑ 0.49 ₹67,611 1,000 6.1 10.6 7.2 18.6 16.6 1.8 Taurus Discovery (Midcap) Fund Growth ₹126.43
↑ 0.59 ₹125 1,000 9.8 9.3 4.4 11 12.1 0.8 BNP Paribas Mid Cap Fund Growth ₹111.57
↑ 0.71 ₹2,513 300 4.7 8.2 11.1 17.7 14.8 2.5 Edelweiss Mid Cap Fund Growth ₹108.69
↑ 0.44 ₹17,748 500 5.6 6.5 9.2 21.6 18 3.8 Note: Returns up to 1 year are on absolute basis & more than 1 year are on CAGR basis. as on 31 Jul 26 Research Highlights & Commentary of 5 Funds showcased
Commentary Sundaram Mid Cap Fund Kotak Emerging Equity Scheme Taurus Discovery (Midcap) Fund BNP Paribas Mid Cap Fund Edelweiss Mid Cap Fund Point 1 Lower mid AUM (₹14,026 Cr). Highest AUM (₹67,611 Cr). Bottom quartile AUM (₹125 Cr). Bottom quartile AUM (₹2,513 Cr). Upper mid AUM (₹17,748 Cr). Point 2 Established history (24+ yrs). Established history (19+ yrs). Oldest track record among peers (31 yrs). Established history (20+ yrs). Established history (18+ yrs). Point 3 Top rated. Rating: 4★ (upper mid). Rating: 4★ (lower mid). Rating: 3★ (bottom quartile). Rating: 3★ (bottom quartile). Point 4 Risk profile: Moderately High. Risk profile: Moderately High. Risk profile: Moderately High. Risk profile: High. Risk profile: High. Point 5 5Y return: 17.87% (upper mid). 5Y return: 16.61% (lower mid). 5Y return: 12.12% (bottom quartile). 5Y return: 14.79% (bottom quartile). 5Y return: 17.97% (top quartile). Point 6 3Y return: 20.33% (upper mid). 3Y return: 18.63% (lower mid). 3Y return: 11.04% (bottom quartile). 3Y return: 17.66% (bottom quartile). 3Y return: 21.55% (top quartile). Point 7 1Y return: 9.97% (upper mid). 1Y return: 7.19% (bottom quartile). 1Y return: 4.38% (bottom quartile). 1Y return: 11.06% (top quartile). 1Y return: 9.21% (lower mid). Point 8 Alpha: 0.71 (upper mid). Alpha: 0.70 (lower mid). Alpha: -9.74 (bottom quartile). Alpha: 3.32 (top quartile). Alpha: -1.09 (bottom quartile). Point 9 Sharpe: 0.06 (upper mid). Sharpe: 0.06 (lower mid). Sharpe: -0.32 (bottom quartile). Sharpe: 0.22 (top quartile). Sharpe: -0.04 (bottom quartile). Point 10 Information ratio: 0.32 (upper mid). Information ratio: -0.07 (lower mid). Information ratio: -2.03 (bottom quartile). Information ratio: -0.21 (bottom quartile). Information ratio: 0.48 (top quartile). Sundaram Mid Cap Fund
Kotak Emerging Equity Scheme
Taurus Discovery (Midcap) Fund
BNP Paribas Mid Cap Fund
Edelweiss Mid Cap Fund
ਵਧੀਆ ਸਮਾਲ ਕੈਪ ਇਕੁਇਟੀ SIP ਫੰਡ
Fund NAV Net Assets (Cr) Min SIP Investment 3 MO (%) 6 MO (%) 1 YR (%) 3 YR (%) 5 YR (%) 2024 (%) Aditya Birla Sun Life Small Cap Fund Growth ₹96.6213
↑ 0.64 ₹5,731 1,000 8.8 17.5 12.8 15.1 12.4 -3.7 SBI Small Cap Fund Growth ₹177.456
↓ -0.02 ₹40,157 500 5.7 11.3 2.9 10.9 13.1 -4.9 DSP Small Cap Fund Growth ₹220.438
↑ 0.67 ₹19,635 500 8.9 18.6 10.4 16.3 16.5 -2.8 Nippon India Small Cap Fund Growth ₹179.922
↑ 1.16 ₹78,407 100 5.6 13 6.2 15.9 18.4 -4.7 Franklin India Smaller Companies Fund Growth ₹176.638
↑ 0.36 ₹14,336 500 3.6 11.5 2.2 14 16.1 -8.4 Note: Returns up to 1 year are on absolute basis & more than 1 year are on CAGR basis. as on 31 Jul 26 Research Highlights & Commentary of 5 Funds showcased
Commentary Aditya Birla Sun Life Small Cap Fund SBI Small Cap Fund DSP Small Cap Fund Nippon India Small Cap Fund Franklin India Smaller Companies Fund Point 1 Bottom quartile AUM (₹5,731 Cr). Upper mid AUM (₹40,157 Cr). Lower mid AUM (₹19,635 Cr). Highest AUM (₹78,407 Cr). Bottom quartile AUM (₹14,336 Cr). Point 2 Established history (19+ yrs). Established history (16+ yrs). Established history (19+ yrs). Established history (15+ yrs). Oldest track record among peers (20 yrs). Point 3 Top rated. Rating: 5★ (upper mid). Rating: 4★ (lower mid). Rating: 4★ (bottom quartile). Rating: 4★ (bottom quartile). Point 4 Risk profile: Moderately High. Risk profile: Moderately High. Risk profile: Moderately High. Risk profile: Moderately High. Risk profile: Moderately High. Point 5 5Y return: 12.43% (bottom quartile). 5Y return: 13.14% (bottom quartile). 5Y return: 16.54% (upper mid). 5Y return: 18.43% (top quartile). 5Y return: 16.06% (lower mid). Point 6 3Y return: 15.12% (lower mid). 3Y return: 10.92% (bottom quartile). 3Y return: 16.27% (top quartile). 3Y return: 15.86% (upper mid). 3Y return: 13.99% (bottom quartile). Point 7 1Y return: 12.80% (top quartile). 1Y return: 2.86% (bottom quartile). 1Y return: 10.38% (upper mid). 1Y return: 6.20% (lower mid). 1Y return: 2.17% (bottom quartile). Point 8 Alpha: 0.00 (upper mid). Alpha: 0.00 (lower mid). Alpha: 0.00 (bottom quartile). Alpha: 3.21 (top quartile). Alpha: -0.56 (bottom quartile). Point 9 Sharpe: 0.22 (top quartile). Sharpe: -0.07 (bottom quartile). Sharpe: 0.19 (upper mid). Sharpe: 0.02 (lower mid). Sharpe: -0.15 (bottom quartile). Point 10 Information ratio: 0.00 (top quartile). Information ratio: 0.00 (upper mid). Information ratio: 0.00 (lower mid). Information ratio: -0.27 (bottom quartile). Information ratio: -0.65 (bottom quartile). Aditya Birla Sun Life Small Cap Fund
SBI Small Cap Fund
DSP Small Cap Fund
Nippon India Small Cap Fund
Franklin India Smaller Companies Fund
ਸਰਬੋਤਮ ਮਲਟੀ ਕੈਪ ਇਕੁਇਟੀ SIP ਫੰਡ
Fund NAV Net Assets (Cr) Min SIP Investment 3 MO (%) 6 MO (%) 1 YR (%) 3 YR (%) 5 YR (%) 2024 (%) Kotak Standard Multicap Fund Growth ₹85.846
↑ 0.38 ₹55,850 500 3 -1 1.6 12.3 11.6 9.5 Mirae Asset India Equity Fund Growth ₹113.181
↑ 0.23 ₹38,379 1,000 4.3 -0.3 0.9 9.1 9.4 10.2 Motilal Oswal Multicap 35 Fund Growth ₹61.5094
↑ 0.31 ₹13,294 500 10.5 7 -0.3 18.7 12.4 -5.6 BNP Paribas Multi Cap Fund Growth ₹73.5154
↓ -0.01 ₹588 300 -4.6 -2.6 19.3 17.3 13.6 Aditya Birla Sun Life Equity Fund Growth ₹1,952
↑ 5.59 ₹26,727 100 7 6.3 10.2 15.3 12.6 11.2 Note: Returns up to 1 year are on absolute basis & more than 1 year are on CAGR basis. as on 31 Jul 26 Research Highlights & Commentary of 5 Funds showcased
Commentary Kotak Standard Multicap Fund Mirae Asset India Equity Fund Motilal Oswal Multicap 35 Fund BNP Paribas Multi Cap Fund Aditya Birla Sun Life Equity Fund Point 1 Highest AUM (₹55,850 Cr). Upper mid AUM (₹38,379 Cr). Bottom quartile AUM (₹13,294 Cr). Bottom quartile AUM (₹588 Cr). Lower mid AUM (₹26,727 Cr). Point 2 Established history (16+ yrs). Established history (18+ yrs). Established history (12+ yrs). Established history (20+ yrs). Oldest track record among peers (27 yrs). Point 3 Top rated. Rating: 5★ (upper mid). Rating: 5★ (lower mid). Rating: 4★ (bottom quartile). Rating: 4★ (bottom quartile). Point 4 Risk profile: Moderately High. Risk profile: Moderately High. Risk profile: Moderately High. Risk profile: Moderately High. Risk profile: Moderately High. Point 5 5Y return: 11.57% (bottom quartile). 5Y return: 9.37% (bottom quartile). 5Y return: 12.41% (lower mid). 5Y return: 13.57% (top quartile). 5Y return: 12.59% (upper mid). Point 6 3Y return: 12.31% (bottom quartile). 3Y return: 9.06% (bottom quartile). 3Y return: 18.75% (top quartile). 3Y return: 17.28% (upper mid). 3Y return: 15.29% (lower mid). Point 7 1Y return: 1.57% (lower mid). 1Y return: 0.85% (bottom quartile). 1Y return: -0.33% (bottom quartile). 1Y return: 19.34% (top quartile). 1Y return: 10.17% (upper mid). Point 8 Alpha: -1.04 (bottom quartile). Alpha: 0.72 (upper mid). Alpha: -7.36 (bottom quartile). Alpha: 0.00 (lower mid). Alpha: 4.61 (top quartile). Point 9 Sharpe: -0.38 (lower mid). Sharpe: -0.42 (bottom quartile). Sharpe: -0.74 (bottom quartile). Sharpe: 2.86 (top quartile). Sharpe: -0.05 (upper mid). Point 10 Information ratio: 0.11 (lower mid). Information ratio: -0.47 (bottom quartile). Information ratio: 0.53 (upper mid). Information ratio: 0.00 (bottom quartile). Information ratio: 1.19 (top quartile). Kotak Standard Multicap Fund
Mirae Asset India Equity Fund
Motilal Oswal Multicap 35 Fund
BNP Paribas Multi Cap Fund
Aditya Birla Sun Life Equity Fund
ਸਰਬੋਤਮ ਸੈਕਟਰ ਇਕੁਇਟੀ SIP ਫੰਡ
Fund NAV Net Assets (Cr) Min SIP Investment 3 MO (%) 6 MO (%) 1 YR (%) 3 YR (%) 5 YR (%) 2024 (%) DSP Natural Resources and New Energy Fund Growth ₹106.327
↑ 0.33 ₹2,401 500 -4.7 0.4 18.3 19.2 15 17.5 Aditya Birla Sun Life Banking And Financial Services Fund Growth ₹63.22
↑ 0.50 ₹3,676 1,000 3.6 -0.6 5 10.3 11.5 17.5 Franklin Build India Fund Growth ₹144.394
↑ 0.99 ₹3,256 500 -2 1.9 1.9 18.1 19.7 3.7 Bandhan Infrastructure Fund Growth ₹49.429
↑ 0.28 ₹1,545 100 1.5 7.9 -1.5 16.2 16.4 -6.9 Sundaram Rural and Consumption Fund Growth ₹95.1263
↑ 0.10 ₹1,422 100 6 4.8 -2.2 10.6 11.7 -0.1 Note: Returns up to 1 year are on absolute basis & more than 1 year are on CAGR basis. as on 30 Jul 26 Research Highlights & Commentary of 5 Funds showcased
Commentary DSP Natural Resources and New Energy Fund Aditya Birla Sun Life Banking And Financial Services Fund Franklin Build India Fund Bandhan Infrastructure Fund Sundaram Rural and Consumption Fund Point 1 Lower mid AUM (₹2,401 Cr). Highest AUM (₹3,676 Cr). Upper mid AUM (₹3,256 Cr). Bottom quartile AUM (₹1,545 Cr). Bottom quartile AUM (₹1,422 Cr). Point 2 Established history (18+ yrs). Established history (12+ yrs). Established history (16+ yrs). Established history (15+ yrs). Oldest track record among peers (20 yrs). Point 3 Top rated. Rating: 5★ (upper mid). Rating: 5★ (lower mid). Rating: 5★ (bottom quartile). Rating: 5★ (bottom quartile). Point 4 Risk profile: High. Risk profile: High. Risk profile: High. Risk profile: High. Risk profile: Moderately High. Point 5 5Y return: 14.99% (lower mid). 5Y return: 11.51% (bottom quartile). 5Y return: 19.68% (top quartile). 5Y return: 16.44% (upper mid). 5Y return: 11.75% (bottom quartile). Point 6 3Y return: 19.21% (top quartile). 3Y return: 10.29% (bottom quartile). 3Y return: 18.05% (upper mid). 3Y return: 16.23% (lower mid). 3Y return: 10.63% (bottom quartile). Point 7 1Y return: 18.33% (top quartile). 1Y return: 4.98% (upper mid). 1Y return: 1.90% (lower mid). 1Y return: -1.52% (bottom quartile). 1Y return: -2.17% (bottom quartile). Point 8 Alpha: 0.00 (upper mid). Alpha: 3.47 (top quartile). Alpha: 0.00 (lower mid). Alpha: 0.00 (bottom quartile). Alpha: -6.29 (bottom quartile). Point 9 Sharpe: 0.72 (top quartile). Sharpe: -0.06 (lower mid). Sharpe: -0.04 (upper mid). Sharpe: -0.25 (bottom quartile). Sharpe: -0.67 (bottom quartile). Point 10 Information ratio: 0.00 (upper mid). Information ratio: 0.24 (top quartile). Information ratio: 0.00 (lower mid). Information ratio: 0.00 (bottom quartile). Information ratio: -0.56 (bottom quartile). DSP Natural Resources and New Energy Fund
Aditya Birla Sun Life Banking And Financial Services Fund
Franklin Build India Fund
Bandhan Infrastructure Fund
Sundaram Rural and Consumption Fund
ਵਧੀਆ ELSS SIP ਫੰਡ
Fund NAV Net Assets (Cr) Min SIP Investment 3 MO (%) 6 MO (%) 1 YR (%) 3 YR (%) 5 YR (%) 2024 (%) Tata India Tax Savings Fund Growth ₹46.8846
↑ 0.31 ₹4,597 500 4.4 5.1 6.6 12.4 13 4.9 Bandhan Tax Advantage (ELSS) Fund Growth ₹155.975
↑ 0.18 ₹6,911 500 3.6 1.5 3.8 9.9 12 8 Aditya Birla Sun Life Tax Relief '96 Growth ₹62.25
↑ 0.18 ₹14,467 500 4 1.8 3.1 11.9 8.9 9.3 DSP Tax Saver Fund Growth ₹139.786
↑ 0.25 ₹16,562 500 3.1 -1.7 0.9 14.1 12.7 7.5 HDFC Long Term Advantage Fund Growth ₹595.168
↑ 0.28 ₹1,318 500 1.2 15.4 35.5 20.6 17.4 Note: Returns up to 1 year are on absolute basis & more than 1 year are on CAGR basis. as on 31 Jul 26 Research Highlights & Commentary of 5 Funds showcased
Commentary Tata India Tax Savings Fund Bandhan Tax Advantage (ELSS) Fund Aditya Birla Sun Life Tax Relief '96 DSP Tax Saver Fund HDFC Long Term Advantage Fund Point 1 Bottom quartile AUM (₹4,597 Cr). Lower mid AUM (₹6,911 Cr). Upper mid AUM (₹14,467 Cr). Highest AUM (₹16,562 Cr). Bottom quartile AUM (₹1,318 Cr). Point 2 Established history (11+ yrs). Established history (17+ yrs). Established history (18+ yrs). Established history (19+ yrs). Oldest track record among peers (25 yrs). Point 3 Top rated. Rating: 5★ (upper mid). Rating: 4★ (lower mid). Rating: 4★ (bottom quartile). Rating: 3★ (bottom quartile). Point 4 Risk profile: Moderately High. Risk profile: Moderately High. Risk profile: Moderately High. Risk profile: Moderately High. Risk profile: Moderately High. Point 5 5Y return: 13.00% (upper mid). 5Y return: 12.04% (bottom quartile). 5Y return: 8.94% (bottom quartile). 5Y return: 12.66% (lower mid). 5Y return: 17.39% (top quartile). Point 6 3Y return: 12.37% (lower mid). 3Y return: 9.90% (bottom quartile). 3Y return: 11.86% (bottom quartile). 3Y return: 14.14% (upper mid). 3Y return: 20.64% (top quartile). Point 7 1Y return: 6.56% (upper mid). 1Y return: 3.77% (lower mid). 1Y return: 3.13% (bottom quartile). 1Y return: 0.87% (bottom quartile). 1Y return: 35.51% (top quartile). Point 8 Alpha: 4.23 (top quartile). Alpha: 0.89 (lower mid). Alpha: 0.31 (bottom quartile). Alpha: -1.27 (bottom quartile). Alpha: 1.75 (upper mid). Point 9 Sharpe: -0.09 (upper mid). Sharpe: -0.29 (lower mid). Sharpe: -0.30 (bottom quartile). Sharpe: -0.39 (bottom quartile). Sharpe: 2.27 (top quartile). Point 10 Information ratio: 0.22 (upper mid). Information ratio: -0.51 (bottom quartile). Information ratio: -0.24 (bottom quartile). Information ratio: 0.70 (top quartile). Information ratio: -0.15 (lower mid). Tata India Tax Savings Fund
Bandhan Tax Advantage (ELSS) Fund
Aditya Birla Sun Life Tax Relief '96
DSP Tax Saver Fund
HDFC Long Term Advantage Fund
ਵਧੀਆ ਮੁੱਲ ਇਕੁਇਟੀ SIP ਫੰਡ
Fund NAV Net Assets (Cr) Min SIP Investment 3 MO (%) 6 MO (%) 1 YR (%) 3 YR (%) 5 YR (%) 2024 (%) Tata Equity PE Fund Growth ₹350.267
↑ 1.39 ₹8,342 150 1.8 -1.1 1.8 12.7 14.3 3.7 JM Value Fund Growth ₹94.6417
↑ 0.51 ₹823 500 3.2 3 -3 12.2 14.7 -4.4 Aditya Birla Sun Life Pure Value Fund Growth ₹135.586
↓ -0.14 ₹6,603 1,000 5.3 7.4 10.8 15.4 14.2 2.6 HDFC Capital Builder Value Fund Growth ₹788.576
↑ 2.63 ₹7,583 300 6.1 4.5 6.8 15.8 14.6 8.6 Bandhan Sterling Value Fund Growth ₹147.847
↓ -0.01 ₹9,985 100 2.3 0.1 1.6 10.5 12.9 5 Note: Returns up to 1 year are on absolute basis & more than 1 year are on CAGR basis. as on 31 Jul 26 Research Highlights & Commentary of 5 Funds showcased
Commentary Tata Equity PE Fund JM Value Fund Aditya Birla Sun Life Pure Value Fund HDFC Capital Builder Value Fund Bandhan Sterling Value Fund Point 1 Upper mid AUM (₹8,342 Cr). Bottom quartile AUM (₹823 Cr). Bottom quartile AUM (₹6,603 Cr). Lower mid AUM (₹7,583 Cr). Highest AUM (₹9,985 Cr). Point 2 Established history (22+ yrs). Established history (29+ yrs). Established history (18+ yrs). Oldest track record among peers (32 yrs). Established history (18+ yrs). Point 3 Top rated. Rating: 4★ (upper mid). Rating: 3★ (lower mid). Rating: 3★ (bottom quartile). Rating: 3★ (bottom quartile). Point 4 Risk profile: Moderately High. Risk profile: High. Risk profile: Moderately High. Risk profile: Moderately High. Risk profile: Moderately High. Point 5 5Y return: 14.28% (lower mid). 5Y return: 14.66% (top quartile). 5Y return: 14.16% (bottom quartile). 5Y return: 14.64% (upper mid). 5Y return: 12.88% (bottom quartile). Point 6 3Y return: 12.74% (lower mid). 3Y return: 12.24% (bottom quartile). 3Y return: 15.40% (upper mid). 3Y return: 15.84% (top quartile). 3Y return: 10.46% (bottom quartile). Point 7 1Y return: 1.79% (lower mid). 1Y return: -3.00% (bottom quartile). 1Y return: 10.76% (top quartile). 1Y return: 6.80% (upper mid). 1Y return: 1.56% (bottom quartile). Point 8 Alpha: -2.09 (bottom quartile). Alpha: -1.90 (bottom quartile). Alpha: 6.28 (top quartile). Alpha: 3.42 (upper mid). Alpha: -0.78 (lower mid). Point 9 Sharpe: -0.45 (bottom quartile). Sharpe: -0.42 (bottom quartile). Sharpe: 0.01 (top quartile). Sharpe: -0.13 (upper mid). Sharpe: -0.39 (lower mid). Point 10 Information ratio: 0.23 (bottom quartile). Information ratio: 0.30 (lower mid). Information ratio: 0.70 (upper mid). Information ratio: 1.47 (top quartile). Information ratio: -0.16 (bottom quartile). Tata Equity PE Fund
JM Value Fund
Aditya Birla Sun Life Pure Value Fund
HDFC Capital Builder Value Fund
Bandhan Sterling Value Fund
ਸਰਬੋਤਮ ਫੋਕਸਡ ਇਕੁਇਟੀ SIP ਫੰਡ
Fund NAV Net Assets (Cr) Min SIP Investment 3 MO (%) 6 MO (%) 1 YR (%) 3 YR (%) 5 YR (%) 2024 (%) Axis Focused 25 Fund Growth ₹55.82
↑ 0.73 ₹11,078 500 8.9 6.5 1.6 9.4 5.8 2.5 Aditya Birla Sun Life Focused Equity Fund Growth ₹148.816
↑ 0.46 ₹7,855 1,000 5.6 1.4 6.8 13.4 12.2 10.1 Sundaram Select Focus Fund Growth ₹264.968
↓ -1.18 ₹1,354 100 -5 8.5 24.5 17 17.3 Motilal Oswal Focused 25 Fund Growth ₹50.3259
↑ 0.64 ₹1,635 500 12.4 18.6 16.6 11.6 9.9 -1.7 HDFC Focused 30 Fund Growth ₹234.77
↑ 0.13 ₹27,303 300 5.5 0.3 3.1 15.9 18.4 10.9 Note: Returns up to 1 year are on absolute basis & more than 1 year are on CAGR basis. as on 31 Jul 26 Research Highlights & Commentary of 5 Funds showcased
Commentary Axis Focused 25 Fund Aditya Birla Sun Life Focused Equity Fund Sundaram Select Focus Fund Motilal Oswal Focused 25 Fund HDFC Focused 30 Fund Point 1 Upper mid AUM (₹11,078 Cr). Lower mid AUM (₹7,855 Cr). Bottom quartile AUM (₹1,354 Cr). Bottom quartile AUM (₹1,635 Cr). Highest AUM (₹27,303 Cr). Point 2 Established history (14+ yrs). Established history (20+ yrs). Oldest track record among peers (24 yrs). Established history (13+ yrs). Established history (21+ yrs). Point 3 Top rated. Rating: 4★ (upper mid). Rating: 3★ (lower mid). Rating: 3★ (bottom quartile). Rating: 3★ (bottom quartile). Point 4 Risk profile: Moderately High. Risk profile: Moderately High. Risk profile: Moderately High. Risk profile: Moderately High. Risk profile: Moderately High. Point 5 5Y return: 5.82% (bottom quartile). 5Y return: 12.23% (lower mid). 5Y return: 17.29% (upper mid). 5Y return: 9.85% (bottom quartile). 5Y return: 18.36% (top quartile). Point 6 3Y return: 9.44% (bottom quartile). 3Y return: 13.43% (lower mid). 3Y return: 17.03% (top quartile). 3Y return: 11.56% (bottom quartile). 3Y return: 15.86% (upper mid). Point 7 1Y return: 1.58% (bottom quartile). 1Y return: 6.80% (lower mid). 1Y return: 24.49% (top quartile). 1Y return: 16.56% (upper mid). 1Y return: 3.05% (bottom quartile). Point 8 Alpha: -3.54 (bottom quartile). Alpha: -0.11 (upper mid). Alpha: -5.62 (bottom quartile). Alpha: 12.39 (top quartile). Alpha: -0.27 (lower mid). Point 9 Sharpe: -0.52 (bottom quartile). Sharpe: -0.32 (bottom quartile). Sharpe: 1.85 (top quartile). Sharpe: 0.35 (upper mid). Sharpe: -0.32 (lower mid). Point 10 Information ratio: -0.78 (bottom quartile). Information ratio: 0.12 (upper mid). Information ratio: -0.52 (bottom quartile). Information ratio: -0.21 (lower mid). Information ratio: 0.67 (top quartile). Axis Focused 25 Fund
Aditya Birla Sun Life Focused Equity Fund
Sundaram Select Focus Fund
Motilal Oswal Focused 25 Fund
HDFC Focused 30 Fund
ਇਕੁਇਟੀ ਫੰਡਾਂ 'ਤੇ ਟੈਕਸ
ਬਜਟ 2018 ਦੇ ਭਾਸ਼ਣ ਦੇ ਅਨੁਸਾਰ, ਇੱਕ ਨਵੀਂ ਲੰਬੀ ਮਿਆਦਪੂੰਜੀ ਇਕੁਇਟੀ ਓਰੀਐਂਟਿਡ 'ਤੇ ਲਾਭ (LTCG) ਟੈਕਸਮਿਉਚੁਅਲ ਫੰਡ ਅਤੇ ਸਟਾਕ 1 ਅਪ੍ਰੈਲ ਤੋਂ ਲਾਗੂ ਹੋਣਗੇ। ਵਿੱਤ ਬਿੱਲ 2018 14 ਮਾਰਚ 2018 ਨੂੰ ਲੋਕ ਸਭਾ ਵਿੱਚ ਜ਼ੁਬਾਨੀ ਵੋਟ ਦੁਆਰਾ ਪਾਸ ਕੀਤਾ ਗਿਆ ਸੀ। ਇਹ ਹੈ ਨਵਾਂ ਕਿਵੇਂਆਮਦਨ ਟੈਕਸ ਤਬਦੀਲੀਆਂ 1 ਅਪ੍ਰੈਲ 2018 ਤੋਂ ਇਕੁਇਟੀ ਨਿਵੇਸ਼ਾਂ ਨੂੰ ਪ੍ਰਭਾਵਤ ਕਰਨਗੀਆਂ। *
1. ਲੰਬੀ ਮਿਆਦ ਦੇ ਪੂੰਜੀ ਲਾਭ
ਤੋਂ ਪੈਦਾ ਹੋਏ INR 1 ਲੱਖ ਤੋਂ ਵੱਧ ਦੇ LTCGsਛੁਟਕਾਰਾ 1 ਅਪ੍ਰੈਲ 2018 ਨੂੰ ਜਾਂ ਇਸ ਤੋਂ ਬਾਅਦ ਮਿਉਚੁਅਲ ਫੰਡ ਯੂਨਿਟਾਂ ਜਾਂ ਇਕੁਇਟੀਜ਼ 'ਤੇ 10 ਪ੍ਰਤੀਸ਼ਤ (ਪਲੱਸ ਸੈੱਸ) ਜਾਂ 10.4 ਪ੍ਰਤੀਸ਼ਤ ਟੈਕਸ ਲਗਾਇਆ ਜਾਵੇਗਾ। ਲੰਮਾ ਸਮਾਂਪੂੰਜੀ ਲਾਭ INR 1 ਲੱਖ ਤੱਕ ਛੋਟ ਹੋਵੇਗੀ। ਉਦਾਹਰਨ ਲਈ, ਜੇਕਰ ਤੁਸੀਂ ਇੱਕ ਵਿੱਤੀ ਸਾਲ ਵਿੱਚ ਸਟਾਕਾਂ ਜਾਂ ਮਿਉਚੁਅਲ ਫੰਡ ਨਿਵੇਸ਼ਾਂ ਤੋਂ ਸੰਯੁਕਤ ਲੰਬੇ ਸਮੇਂ ਦੇ ਪੂੰਜੀ ਲਾਭ ਵਿੱਚ INR 3 ਲੱਖ ਕਮਾਉਂਦੇ ਹੋ। ਟੈਕਸਯੋਗ LTCGs INR 2 ਲੱਖ (INR 3 ਲੱਖ - 1 ਲੱਖ) ਅਤੇਟੈਕਸ ਦੇਣਦਾਰੀ 20 ਰੁਪਏ ਹੋਵੇਗਾ,000 (INR 2 ਲੱਖ ਦਾ 10 ਪ੍ਰਤੀਸ਼ਤ)।
ਲੰਬੇ ਸਮੇਂ ਦੇ ਪੂੰਜੀ ਲਾਭ ਨੂੰ ਵੇਚਣ ਜਾਂ ਛੁਡਾਉਣ ਤੋਂ ਪੈਦਾ ਹੋਣ ਵਾਲੇ ਲਾਭ ਹਨਇਕੁਇਟੀ ਫੰਡ ਇੱਕ ਸਾਲ ਤੋਂ ਵੱਧ ਆਯੋਜਿਤ ਕੀਤਾ ਗਿਆ।
2. ਛੋਟੀ ਮਿਆਦ ਦੇ ਪੂੰਜੀ ਲਾਭ
ਜੇਕਰ ਮਿਉਚੁਅਲ ਫੰਡ ਯੂਨਿਟਾਂ ਹੋਲਡਿੰਗ ਦੇ ਇੱਕ ਸਾਲ ਤੋਂ ਪਹਿਲਾਂ ਵੇਚੀਆਂ ਜਾਂਦੀਆਂ ਹਨ, ਤਾਂ ਸ਼ਾਰਟ ਟਰਮ ਕੈਪੀਟਲ ਗੇਨ (STCGs) ਟੈਕਸ ਲਾਗੂ ਹੋਵੇਗਾ। STCGs ਟੈਕਸ ਨੂੰ 15 ਫੀਸਦੀ 'ਤੇ ਬਰਕਰਾਰ ਰੱਖਿਆ ਗਿਆ ਹੈ।
| ਇਕੁਇਟੀ ਸਕੀਮਾਂ | ਹੋਲਡਿੰਗ ਪੀਰੀਅਡ | ਟੈਕਸ ਦੀ ਦਰ |
|---|---|---|
| ਲੰਬੀ ਮਿਆਦ ਦੇ ਪੂੰਜੀ ਲਾਭ (LTCG) | 1 ਸਾਲ ਤੋਂ ਵੱਧ | 10% (ਬਿਨਾਂ ਸੂਚਕਾਂਕ)***** |
| ਛੋਟੀ ਮਿਆਦ ਦੇ ਪੂੰਜੀ ਲਾਭ (STCG) | ਇੱਕ ਸਾਲ ਤੋਂ ਘੱਟ ਜਾਂ ਬਰਾਬਰ | 15% |
| ਵੰਡੇ ਹੋਏ ਲਾਭਅੰਸ਼ 'ਤੇ ਟੈਕਸ | - | 10%# |
*1 ਲੱਖ ਰੁਪਏ ਤੱਕ ਦੇ ਲਾਭ ਟੈਕਸ ਮੁਕਤ ਹਨ। INR 1 ਲੱਖ ਤੋਂ ਵੱਧ ਦੇ ਲਾਭਾਂ 'ਤੇ 10% ਟੈਕਸ ਲਾਗੂ ਹੁੰਦਾ ਹੈ। ਪਹਿਲਾਂ ਦੀ ਦਰ 31 ਜਨਵਰੀ, 2018 ਨੂੰ ਸਮਾਪਤੀ ਕੀਮਤ ਵਜੋਂ 0% ਲਾਗਤ ਦੀ ਗਣਨਾ ਕੀਤੀ ਗਈ ਸੀ। #10% ਦਾ ਲਾਭਅੰਸ਼ ਟੈਕਸ + ਸਰਚਾਰਜ 12% + ਉਪਕਰ 4% = 11.648% 4% ਦਾ ਸਿਹਤ ਅਤੇ ਸਿੱਖਿਆ ਸੈੱਸ ਪੇਸ਼ ਕੀਤਾ ਗਿਆ। ਪਹਿਲਾਂ ਸਿੱਖਿਆ ਸੈੱਸ 3 ਸੀ%
SIP ਨਿਵੇਸ਼ ਦੇ ਲਾਭ
ਕੁਝ ਮਹੱਤਵਪੂਰਨਪ੍ਰਣਾਲੀਗਤ ਨਿਵੇਸ਼ ਯੋਜਨਾਵਾਂ ਦੇ ਲਾਭ ਹਨ:
ਰੁਪਿਆ ਲਾਗਤ ਔਸਤ
ਇੱਕ SIP ਪੇਸ਼ਕਸ਼ ਦਾ ਇੱਕ ਸਭ ਤੋਂ ਵੱਡਾ ਫਾਇਦਾ ਰੁਪਈਆ ਲਾਗਤ ਔਸਤ ਹੈ, ਜੋ ਇੱਕ ਵਿਅਕਤੀ ਨੂੰ ਸੰਪੱਤੀ ਦੀ ਖਰੀਦ ਦੀ ਲਾਗਤ ਨੂੰ ਔਸਤ ਕਰਨ ਵਿੱਚ ਮਦਦ ਕਰਦਾ ਹੈ। ਇੱਕ ਮਿਉਚੁਅਲ ਫੰਡ ਵਿੱਚ ਇੱਕਮੁਸ਼ਤ ਨਿਵੇਸ਼ ਕਰਦੇ ਸਮੇਂ ਦੁਆਰਾ ਇੱਕ ਨਿਸ਼ਚਿਤ ਗਿਣਤੀ ਵਿੱਚ ਯੂਨਿਟ ਖਰੀਦੇ ਜਾਂਦੇ ਹਨਨਿਵੇਸ਼ਕ ਇੱਕ ਵਾਰ ਵਿੱਚ, ਇੱਕ SIP ਦੇ ਮਾਮਲੇ ਵਿੱਚ, ਯੂਨਿਟਾਂ ਦੀ ਖਰੀਦ ਲੰਬੇ ਸਮੇਂ ਲਈ ਕੀਤੀ ਜਾਂਦੀ ਹੈ ਅਤੇ ਇਹ ਮਾਸਿਕ ਅੰਤਰਾਲਾਂ (ਆਮ ਤੌਰ 'ਤੇ) ਵਿੱਚ ਬਰਾਬਰ ਫੈਲ ਜਾਂਦੀਆਂ ਹਨ। ਸਮੇਂ ਦੇ ਨਾਲ ਨਿਵੇਸ਼ ਨੂੰ ਫੈਲਾਏ ਜਾਣ ਦੇ ਕਾਰਨ, ਨਿਵੇਸ਼ ਨੂੰ ਵੱਖ-ਵੱਖ ਕੀਮਤ ਬਿੰਦੂਆਂ 'ਤੇ ਸਟਾਕ ਮਾਰਕੀਟ ਵਿੱਚ ਕੀਤਾ ਜਾਂਦਾ ਹੈ, ਜਿਸ ਨਾਲ ਨਿਵੇਸ਼ਕ ਨੂੰ ਔਸਤ ਲਾਗਤ ਦਾ ਲਾਭ ਮਿਲਦਾ ਹੈ, ਇਸਲਈ ਰੁਪਿਆ ਲਾਗਤ ਔਸਤ ਦੀ ਮਿਆਦ।
ਮਿਸ਼ਰਿਤ ਕਰਨ ਦੀ ਸ਼ਕਤੀ
SIPs ਦੇ ਲਾਭ ਦੀ ਪੇਸ਼ਕਸ਼ ਕਰਦੇ ਹਨਮਿਸ਼ਰਿਤ ਕਰਨ ਦੀ ਸ਼ਕਤੀ. ਸਧਾਰਨ ਵਿਆਜ ਉਦੋਂ ਹੁੰਦਾ ਹੈ ਜਦੋਂ ਤੁਸੀਂ ਸਿਰਫ਼ ਮੂਲ 'ਤੇ ਵਿਆਜ ਪ੍ਰਾਪਤ ਕਰਦੇ ਹੋ। ਮਿਸ਼ਰਿਤ ਵਿਆਜ ਦੇ ਮਾਮਲੇ ਵਿੱਚ, ਵਿਆਜ ਦੀ ਰਕਮ ਨੂੰ ਮੂਲ ਵਿੱਚ ਜੋੜਿਆ ਜਾਂਦਾ ਹੈ, ਅਤੇ ਵਿਆਜ ਦੀ ਗਣਨਾ ਨਵੇਂ ਮੂਲ (ਪੁਰਾਣੇ ਮੂਲ ਦੇ ਨਾਲ ਲਾਭ) 'ਤੇ ਕੀਤੀ ਜਾਂਦੀ ਹੈ। ਇਹ ਸਿਲਸਿਲਾ ਹਰ ਵਾਰ ਜਾਰੀ ਰਹਿੰਦਾ ਹੈ। ਕਿਉਂਕਿ SIP ਵਿੱਚ ਮਿਉਚੁਅਲ ਫੰਡ ਕਿਸ਼ਤਾਂ ਵਿੱਚ ਹੁੰਦੇ ਹਨ, ਉਹ ਮਿਸ਼ਰਿਤ ਹੁੰਦੇ ਹਨ, ਜੋ ਸ਼ੁਰੂਆਤੀ ਨਿਵੇਸ਼ ਕੀਤੀ ਰਕਮ ਵਿੱਚ ਹੋਰ ਵਾਧਾ ਕਰਦਾ ਹੈ।
ਸਮਰੱਥਾ
SIPs ਬਹੁਤ ਕਿਫਾਇਤੀ ਹਨ. SIP ਵਿੱਚ ਮਾਸਿਕ ਘੱਟੋ-ਘੱਟ ਨਿਵੇਸ਼ ਦੀ ਰਕਮ INR 500 ਤੋਂ ਘੱਟ ਹੋ ਸਕਦੀ ਹੈ। ਕੁਝ ਫੰਡ ਹਾਊਸ, "ਮਾਈਕ੍ਰੋਸਿਪ" ਨਾਮਕ ਚੀਜ਼ ਦੀ ਪੇਸ਼ਕਸ਼ ਵੀ ਕਰਦੇ ਹਨ ਜਿੱਥੇ ਟਿਕਟ ਦਾ ਆਕਾਰ INR 100 ਤੋਂ ਘੱਟ ਹੁੰਦਾ ਹੈ। ਇਹ ਨੌਜਵਾਨਾਂ ਨੂੰ ਆਪਣੀ ਲੰਬੀ ਸ਼ੁਰੂਆਤ ਕਰਨ ਲਈ ਇੱਕ ਵਧੀਆ ਵਿਕਲਪ ਦਿੰਦਾ ਹੈ। - ਜੀਵਨ ਦੇ ਸ਼ੁਰੂਆਤੀ ਪੜਾਅ 'ਤੇ ਮਿਆਦੀ ਨਿਵੇਸ਼।
SIP ਕੈਲਕੁਲੇਟਰ
SIP ਕੈਲਕੁਲੇਟਰ ਤੁਹਾਡੇ ਨਿਵੇਸ਼ ਵਿੱਚ ਸਭ ਤੋਂ ਲਾਭਦਾਇਕ ਸਾਧਨ ਹੋ ਸਕਦਾ ਹੈ। ਇਹ ਉਸ ਸਮੇਂ ਤੱਕ ਤੁਹਾਡੇ SIP ਨਿਵੇਸ਼ ਲਈ ਵਾਧੇ ਦਾ ਅਨੁਮਾਨ ਲਗਾਉਂਦਾ ਹੈ ਜਦੋਂ ਤੱਕ ਤੁਸੀਂ ਨਿਵੇਸ਼ ਕਰਨਾ ਚਾਹੁੰਦੇ ਹੋ। ਇਸ ਲਈ, ਪਹਿਲਾਂ ਵੀਨਿਵੇਸ਼ ਇੱਕ ਫੰਡ ਵਿੱਚ, ਕੋਈ ਆਪਣੀ ਕੁੱਲ SIP ਨੂੰ ਪਹਿਲਾਂ ਤੋਂ ਨਿਰਧਾਰਤ ਕਰ ਸਕਦਾ ਹੈਕਮਾਈਆਂ SIP ਕੈਲਕੁਲੇਟਰ ਦੁਆਰਾ। ਕੈਲਕੂਲੇਟਰ ਆਮ ਤੌਰ 'ਤੇ ਇਨਪੁਟ ਲੈਂਦੇ ਹਨ ਜਿਵੇਂ ਕਿ SIP ਨਿਵੇਸ਼ ਦੀ ਰਕਮ ਜੋ ਨਿਵੇਸ਼ ਕਰਨਾ ਚਾਹੁੰਦਾ ਹੈ, ਨਿਵੇਸ਼ ਦੀ ਮਿਆਦ, ਉਮੀਦ ਕੀਤੀ ਜਾਂਦੀ ਹੈਮਹਿੰਗਾਈ ਦਰਾਂ (ਇੱਕ ਨੂੰ ਇਸ ਲਈ ਲੇਖਾ ਦੇਣਾ ਚਾਹੀਦਾ ਹੈ)। ਇਸ ਦੀ ਉਦਾਹਰਣ ਹੇਠਾਂ ਦਿੱਤੀ ਗਈ ਹੈ:
ਮੰਨ ਲਓ, ਜੇਕਰ ਤੁਸੀਂ 10 ਸਾਲਾਂ ਲਈ INR 5,000 ਦਾ ਨਿਵੇਸ਼ ਕਰਦੇ ਹੋ, ਤਾਂ ਦੇਖੋ ਕਿ ਤੁਹਾਡਾ SIP ਨਿਵੇਸ਼ ਕਿਵੇਂ ਵਧਦਾ ਹੈ-
ਮਹੀਨਾਵਾਰ ਨਿਵੇਸ਼: INR 5,000
ਨਿਵੇਸ਼ ਦੀ ਮਿਆਦ: 10 ਸਾਲ
ਨਿਵੇਸ਼ ਕੀਤੀ ਗਈ ਕੁੱਲ ਰਕਮ: INR 6,00,000
ਲੰਬੇ ਸਮੇਂ ਦੀ ਵਿਕਾਸ ਦਰ (ਲਗਭਗ): 14%
SIP ਕੈਲਕੁਲੇਟਰ ਦੇ ਅਨੁਸਾਰ ਸੰਭਾਵਿਤ ਰਿਟਰਨ: 12,46,462 ਰੁਪਏ
ਕੁੱਲ ਲਾਭ: 6,46,462 ਰੁਪਏ
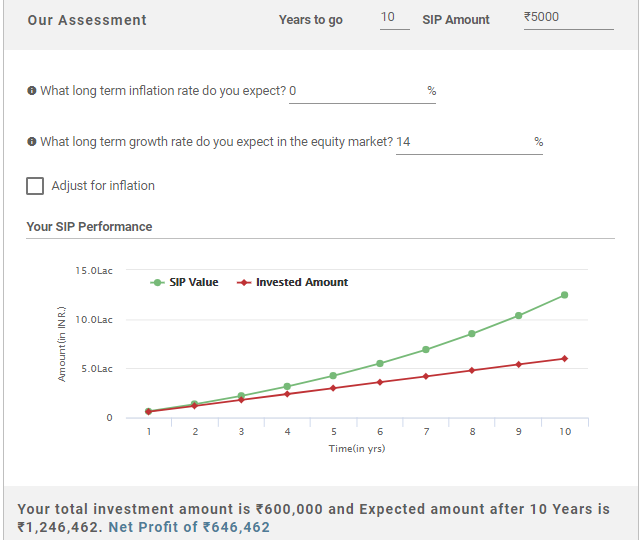
ਉਪਰੋਕਤ ਗਣਨਾਵਾਂ ਦਿਖਾਉਂਦੀਆਂ ਹਨ ਕਿ ਜੇਕਰ ਤੁਸੀਂ 10 ਸਾਲਾਂ ਲਈ INR 5,000 ਮਹੀਨਾਵਾਰ ਨਿਵੇਸ਼ ਕਰਦੇ ਹੋ (ਕੁੱਲ INR 6,00,000) ਤਾਂ ਤੁਸੀਂ ਕਮਾਓਗੇINR 12,46,462 ਜਿਸਦਾ ਮਤਲਬ ਹੈ ਕਿ ਤੁਸੀਂ ਜੋ ਸ਼ੁੱਧ ਲਾਭ ਕਮਾਉਂਦੇ ਹੋ6,46,462 ਰੁਪਏ ਕੀ ਇਹ ਬਹੁਤ ਵਧੀਆ ਨਹੀਂ ਹੈ!
ਇਹ ਯਕੀਨੀ ਬਣਾਉਣ ਲਈ ਸਾਰੇ ਯਤਨ ਕੀਤੇ ਗਏ ਹਨ ਕਿ ਇੱਥੇ ਦਿੱਤੀ ਗਈ ਜਾਣਕਾਰੀ ਸਹੀ ਹੈ। ਹਾਲਾਂਕਿ, ਡੇਟਾ ਦੀ ਸ਼ੁੱਧਤਾ ਬਾਰੇ ਕੋਈ ਗਾਰੰਟੀ ਨਹੀਂ ਦਿੱਤੀ ਗਈ ਹੈ। ਕਿਰਪਾ ਕਰਕੇ ਕੋਈ ਵੀ ਨਿਵੇਸ਼ ਕਰਨ ਤੋਂ ਪਹਿਲਾਂ ਸਕੀਮ ਜਾਣਕਾਰੀ ਦਸਤਾਵੇਜ਼ ਨਾਲ ਤਸਦੀਕ ਕਰੋ।


AMFI Registration No. 112358 | CIN: U74999MH2016PTC282153
Shepard Technologies Pvt. Ltd. (with ARN code 112358) makes no warranties or representations, express or implied, on products offered through the platform. It accepts no liability for any damages or losses, however caused, in connection with the use of, or on the reliance of its product or related services. Terms and conditions of the website are applicable.
©2026 Shepard Technologies Private Limited. All Rights Reserved